Mean State
Download Data |
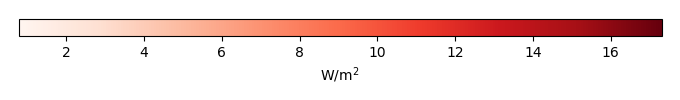
Period Mean (original grids) [W/m2] |
Model Period Mean (intersection) [W/m2] |
Model Period Mean (complement) [W/m2] |
Benchmark Period Mean (intersection) [W/m2] |
Benchmark Period Mean (complement) [W/m2] |
Bias [W/m2] |
RMSE [W/m2] |
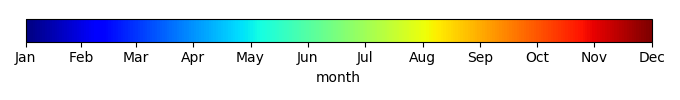
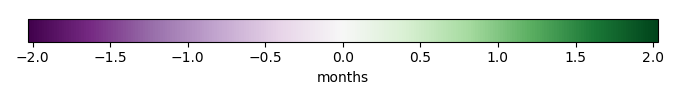
Phase Shift [months] |
Bias Score [1] |
RMSE Score [1] |
Seasonal Cycle Score [1] |
Spatial Distribution Score [1] |
Interannual Variability Score [1] |
Overall Score [1] |
|||
|---|---|---|---|---|---|---|---|---|---|---|---|---|---|---|---|---|---|
| Benchmark | [-] | 187. | |||||||||||||||
| CLM4 | [-] | 181. | 181. | 186. | 206. | -5.09 | 15.5 | 0.746 | 0.711 | 0.498 | 0.911 | 0.918 | 0.806 | 0.724 | |||
| CLM4.5 | [-] | 181. | 181. | 186. | 206. | -4.81 | 15.3 | 0.744 | 0.717 | 0.500 | 0.914 | 0.931 | 0.806 | 0.728 | |||
| CLM5 | [-] | 182. | 182. | 186. | 206. | -4.45 | 15.1 | 0.823 | 0.728 | 0.493 | 0.901 | 0.939 | 0.801 | 0.726 |
Download Data |
Period Mean (original grids) [W/m2] |
Model Period Mean (intersection) [W/m2] |
Model Period Mean (complement) [W/m2] |
Benchmark Period Mean (intersection) [W/m2] |
Benchmark Period Mean (complement) [W/m2] |
Bias [W/m2] |
RMSE [W/m2] |
Phase Shift [months] |
Bias Score [1] |
RMSE Score [1] |
Seasonal Cycle Score [1] |
Spatial Distribution Score [1] |
Interannual Variability Score [1] |
Overall Score [1] |
|||
|---|---|---|---|---|---|---|---|---|---|---|---|---|---|---|---|---|---|
| Benchmark | [-] | 198. | |||||||||||||||
| CLM4 | [-] | 193. | 193. | 198. | 214. | -4.63 | 14.4 | 0.711 | 0.704 | 0.517 | 0.923 | 0.982 | 0.857 | 0.750 | |||
| CLM4.5 | [-] | 194. | 194. | 198. | 214. | -3.67 | 14.3 | 0.718 | 0.711 | 0.516 | 0.922 | 0.975 | 0.862 | 0.750 | |||
| CLM5 | [-] | 195. | 195. | 198. | 214. | -2.80 | 14.2 | 0.767 | 0.714 | 0.516 | 0.906 | 0.964 | 0.852 | 0.745 |
Download Data |
Period Mean (original grids) [W/m2] |
Model Period Mean (intersection) [W/m2] |
Model Period Mean (complement) [W/m2] |
Benchmark Period Mean (intersection) [W/m2] |
Benchmark Period Mean (complement) [W/m2] |
Bias [W/m2] |
RMSE [W/m2] |
Phase Shift [months] |
Bias Score [1] |
RMSE Score [1] |
Seasonal Cycle Score [1] |
Spatial Distribution Score [1] |
Interannual Variability Score [1] |
Overall Score [1] |
|||
|---|---|---|---|---|---|---|---|---|---|---|---|---|---|---|---|---|---|
| Benchmark | [-] | 199. | |||||||||||||||
| CLM4 | [-] | 195. | 195. | 198. | 219. | -3.69 | 15.6 | 0.757 | 0.800 | 0.572 | 0.896 | 0.995 | 0.750 | 0.764 | |||
| CLM4.5 | [-] | 196. | 196. | 198. | 219. | -3.23 | 15.5 | 0.742 | 0.797 | 0.573 | 0.899 | 0.994 | 0.751 | 0.765 | |||
| CLM5 | [-] | 196. | 196. | 198. | 219. | -2.87 | 15.6 | 0.787 | 0.797 | 0.569 | 0.893 | 0.996 | 0.748 | 0.762 |
Download Data |
Period Mean (original grids) [W/m2] |
Model Period Mean (intersection) [W/m2] |
Model Period Mean (complement) [W/m2] |
Benchmark Period Mean (intersection) [W/m2] |
Benchmark Period Mean (complement) [W/m2] |
Bias [W/m2] |
RMSE [W/m2] |
Phase Shift [months] |
Bias Score [1] |
RMSE Score [1] |
Seasonal Cycle Score [1] |
Spatial Distribution Score [1] |
Interannual Variability Score [1] |
Overall Score [1] |
|||
|---|---|---|---|---|---|---|---|---|---|---|---|---|---|---|---|---|---|
| Benchmark | [-] | 70.7 | |||||||||||||||
| CLM4 | [-] | 66.9 | 67.0 | 70.5 | 72.8 | -3.66 | 20.9 | 0.355 | 0.906 | 0.741 | 0.976 | 0.997 | 0.804 | 0.861 | |||
| CLM4.5 | [-] | 71.7 | 71.9 | 70.5 | 72.8 | 0.485 | 18.9 | 0.332 | 0.912 | 0.764 | 0.978 | 0.991 | 0.753 | 0.860 | |||
| CLM5 | [-] | 73.1 | 73.3 | 70.5 | 72.8 | 1.86 | 18.4 | 0.331 | 0.906 | 0.772 | 0.978 | 0.996 | 0.741 | 0.861 |
Download Data |
Period Mean (original grids) [W/m2] |
Model Period Mean (intersection) [W/m2] |
Model Period Mean (complement) [W/m2] |
Benchmark Period Mean (intersection) [W/m2] |
Benchmark Period Mean (complement) [W/m2] |
Bias [W/m2] |
RMSE [W/m2] |
Phase Shift [months] |
Bias Score [1] |
RMSE Score [1] |
Seasonal Cycle Score [1] |
Spatial Distribution Score [1] |
Interannual Variability Score [1] |
Overall Score [1] |
|||
|---|---|---|---|---|---|---|---|---|---|---|---|---|---|---|---|---|---|
| Benchmark | [-] | 194. | |||||||||||||||
| CLM4 | [-] | 175. | 175. | 190. | 207. | -11.0 | 19.0 | 1.28 | 0.549 | 0.436 | 0.798 | 0.958 | 0.769 | 0.658 | |||
| CLM4.5 | [-] | 175. | 175. | 190. | 207. | -10.9 | 19.0 | 1.24 | 0.552 | 0.436 | 0.803 | 0.956 | 0.769 | 0.659 | |||
| CLM5 | [-] | 175. | 175. | 190. | 207. | -11.2 | 19.1 | 1.25 | 0.542 | 0.437 | 0.802 | 0.963 | 0.769 | 0.658 |
Download Data |
Period Mean (original grids) [W/m2] |
Model Period Mean (intersection) [W/m2] |
Model Period Mean (complement) [W/m2] |
Benchmark Period Mean (intersection) [W/m2] |
Benchmark Period Mean (complement) [W/m2] |
Bias [W/m2] |
RMSE [W/m2] |
Phase Shift [months] |
Bias Score [1] |
RMSE Score [1] |
Seasonal Cycle Score [1] |
Spatial Distribution Score [1] |
Interannual Variability Score [1] |
Overall Score [1] |
|||
|---|---|---|---|---|---|---|---|---|---|---|---|---|---|---|---|---|---|
| Benchmark | [-] | 97.8 | |||||||||||||||
| CLM4 | [-] | 102. | 102. | 97.6 | 118. | 4.49 | 15.6 | 0.227 | 0.914 | 0.819 | 0.985 | 0.998 | 0.691 | 0.871 | |||
| CLM4.5 | [-] | 99.6 | 99.6 | 97.6 | 118. | 2.33 | 16.3 | 0.232 | 0.916 | 0.808 | 0.985 | 0.998 | 0.694 | 0.868 | |||
| CLM5 | [-] | 100. | 100. | 97.6 | 118. | 2.99 | 15.5 | 0.231 | 0.921 | 0.817 | 0.985 | 0.995 | 0.687 | 0.870 |
Download Data |
Period Mean (original grids) [W/m2] |
Model Period Mean (intersection) [W/m2] |
Model Period Mean (complement) [W/m2] |
Benchmark Period Mean (intersection) [W/m2] |
Benchmark Period Mean (complement) [W/m2] |
Bias [W/m2] |
RMSE [W/m2] |
Phase Shift [months] |
Bias Score [1] |
RMSE Score [1] |
Seasonal Cycle Score [1] |
Spatial Distribution Score [1] |
Interannual Variability Score [1] |
Overall Score [1] |
|||
|---|---|---|---|---|---|---|---|---|---|---|---|---|---|---|---|---|---|
| Benchmark | [-] | 139. | |||||||||||||||
| CLM4 | [-] | 135. | 134. | 138. | 149. | -3.52 | 16.8 | 0.371 | 0.869 | 0.762 | 0.968 | 0.995 | 0.666 | 0.837 | |||
| CLM4.5 | [-] | 134. | 133. | 138. | 149. | -4.24 | 16.5 | 0.344 | 0.866 | 0.767 | 0.971 | 0.997 | 0.660 | 0.838 | |||
| CLM5 | [-] | 135. | 135. | 138. | 149. | -2.61 | 15.9 | 0.340 | 0.883 | 0.767 | 0.972 | 0.999 | 0.666 | 0.842 |
Download Data |
Period Mean (original grids) [W/m2] |
Model Period Mean (intersection) [W/m2] |
Model Period Mean (complement) [W/m2] |
Benchmark Period Mean (intersection) [W/m2] |
Benchmark Period Mean (complement) [W/m2] |
Bias [W/m2] |
RMSE [W/m2] |
Phase Shift [months] |
Bias Score [1] |
RMSE Score [1] |
Seasonal Cycle Score [1] |
Spatial Distribution Score [1] |
Interannual Variability Score [1] |
Overall Score [1] |
|||
|---|---|---|---|---|---|---|---|---|---|---|---|---|---|---|---|---|---|
| Benchmark | [-] | 181. | |||||||||||||||
| CLM4 | [-] | 173. | 173. | 179. | 205. | -4.55 | 18.4 | 0.346 | 0.765 | 0.610 | 0.972 | 0.971 | 0.730 | 0.776 | |||
| CLM4.5 | [-] | 174. | 173. | 179. | 205. | -4.18 | 18.3 | 0.342 | 0.761 | 0.611 | 0.972 | 0.961 | 0.724 | 0.774 | |||
| CLM5 | [-] | 174. | 174. | 179. | 205. | -3.72 | 18.1 | 0.320 | 0.770 | 0.610 | 0.974 | 0.938 | 0.722 | 0.771 |
Download Data |
Period Mean (original grids) [W/m2] |
Model Period Mean (intersection) [W/m2] |
Model Period Mean (complement) [W/m2] |
Benchmark Period Mean (intersection) [W/m2] |
Benchmark Period Mean (complement) [W/m2] |
Bias [W/m2] |
RMSE [W/m2] |
Phase Shift [months] |
Bias Score [1] |
RMSE Score [1] |
Seasonal Cycle Score [1] |
Spatial Distribution Score [1] |
Interannual Variability Score [1] |
Overall Score [1] |
|||
|---|---|---|---|---|---|---|---|---|---|---|---|---|---|---|---|---|---|
| Benchmark | [-] | 62.8 | |||||||||||||||
| CLM4 | [-] | 59.4 | 59.8 | 63.2 | 54.4 | -4.15 | 18.4 | 0.210 | 0.917 | 0.759 | 0.986 | 0.990 | 0.791 | 0.867 | |||
| CLM4.5 | [-] | 62.0 | 62.3 | 63.2 | 54.4 | -1.89 | 16.8 | 0.165 | 0.930 | 0.777 | 0.989 | 0.986 | 0.745 | 0.867 | |||
| CLM5 | [-] | 64.7 | 65.0 | 63.2 | 54.4 | 0.684 | 15.6 | 0.199 | 0.931 | 0.792 | 0.987 | 0.990 | 0.748 | 0.873 |
Download Data |
Period Mean (original grids) [W/m2] |
Model Period Mean (intersection) [W/m2] |
Model Period Mean (complement) [W/m2] |
Benchmark Period Mean (intersection) [W/m2] |
Benchmark Period Mean (complement) [W/m2] |
Bias [W/m2] |
RMSE [W/m2] |
Phase Shift [months] |
Bias Score [1] |
RMSE Score [1] |
Seasonal Cycle Score [1] |
Spatial Distribution Score [1] |
Interannual Variability Score [1] |
Overall Score [1] |
|||
|---|---|---|---|---|---|---|---|---|---|---|---|---|---|---|---|---|---|
| Benchmark | [-] | 198. | |||||||||||||||
| CLM4 | [-] | 191. | 191. | 198. | 197. | -8.80 | 16.0 | 0.341 | 0.827 | 0.769 | 0.975 | 1.00 | 0.717 | 0.843 | |||
| CLM4.5 | [-] | 191. | 191. | 198. | 197. | -8.85 | 16.1 | 0.334 | 0.824 | 0.769 | 0.975 | 1.00 | 0.718 | 0.842 | |||
| CLM5 | [-] | 192. | 192. | 198. | 197. | -7.59 | 15.6 | 0.385 | 0.846 | 0.765 | 0.971 | 0.999 | 0.718 | 0.844 |
Download Data |
Period Mean (original grids) [W/m2] |
Model Period Mean (intersection) [W/m2] |
Model Period Mean (complement) [W/m2] |
Benchmark Period Mean (intersection) [W/m2] |
Benchmark Period Mean (complement) [W/m2] |
Bias [W/m2] |
RMSE [W/m2] |
Phase Shift [months] |
Bias Score [1] |
RMSE Score [1] |
Seasonal Cycle Score [1] |
Spatial Distribution Score [1] |
Interannual Variability Score [1] |
Overall Score [1] |
|||
|---|---|---|---|---|---|---|---|---|---|---|---|---|---|---|---|---|---|
| Benchmark | [-] | 120. | |||||||||||||||
| CLM4 | [-] | 112. | 112. | 118. | 145. | -3.16 | 14.9 | 0.242 | 0.916 | 0.824 | 0.984 | 0.998 | 0.683 | 0.872 | |||
| CLM4.5 | [-] | 113. | 113. | 118. | 145. | -2.25 | 13.7 | 0.229 | 0.923 | 0.837 | 0.985 | 0.992 | 0.667 | 0.873 | |||
| CLM5 | [-] | 113. | 113. | 118. | 145. | -2.30 | 13.6 | 0.227 | 0.921 | 0.839 | 0.985 | 0.990 | 0.660 | 0.872 |
Download Data |
Period Mean (original grids) [W/m2] |
Model Period Mean (intersection) [W/m2] |
Model Period Mean (complement) [W/m2] |
Benchmark Period Mean (intersection) [W/m2] |
Benchmark Period Mean (complement) [W/m2] |
Bias [W/m2] |
RMSE [W/m2] |
Phase Shift [months] |
Bias Score [1] |
RMSE Score [1] |
Seasonal Cycle Score [1] |
Spatial Distribution Score [1] |
Interannual Variability Score [1] |
Overall Score [1] |
|||
|---|---|---|---|---|---|---|---|---|---|---|---|---|---|---|---|---|---|
| Benchmark | [-] | 163. | |||||||||||||||
| CLM4 | [-] | 135. | 135. | 142. | 173. | -5.68 | 16.9 | 0.391 | 0.805 | 0.699 | 0.959 | 0.998 | 0.712 | 0.812 | |||
| CLM4.5 | [-] | 136. | 136. | 142. | 173. | -5.10 | 16.2 | 0.383 | 0.815 | 0.707 | 0.960 | 0.998 | 0.719 | 0.817 | |||
| CLM5 | [-] | 137. | 137. | 142. | 173. | -4.59 | 16.0 | 0.394 | 0.818 | 0.705 | 0.958 | 0.998 | 0.713 | 0.816 |
Download Data |
Period Mean (original grids) [W/m2] |
Model Period Mean (intersection) [W/m2] |
Model Period Mean (complement) [W/m2] |
Benchmark Period Mean (intersection) [W/m2] |
Benchmark Period Mean (complement) [W/m2] |
Bias [W/m2] |
RMSE [W/m2] |
Phase Shift [months] |
Bias Score [1] |
RMSE Score [1] |
Seasonal Cycle Score [1] |
Spatial Distribution Score [1] |
Interannual Variability Score [1] |
Overall Score [1] |
|||
|---|---|---|---|---|---|---|---|---|---|---|---|---|---|---|---|---|---|
| Benchmark | [-] | 177. | |||||||||||||||
| CLM4 | [-] | 160. | 160. | 175. | 217. | -13.9 | 18.9 | 0.288 | 0.686 | 0.770 | 0.979 | 0.961 | 0.667 | 0.805 | |||
| CLM4.5 | [-] | 161. | 161. | 175. | 217. | -13.3 | 18.5 | 0.287 | 0.692 | 0.771 | 0.979 | 0.962 | 0.667 | 0.807 | |||
| CLM5 | [-] | 162. | 162. | 175. | 217. | -12.0 | 18.0 | 0.296 | 0.708 | 0.763 | 0.978 | 0.960 | 0.674 | 0.808 |
Download Data |
Period Mean (original grids) [W/m2] |
Model Period Mean (intersection) [W/m2] |
Model Period Mean (complement) [W/m2] |
Benchmark Period Mean (intersection) [W/m2] |
Benchmark Period Mean (complement) [W/m2] |
Bias [W/m2] |
RMSE [W/m2] |
Phase Shift [months] |
Bias Score [1] |
RMSE Score [1] |
Seasonal Cycle Score [1] |
Spatial Distribution Score [1] |
Interannual Variability Score [1] |
Overall Score [1] |
|||
|---|---|---|---|---|---|---|---|---|---|---|---|---|---|---|---|---|---|
| Benchmark | [-] | 69.7 | |||||||||||||||
| CLM4 | [-] | 67.6 | 67.5 | 69.6 | 71.1 | -3.27 | 18.6 | 0.120 | 0.906 | 0.768 | 0.992 | 0.984 | 0.785 | 0.867 | |||
| CLM4.5 | [-] | 70.6 | 70.5 | 69.6 | 71.1 | -0.637 | 16.9 | 0.103 | 0.917 | 0.784 | 0.993 | 0.986 | 0.756 | 0.870 | |||
| CLM5 | [-] | 70.7 | 70.6 | 69.6 | 71.1 | -0.616 | 17.1 | 0.0938 | 0.915 | 0.784 | 0.994 | 0.981 | 0.747 | 0.867 |
Download Data |
Period Mean (original grids) [W/m2] |
Model Period Mean (intersection) [W/m2] |
Model Period Mean (complement) [W/m2] |
Benchmark Period Mean (intersection) [W/m2] |
Benchmark Period Mean (complement) [W/m2] |
Bias [W/m2] |
RMSE [W/m2] |
Phase Shift [months] |
Bias Score [1] |
RMSE Score [1] |
Seasonal Cycle Score [1] |
Spatial Distribution Score [1] |
Interannual Variability Score [1] |
Overall Score [1] |
|||
|---|---|---|---|---|---|---|---|---|---|---|---|---|---|---|---|---|---|
| Benchmark | [-] | 204. | |||||||||||||||
| CLM4 | [-] | 191. | 192. | 201. | 219. | -6.78 | 16.9 | 0.484 | 0.761 | 0.679 | 0.940 | 0.988 | 0.754 | 0.800 | |||
| CLM4.5 | [-] | 191. | 191. | 201. | 219. | -7.27 | 17.0 | 0.495 | 0.762 | 0.678 | 0.940 | 0.987 | 0.757 | 0.800 | |||
| CLM5 | [-] | 192. | 192. | 201. | 219. | -6.91 | 16.8 | 0.470 | 0.768 | 0.678 | 0.943 | 0.986 | 0.754 | 0.801 |
Download Data |
Period Mean (original grids) [W/m2] |
Model Period Mean (intersection) [W/m2] |
Model Period Mean (complement) [W/m2] |
Benchmark Period Mean (intersection) [W/m2] |
Benchmark Period Mean (complement) [W/m2] |
Bias [W/m2] |
RMSE [W/m2] |
Phase Shift [months] |
Bias Score [1] |
RMSE Score [1] |
Seasonal Cycle Score [1] |
Spatial Distribution Score [1] |
Interannual Variability Score [1] |
Overall Score [1] |
|||
|---|---|---|---|---|---|---|---|---|---|---|---|---|---|---|---|---|---|
| Benchmark | [-] | 150. | |||||||||||||||
| CLM4 | [-] | 146. | 146. | 148. | 192. | -0.358 | 14.0 | 0.269 | 0.929 | 0.796 | 0.982 | 0.980 | 0.693 | 0.863 | |||
| CLM4.5 | [-] | 145. | 145. | 148. | 192. | -1.23 | 13.6 | 0.275 | 0.937 | 0.797 | 0.982 | 0.985 | 0.705 | 0.867 | |||
| CLM5 | [-] | 145. | 145. | 148. | 192. | -2.06 | 13.6 | 0.274 | 0.938 | 0.797 | 0.982 | 0.987 | 0.700 | 0.867 |
Download Data |
Period Mean (original grids) [W/m2] |
Model Period Mean (intersection) [W/m2] |
Model Period Mean (complement) [W/m2] |
Benchmark Period Mean (intersection) [W/m2] |
Benchmark Period Mean (complement) [W/m2] |
Bias [W/m2] |
RMSE [W/m2] |
Phase Shift [months] |
Bias Score [1] |
RMSE Score [1] |
Seasonal Cycle Score [1] |
Spatial Distribution Score [1] |
Interannual Variability Score [1] |
Overall Score [1] |
|||
|---|---|---|---|---|---|---|---|---|---|---|---|---|---|---|---|---|---|
| Benchmark | [-] | 110. | |||||||||||||||
| CLM4 | [-] | 111. | 111. | 110. | 117. | 1.62 | 14.4 | 0.121 | 0.919 | 0.833 | 0.992 | 0.979 | 0.695 | 0.875 | |||
| CLM4.5 | [-] | 112. | 112. | 110. | 117. | 2.22 | 14.0 | 0.115 | 0.922 | 0.838 | 0.992 | 0.995 | 0.667 | 0.875 | |||
| CLM5 | [-] | 111. | 111. | 110. | 117. | 1.63 | 13.7 | 0.114 | 0.925 | 0.840 | 0.992 | 0.999 | 0.676 | 0.879 |
Download Data |
Period Mean (original grids) [W/m2] |
Model Period Mean (intersection) [W/m2] |
Model Period Mean (complement) [W/m2] |
Benchmark Period Mean (intersection) [W/m2] |
Benchmark Period Mean (complement) [W/m2] |
Bias [W/m2] |
RMSE [W/m2] |
Phase Shift [months] |
Bias Score [1] |
RMSE Score [1] |
Seasonal Cycle Score [1] |
Spatial Distribution Score [1] |
Interannual Variability Score [1] |
Overall Score [1] |
|||
|---|---|---|---|---|---|---|---|---|---|---|---|---|---|---|---|---|---|
| Benchmark | [-] | 161. | |||||||||||||||
| CLM4 | [-] | 158. | 158. | 161. | 163. | -2.90 | 15.3 | 0.193 | 0.916 | 0.817 | 0.987 | 0.982 | 0.687 | 0.868 | |||
| CLM4.5 | [-] | 157. | 157. | 161. | 163. | -3.91 | 14.7 | 0.186 | 0.912 | 0.824 | 0.988 | 0.987 | 0.708 | 0.874 | |||
| CLM5 | [-] | 159. | 159. | 161. | 163. | -1.43 | 14.3 | 0.202 | 0.931 | 0.822 | 0.986 | 0.985 | 0.698 | 0.874 |
Download Data |
Period Mean (original grids) [W/m2] |
Model Period Mean (intersection) [W/m2] |
Model Period Mean (complement) [W/m2] |
Benchmark Period Mean (intersection) [W/m2] |
Benchmark Period Mean (complement) [W/m2] |
Bias [W/m2] |
RMSE [W/m2] |
Phase Shift [months] |
Bias Score [1] |
RMSE Score [1] |
Seasonal Cycle Score [1] |
Spatial Distribution Score [1] |
Interannual Variability Score [1] |
Overall Score [1] |
|||
|---|---|---|---|---|---|---|---|---|---|---|---|---|---|---|---|---|---|
| Benchmark | [-] | 179. | |||||||||||||||
| CLM4 | [-] | 173. | 173. | 178. | 218. | -3.73 | 14.4 | 0.787 | 0.725 | 0.451 | 0.899 | 0.963 | 0.804 | 0.716 | |||
| CLM4.5 | [-] | 173. | 173. | 178. | 218. | -3.54 | 14.4 | 0.787 | 0.732 | 0.452 | 0.900 | 0.957 | 0.805 | 0.716 | |||
| CLM5 | [-] | 173. | 173. | 178. | 218. | -3.71 | 14.5 | 0.798 | 0.732 | 0.449 | 0.896 | 0.956 | 0.805 | 0.714 |
Download Data |
Period Mean (original grids) [W/m2] |
Model Period Mean (intersection) [W/m2] |
Model Period Mean (complement) [W/m2] |
Benchmark Period Mean (intersection) [W/m2] |
Benchmark Period Mean (complement) [W/m2] |
Bias [W/m2] |
RMSE [W/m2] |
Phase Shift [months] |
Bias Score [1] |
RMSE Score [1] |
Seasonal Cycle Score [1] |
Spatial Distribution Score [1] |
Interannual Variability Score [1] |
Overall Score [1] |
|||
|---|---|---|---|---|---|---|---|---|---|---|---|---|---|---|---|---|---|
| Benchmark | [-] | 185. | |||||||||||||||
| CLM4 | [-] | 180. | 181. | 184. | 202. | -3.68 | 15.7 | 0.679 | 0.822 | 0.643 | 0.916 | 0.954 | 0.722 | 0.784 | |||
| CLM4.5 | [-] | 180. | 180. | 184. | 202. | -3.85 | 15.8 | 0.646 | 0.818 | 0.643 | 0.921 | 0.955 | 0.722 | 0.784 | |||
| CLM5 | [-] | 180. | 180. | 184. | 202. | -4.33 | 15.8 | 0.702 | 0.816 | 0.642 | 0.912 | 0.970 | 0.717 | 0.783 |
Download Data |
Period Mean (original grids) [W/m2] |
Model Period Mean (intersection) [W/m2] |
Model Period Mean (complement) [W/m2] |
Benchmark Period Mean (intersection) [W/m2] |
Benchmark Period Mean (complement) [W/m2] |
Bias [W/m2] |
RMSE [W/m2] |
Phase Shift [months] |
Bias Score [1] |
RMSE Score [1] |
Seasonal Cycle Score [1] |
Spatial Distribution Score [1] |
Interannual Variability Score [1] |
Overall Score [1] |
|||
|---|---|---|---|---|---|---|---|---|---|---|---|---|---|---|---|---|---|
| Benchmark | [-] | 178. | |||||||||||||||
| CLM4 | [-] | 174. | 173. | 179. | 169. | -9.99 | 22.1 | 0.392 | 0.764 | 0.710 | 0.960 | 0.998 | 0.690 | 0.805 | |||
| CLM4.5 | [-] | 175. | 174. | 179. | 169. | -9.42 | 21.8 | 0.385 | 0.767 | 0.713 | 0.961 | 0.997 | 0.687 | 0.806 | |||
| CLM5 | [-] | 176. | 175. | 179. | 169. | -8.13 | 21.0 | 0.401 | 0.784 | 0.713 | 0.958 | 0.998 | 0.686 | 0.808 |
Temporally integrated period mean