Mean State
Download Data |
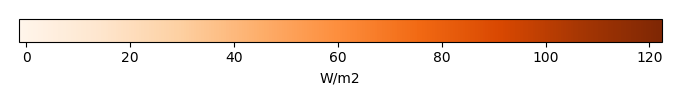
Period Mean (original grids) [W/m2] |
Model Period Mean (intersection) [W/m2] |
Model Period Mean (complement) [W/m2] |
Benchmark Period Mean (intersection) [W/m2] |
Benchmark Period Mean (complement) [W/m2] |
Bias [W/m2] |
RMSE [W/m2] |
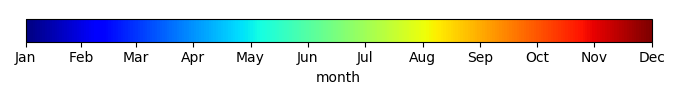
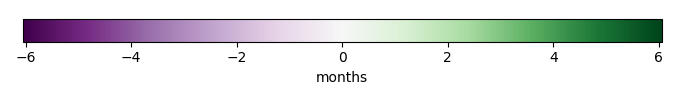
Phase Shift [months] |
Bias Score [1] |
RMSE Score [1] |
Seasonal Cycle Score [1] |
Spatial Distribution Score [1] |
Overall Score [1] |
|||
|---|---|---|---|---|---|---|---|---|---|---|---|---|---|---|---|---|
| Benchmark | [-] | 39.1 | ||||||||||||||
| CESM2_202_01 | [-] | 35.7 | 42.2 | 9.50 | 39.4 | 16.8 | 3.16 | 18.5 | 1.07 | 0.58 | 0.40 | 0.80 | 0.97 | 0.63 | ||
| CESM2_227_01 | [-] | 35.9 | 42.3 | 9.46 | 39.4 | 16.8 | 3.34 | 18.3 | 1.07 | 0.58 | 0.40 | 0.81 | 0.97 | 0.63 | ||
| CESM2_297_01 | [-] | 36.3 | 42.9 | 9.54 | 39.4 | 16.8 | 3.87 | 18.5 | 1.08 | 0.58 | 0.40 | 0.80 | 0.97 | 0.63 | ||
| CLM45BGC | [-] | 39.3 | 46.6 | 9.52 | 39.4 | 16.5 | 7.61 | 21.1 | 1.10 | 0.54 | 0.37 | 0.82 | 0.97 | 0.61 | ||
| LENS1 | [-] | 41.8 | 49.3 | 11.3 | 39.4 | 16.5 | 10.5 | 23.1 | 1.12 | 0.52 | 0.35 | 0.80 | 0.95 | 0.60 |
Temporally integrated period mean