Download Data |
Period Mean (original grids) [Pg yr-1] |
Model Period Mean (intersection) [Pg yr-1] |
Model Period Mean (complement) [Pg yr-1] |
Benchmark Period Mean (intersection) [Pg yr-1] |
Benchmark Period Mean (complement) [Pg yr-1] |
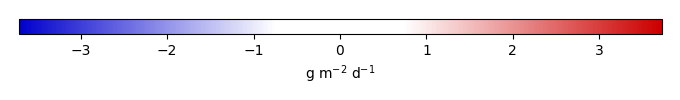
Bias [g m-2 d-1] |
RMSE [g m-2 d-1] |
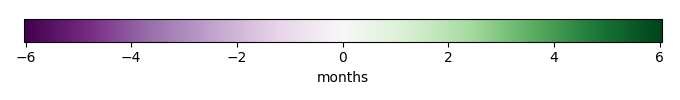
Phase Shift [months] |
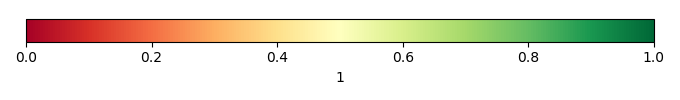
Bias Score [1] |
RMSE Score [1] |
Seasonal Cycle Score [1] |
Spatial Distribution Score [1] |
Overall Score [1] |
|||
---|---|---|---|---|---|---|---|---|---|---|---|---|---|---|---|---|
Benchmark | [-] | 119. | ||||||||||||||
CESM2_1_001 | [-] | 111. | 106. | 4.83 | 118. | 0.774 | -0.0797 | 1.73 | 1.52 | 0.412 | 0.362 | 0.786 | 0.934 | 0.571 | ||
CESM2_1_002 | [-] | 112. | 107. | 4.86 | 118. | 0.774 | -0.0659 | 1.74 | 1.52 | 0.413 | 0.363 | 0.785 | 0.935 | 0.572 | ||
CESM2_1_003 | [-] | 111. | 106. | 4.84 | 118. | 0.774 | -0.0764 | 1.73 | 1.53 | 0.412 | 0.364 | 0.782 | 0.935 | 0.571 | ||
LENS1 | [-] | 131. | 125. | 5.28 | 118. | 0.802 | 0.358 | 1.68 | 1.37 | 0.408 | 0.347 | 0.764 | 0.896 | 0.552 | ||
LENS10 | [-] | 131. | 125. | 5.29 | 118. | 0.802 | 0.354 | 1.67 | 1.38 | 0.408 | 0.348 | 0.758 | 0.895 | 0.551 | ||
LENS5 | [-] | 131. | 126. | 5.38 | 118. | 0.802 | 0.373 | 1.68 | 1.39 | 0.408 | 0.349 | 0.753 | 0.893 | 0.550 |
Download Data |
Evapotranspiration Hellinger Distance [1] |
Precipitation Hellinger Distance [1] |
SurfaceDownwardSWRadiation Hellinger Distance [1] |
SurfaceNetSWRadiation Hellinger Distance [1] |
SurfaceAirTemperature Hellinger Distance [1] |
Evapotranspiration RMSE Score [1] |
Precipitation RMSE Score [1] |
SurfaceDownwardSWRadiation RMSE Score [1] |
SurfaceNetSWRadiation RMSE Score [1] |
SurfaceAirTemperature RMSE Score [1] |
Overall Score [1] |
||
---|---|---|---|---|---|---|---|---|---|---|---|---|---|
CESM2_1_001 | [-] | 0.264 | 0.221 | 0.334 | 0.318 | 0.251 | 0.840 | 0.879 | 0.812 | 0.799 | 0.875 | 0.841 | |
CESM2_1_002 | [-] | 0.265 | 0.219 | 0.334 | 0.317 | 0.249 | 0.843 | 0.888 | 0.809 | 0.791 | 0.878 | 0.842 | |
CESM2_1_003 | [-] | 0.265 | 0.223 | 0.335 | 0.320 | 0.260 | 0.842 | 0.886 | 0.810 | 0.788 | 0.876 | 0.841 | |
LENS1 | [-] | 0.306 | 0.245 | 0.335 | 0.335 | 0.257 | 0.825 | 0.769 | 0.577 | 0.584 | 0.639 | 0.679 | |
LENS10 | [-] | 0.304 | 0.246 | 0.336 | 0.329 | 0.260 | 0.824 | 0.768 | 0.586 | 0.590 | 0.637 | 0.681 | |
LENS5 | [-] | 0.303 | 0.243 | 0.338 | 0.322 | 0.259 | 0.820 | 0.778 | 0.576 | 0.585 | 0.638 | 0.679 |
creation_date: Wed Dec 4 23:59:04 PST 2013
Conventions: Please contact Prof. James Randerson (Email: jranders@uci.edu) or Dr. Mingquan Mu (mmu@uci.edu) for any question
source_file: This product is generated from monthly FluxNet MTE observations
title: derived FluxNet MTE in 0.5x0.5
Approach: I read this variable from data file, and then save the data in NetCDF format by each month and each year. Meanwhile, I also converted the unit from g C m-2 day-1 to Kg C m-2 s-1.
Temporal resolution: monthly
General information: This product was derived from Fluxnet-MTE originally from Monthly estimates of global biosphere-atmosphere fluxes from Biogeochemistry group at Max Planck Institute in Jena, Germany.
Spatial resolution: 0.5x0.5 degree
Derived data code: http://redwood.ess.uci.edu/mingquan/www/ILAMB/Download/CODES/CODES/subroutines/convert/convert-FluxNet-MTE.ncl