Mean State
Download Data |
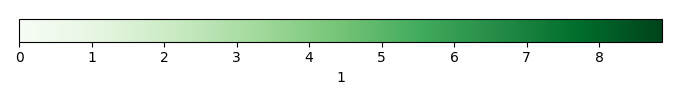
Period Mean (original grids) [1] |
Model Period Mean (intersection) [1] |
Model Period Mean (complement) [1] |
Benchmark Period Mean (intersection) [1] |
Benchmark Period Mean (complement) [1] |
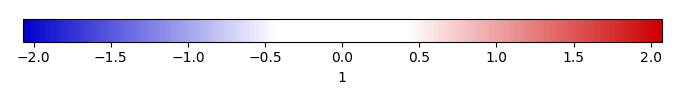
Bias [1] |
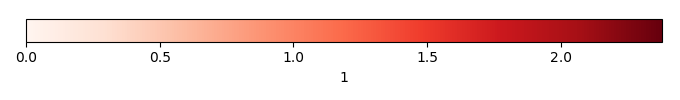
RMSE [1] |
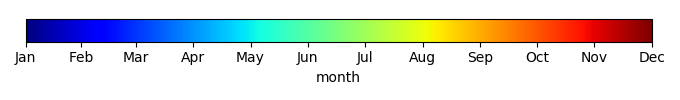
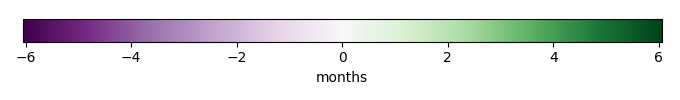
Phase Shift [months] |
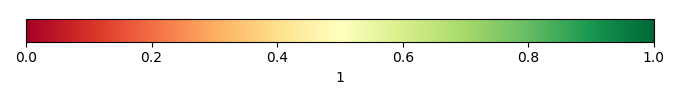
Bias Score [1] |
RMSE Score [1] |
Seasonal Cycle Score [1] |
Spatial Distribution Score [1] |
Interannual Variability Score [1] |
Overall Score [1] |
|||
|---|---|---|---|---|---|---|---|---|---|---|---|---|---|---|---|---|---|
| Benchmark | [-] | 1.50 | |||||||||||||||
| CESM2_1_001 | [-] | 1.36 | 1.70 | 0.202 | 1.48 | 1.91 | 0.253 | 1.20 | 2.19 | 0.390 | 0.324 | 0.646 | 0.847 | 0.566 | 0.516 | ||
| CESM2_1_002 | [-] | 1.36 | 1.70 | 0.204 | 1.48 | 1.91 | 0.259 | 1.21 | 2.19 | 0.386 | 0.323 | 0.646 | 0.847 | 0.561 | 0.514 | ||
| CESM2_1_003 | [-] | 1.36 | 1.70 | 0.202 | 1.48 | 1.91 | 0.256 | 1.20 | 2.18 | 0.384 | 0.324 | 0.645 | 0.845 | 0.569 | 0.515 | ||
| LENS1 | [-] | 2.01 | 2.53 | 0.205 | 1.48 | 1.83 | 1.10 | 1.75 | 2.15 | 0.238 | 0.253 | 0.679 | 0.568 | 0.397 | 0.398 | ||
| LENS10 | [-] | 2.00 | 2.53 | 0.206 | 1.48 | 1.83 | 1.10 | 1.75 | 2.17 | 0.235 | 0.257 | 0.677 | 0.566 | 0.401 | 0.399 | ||
| LENS5 | [-] | 2.02 | 2.55 | 0.209 | 1.48 | 1.83 | 1.12 | 1.76 | 2.19 | 0.234 | 0.262 | 0.669 | 0.559 | 0.412 | 0.400 |
Temporally integrated period mean