Mean State
Download Data |
Period Mean (original grids) [Pg] |
Model Period Mean (intersection) [Pg] |
Model Period Mean (complement) [Pg] |
Benchmark Period Mean (intersection) [Pg] |
Benchmark Period Mean (complement) [Pg] |
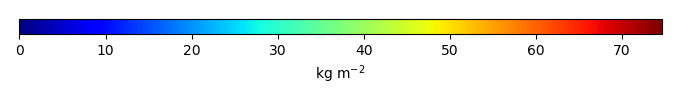
Bias [kg m-2] |
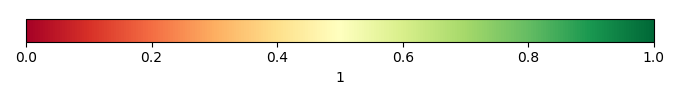
Bias Score [1] |
Spatial Distribution Score [1] |
Overall Score [1] |
|||
|---|---|---|---|---|---|---|---|---|---|---|---|---|
| Benchmark | [-] | 1.09e+03 | ||||||||||
| CESM2_1_001 | [-] | 967. | 621. | 346. | 1.03e+03 | 54.5 | -2.56 | 0.604 | 0.139 | 0.371 | ||
| CESM2_1_002 | [-] | 967. | 621. | 346. | 1.03e+03 | 54.5 | -2.56 | 0.604 | 0.139 | 0.371 | ||
| CESM2_1_003 | [-] | 967. | 620. | 347. | 1.03e+03 | 54.5 | -2.56 | 0.603 | 0.139 | 0.371 | ||
| LENS1 | [-] | 548. | 471. | 77.1 | 1.03e+03 | 55.6 | -4.30 | 0.591 | 0.611 | 0.601 | ||
| LENS10 | [-] | 549. | 471. | 77.1 | 1.03e+03 | 55.6 | -4.29 | 0.592 | 0.612 | 0.602 | ||
| LENS5 | [-] | 548. | 471. | 77.1 | 1.03e+03 | 55.6 | -4.29 | 0.591 | 0.612 | 0.602 |
Temporally integrated period mean