Mean State
Download Data |
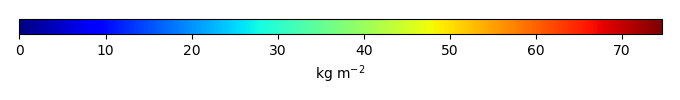
Period Mean (original grids) [Pg] |
Model Period Mean (intersection) [Pg] |
Model Period Mean (complement) [Pg] |
Benchmark Period Mean (intersection) [Pg] |
Benchmark Period Mean (complement) [Pg] |
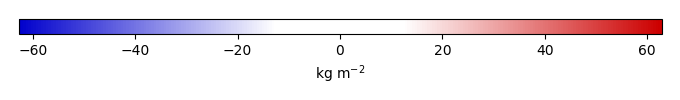
Bias [kg m-2] |
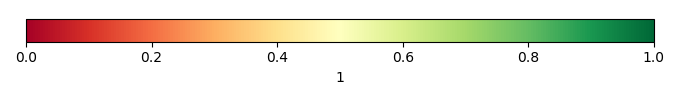
Bias Score [1] |
Spatial Distribution Score [1] |
Overall Score [1] |
|||
|---|---|---|---|---|---|---|---|---|---|---|---|---|
| Benchmark | [-] | 475. | ||||||||||
| CESM2_1_001 | [-] | 967. | 321. | 646. | 474. | 1.51 | -5.31 | 0.545 | 0.248 | 0.397 | ||
| CESM2_1_002 | [-] | 967. | 321. | 646. | 474. | 1.51 | -5.30 | 0.545 | 0.248 | 0.397 | ||
| CESM2_1_003 | [-] | 967. | 321. | 646. | 474. | 1.51 | -5.29 | 0.546 | 0.248 | 0.397 | ||
| LENS1 | [-] | 548. | 70.0 | 478. | 474. | 1.51 | -17.8 | 0.433 | 0.118 | 0.275 | ||
| LENS10 | [-] | 549. | 70.0 | 479. | 474. | 1.51 | -17.8 | 0.433 | 0.118 | 0.275 | ||
| LENS5 | [-] | 548. | 69.9 | 478. | 474. | 1.51 | -17.8 | 0.433 | 0.118 | 0.275 |
Temporally integrated period mean