| Precipitation Rate | f.cam5_4_19.FAMPIC5.ne120_ne120.Club_001 | GPCP | CAM3 T42 | CAM3 T85 |
|---|---|---|---|---|
| Outgoing LW Radiation | f.cam5_4_19.FAMPIC5.ne120_ne120.Club_001 | ERBS | CAM3 T42 | CAM3 T85 |
| TOA Net SW Radiation | f.cam5_4_19.FAMPIC5.ne120_ne120.Club_001 | ERBS | CAM3 T42 | CAM3 T85 |
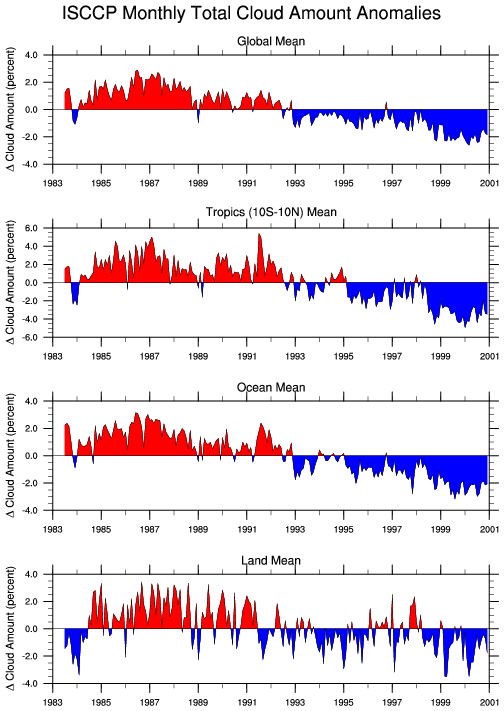
| Total Cloud Amount | f.cam5_4_19.FAMPIC5.ne120_ne120.Club_001 | ISCCP | CAM3 T42 | CAM3 T85 |
| Sea Surface Temperature | f.cam5_4_19.FAMPIC5.ne120_ne120.Club_001 | NCEP | CAM3 T42 | CAM3 T85 |
| 850 mb Zonal Wind | f.cam5_4_19.FAMPIC5.ne120_ne120.Club_001 | NCEP | CAM3 T42 | CAM3 T85 |
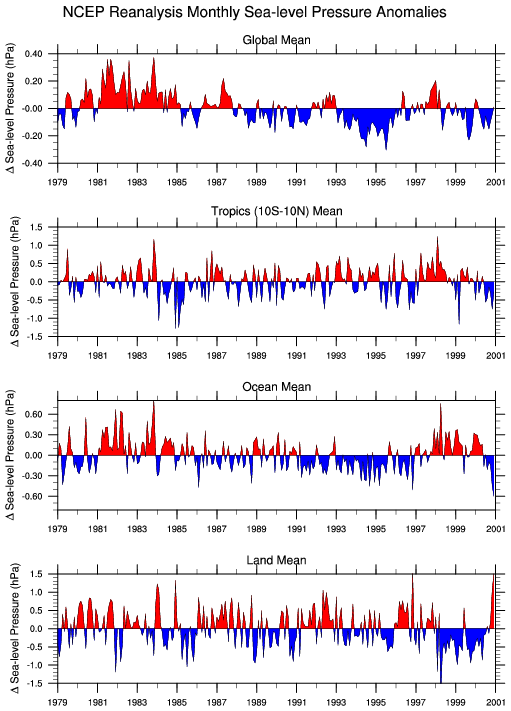
| Sea-Level Pressure | f.cam5_4_19.FAMPIC5.ne120_ne120.Club_001 | NCEP | CAM3 T42 | CAM3 T85 |
| Surface Temperature | f.cam5_4_19.FAMPIC5.ne120_ne120.Club_001 | NCEP | CAM3 T42 | CAM3 T85 |
|---|---|---|---|---|
| Niño 1&2, 3, 4 SSTs | f.cam5_4_19.FAMPIC5.ne120_ne120.Club_001 | NCEP | specified | |
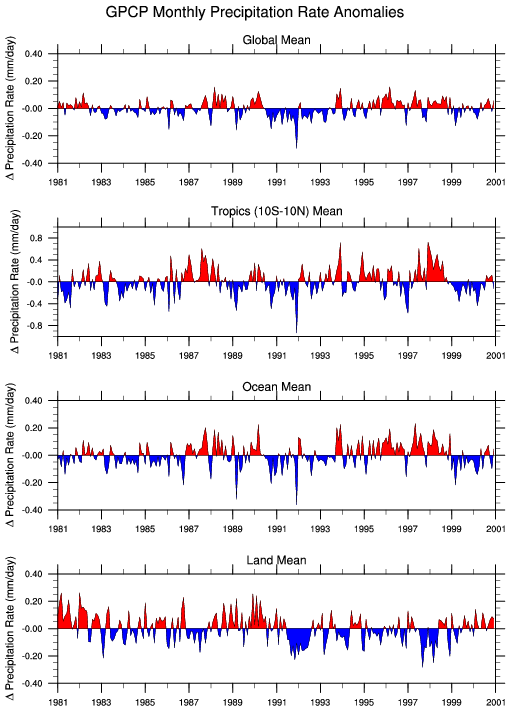
| Precipitation Rate | f.cam5_4_19.FAMPIC5.ne120_ne120.Club_001 | GPCP | CAM3 T42 | CAM3 T85 |
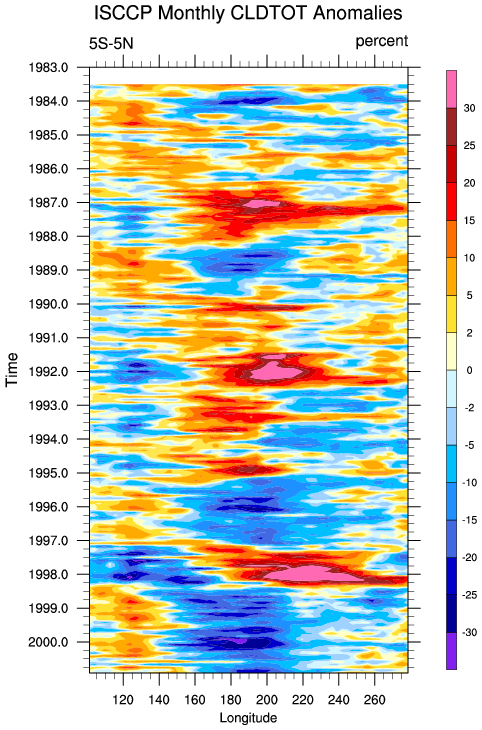
| Total Cloud Amount | f.cam5_4_19.FAMPIC5.ne120_ne120.Club_001 | ISCCP | CAM3 T42 | CAM3 T85 |
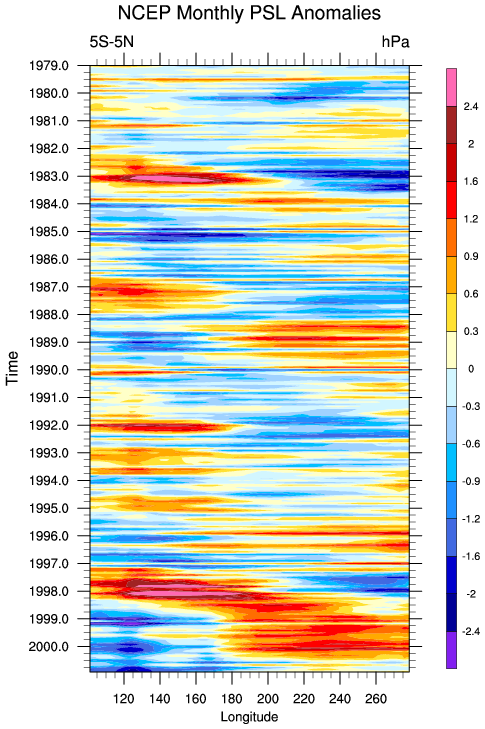
| Sea-Level Pressure | f.cam5_4_19.FAMPIC5.ne120_ne120.Club_001 | NCEP | CAM3 T42 | CAM3 T85 |
| North Atlantic | f.cam5_4_19.FAMPIC5.ne120_ne120.Club_001 | NCEP | CAM3 T42 | CAM3 T85 |
|---|---|---|---|---|
| North Pacific | f.cam5_4_19.FAMPIC5.ne120_ne120.Club_001 | NCEP | CAM3 T42 | CAM3 T85 |
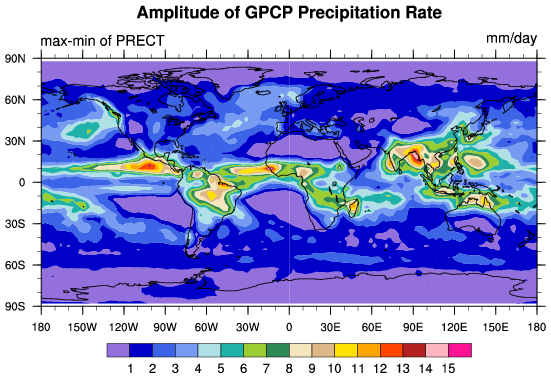
| Precipitation Rate Amplitude (Max-Min) | f.cam5_4_19.FAMPIC5.ne120_ne120.Club_001 | GPCP | CAM3 T42 | CAM3 T85 |
|---|---|---|---|---|
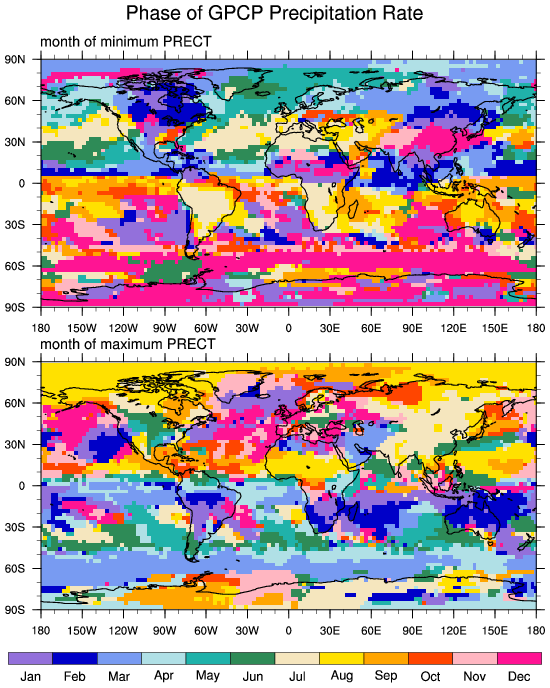
| Precipitation Rate Month of Max and Min | f.cam5_4_19.FAMPIC5.ne120_ne120.Club_001 | GPCP | CAM3 T42 | CAM3 T85 |
| Temperature Ref Height Amplitude (Max-Min) | f.cam5_4_19.FAMPIC5.ne120_ne120.Club_001 | NCEP | CAM3 T42 | CAM3 T85 |
| Temperature Ref Height Month of Max and Min | f.cam5_4_19.FAMPIC5.ne120_ne120.Club_001 | NCEP | CAM3 T42 | CAM3 T85 |
| Reference Height Temperature | f.cam5_4_19.FAMPIC5.ne120_ne120.Club_001 | NCEP | CAM3 T42 | CAM3 T85 |
|---|