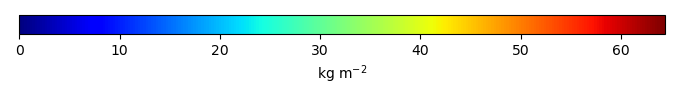
Mean State
Download Data |
Period Mean (original grids) [Pg] |
Model Period Mean (intersection) [Pg] |
Benchmark Period Mean (intersection) [Pg] |
Model Period Mean (complement) [Pg] |
Benchmark Period Mean (complement) [Pg] |
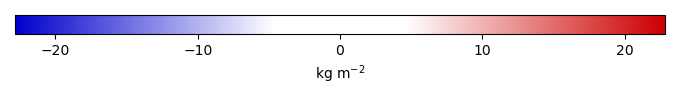
Bias [kg m-2] |
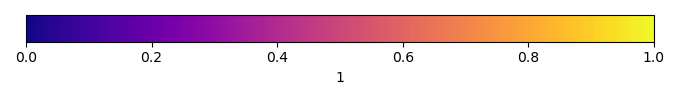
Bias Score [1] |
Spatial Distribution Score [1] |
Overall Score [1] |
|||
|---|---|---|---|---|---|---|---|---|---|---|---|---|
| Benchmark | [-] | 34.1 | ||||||||||
| Control | [-] | 35.5 | 35.9 | 33.8 | 0.278 | 0.315 | 0.901 | 0.659 | 0.913 | 0.786 | ||
| Randomized | [-] | 35.1 | 35.6 | 33.8 | 0.276 | 0.315 | 0.825 | 0.666 | 0.922 | 0.794 |
Download Data |
Period Mean (original grids) [Pg] |
Model Period Mean (intersection) [Pg] |
Benchmark Period Mean (intersection) [Pg] |
Model Period Mean (complement) [Pg] |
Benchmark Period Mean (complement) [Pg] |
Bias [kg m-2] |
Bias Score [1] |
Spatial Distribution Score [1] |
Overall Score [1] |
|||
|---|---|---|---|---|---|---|---|---|---|---|---|---|
| Benchmark | [-] | 44.8 | ||||||||||
| Control | [-] | 15.7 | 14.8 | 44.4 | 0.0226 | 0.478 | -4.30 | 0.510 | 0.809 | 0.660 | ||
| Randomized | [-] | 15.7 | 14.8 | 44.4 | 0.0228 | 0.478 | -4.29 | 0.510 | 0.809 | 0.660 |
Download Data |
Period Mean (original grids) [Pg] |
Model Period Mean (intersection) [Pg] |
Benchmark Period Mean (intersection) [Pg] |
Model Period Mean (complement) [Pg] |
Benchmark Period Mean (complement) [Pg] |
Bias [kg m-2] |
Bias Score [1] |
Spatial Distribution Score [1] |
Overall Score [1] |
|||
|---|---|---|---|---|---|---|---|---|---|---|---|---|
| Benchmark | [-] | 60.1 | ||||||||||
| Control | [-] | 27.9 | 27.1 | 59.3 | 0.664 | 0.762 | -3.06 | 0.581 | 0.868 | 0.725 | ||
| Randomized | [-] | 28.0 | 27.2 | 59.3 | 0.668 | 0.762 | -3.04 | 0.583 | 0.869 | 0.726 |
Download Data |
Period Mean (original grids) [Pg] |
Model Period Mean (intersection) [Pg] |
Benchmark Period Mean (intersection) [Pg] |
Model Period Mean (complement) [Pg] |
Benchmark Period Mean (complement) [Pg] |
Bias [kg m-2] |
Bias Score [1] |
Spatial Distribution Score [1] |
Overall Score [1] |
|||
|---|---|---|---|---|---|---|---|---|---|---|---|---|
| Benchmark | [-] | 11.1 | ||||||||||
| Control | [-] | 153. | 7.18 | 10.3 | 146. | 0.803 | 3.77 | 0.371 | 0.263 | 0.317 | ||
| Randomized | [-] | 153. | 7.17 | 10.3 | 146. | 0.803 | 3.75 | 0.371 | 0.264 | 0.318 |
Download Data |
Period Mean (original grids) [Pg] |
Model Period Mean (intersection) [Pg] |
Benchmark Period Mean (intersection) [Pg] |
Model Period Mean (complement) [Pg] |
Benchmark Period Mean (complement) [Pg] |
Bias [kg m-2] |
Bias Score [1] |
Spatial Distribution Score [1] |
Overall Score [1] |
|||
|---|---|---|---|---|---|---|---|---|---|---|---|---|
| Benchmark | [-] | 55.7 | ||||||||||
| Control | [-] | 25.6 | 24.0 | 50.7 | 1.45 | 4.99 | -4.49 | 0.744 | 0.291 | 0.517 | ||
| Randomized | [-] | 25.4 | 23.8 | 50.7 | 1.44 | 4.99 | -4.55 | 0.744 | 0.283 | 0.514 |
Download Data |
Period Mean (original grids) [Pg] |
Model Period Mean (intersection) [Pg] |
Benchmark Period Mean (intersection) [Pg] |
Model Period Mean (complement) [Pg] |
Benchmark Period Mean (complement) [Pg] |
Bias [kg m-2] |
Bias Score [1] |
Spatial Distribution Score [1] |
Overall Score [1] |
|||
|---|---|---|---|---|---|---|---|---|---|---|---|---|
| Benchmark | [-] | 65.6 | ||||||||||
| Control | [-] | 148. | 55.6 | 65.2 | 88.6 | 0.461 | -1.91 | 0.694 | 0.607 | 0.650 | ||
| Randomized | [-] | 148. | 55.7 | 65.2 | 88.6 | 0.461 | -1.89 | 0.694 | 0.606 | 0.650 |
Download Data |
Period Mean (original grids) [Pg] |
Model Period Mean (intersection) [Pg] |
Benchmark Period Mean (intersection) [Pg] |
Model Period Mean (complement) [Pg] |
Benchmark Period Mean (complement) [Pg] |
Bias [kg m-2] |
Bias Score [1] |
Spatial Distribution Score [1] |
Overall Score [1] |
|||
|---|---|---|---|---|---|---|---|---|---|---|---|---|
| Benchmark | [-] | 143. | ||||||||||
| Control | [-] | 119. | 110. | 142. | 11.6 | 0.973 | -1.52 | 0.660 | 0.910 | 0.785 | ||
| Randomized | [-] | 118. | 109. | 142. | 11.5 | 0.973 | -1.53 | 0.662 | 0.912 | 0.787 |
Download Data |
Period Mean (original grids) [Pg] |
Model Period Mean (intersection) [Pg] |
Benchmark Period Mean (intersection) [Pg] |
Model Period Mean (complement) [Pg] |
Benchmark Period Mean (complement) [Pg] |
Bias [kg m-2] |
Bias Score [1] |
Spatial Distribution Score [1] |
Overall Score [1] |
|||
|---|---|---|---|---|---|---|---|---|---|---|---|---|
| Benchmark | [-] | 58.4 | ||||||||||
| Control | [-] | 40.6 | 38.9 | 56.8 | 0.899 | 1.57 | -1.51 | 0.687 | 0.880 | 0.784 | ||
| Randomized | [-] | 40.6 | 38.9 | 56.8 | 0.899 | 1.57 | -1.51 | 0.687 | 0.880 | 0.784 |
Download Data |
Period Mean (original grids) [Pg] |
Model Period Mean (intersection) [Pg] |
Benchmark Period Mean (intersection) [Pg] |
Model Period Mean (complement) [Pg] |
Benchmark Period Mean (complement) [Pg] |
Bias [kg m-2] |
Bias Score [1] |
Spatial Distribution Score [1] |
Overall Score [1] |
|||
|---|---|---|---|---|---|---|---|---|---|---|---|---|
| Benchmark | [-] | 7.78 | ||||||||||
| Control | [-] | 124. | 6.49 | 7.36 | 119. | 0.414 | 3.05 | 0.381 | 0.238 | 0.310 | ||
| Randomized | [-] | 124. | 6.48 | 7.36 | 119. | 0.414 | 3.04 | 0.381 | 0.238 | 0.310 |
Download Data |
Period Mean (original grids) [Pg] |
Model Period Mean (intersection) [Pg] |
Benchmark Period Mean (intersection) [Pg] |
Model Period Mean (complement) [Pg] |
Benchmark Period Mean (complement) [Pg] |
Bias [kg m-2] |
Bias Score [1] |
Spatial Distribution Score [1] |
Overall Score [1] |
|||
|---|---|---|---|---|---|---|---|---|---|---|---|---|
| Benchmark | [-] | 58.9 | ||||||||||
| Control | [-] | 29.0 | 27.5 | 57.4 | 1.34 | 1.53 | -2.62 | 0.555 | 0.539 | 0.547 | ||
| Randomized | [-] | 29.0 | 27.5 | 57.4 | 1.35 | 1.53 | -2.62 | 0.554 | 0.537 | 0.545 |
Download Data |
Period Mean (original grids) [Pg] |
Model Period Mean (intersection) [Pg] |
Benchmark Period Mean (intersection) [Pg] |
Model Period Mean (complement) [Pg] |
Benchmark Period Mean (complement) [Pg] |
Bias [kg m-2] |
Bias Score [1] |
Spatial Distribution Score [1] |
Overall Score [1] |
|||
|---|---|---|---|---|---|---|---|---|---|---|---|---|
| Benchmark | [-] | 61.8 | ||||||||||
| Control | [-] | 48.3 | 44.5 | 60.2 | 3.19 | 1.58 | -1.22 | 0.722 | 0.646 | 0.684 | ||
| Randomized | [-] | 48.2 | 44.4 | 60.2 | 3.18 | 1.58 | -1.24 | 0.723 | 0.643 | 0.683 |
Download Data |
Period Mean (original grids) [Pg] |
Model Period Mean (intersection) [Pg] |
Benchmark Period Mean (intersection) [Pg] |
Model Period Mean (complement) [Pg] |
Benchmark Period Mean (complement) [Pg] |
Bias [kg m-2] |
Bias Score [1] |
Spatial Distribution Score [1] |
Overall Score [1] |
|||
|---|---|---|---|---|---|---|---|---|---|---|---|---|
| Benchmark | [-] | 1.05e+03 | ||||||||||
| Control | [-] | 1.23e+03 | 680. | 1.02e+03 | 553. | 23.7 | -2.18 | 0.622 | 0.803 | 0.713 | ||
| Randomized | [-] | 1.23e+03 | 679. | 1.02e+03 | 552. | 23.7 | -2.19 | 0.623 | 0.804 | 0.713 |
Download Data |
Period Mean (original grids) [Pg] |
Model Period Mean (intersection) [Pg] |
Benchmark Period Mean (intersection) [Pg] |
Model Period Mean (complement) [Pg] |
Benchmark Period Mean (complement) [Pg] |
Bias [kg m-2] |
Bias Score [1] |
Spatial Distribution Score [1] |
Overall Score [1] |
|||
|---|---|---|---|---|---|---|---|---|---|---|---|---|
| Benchmark | [-] | 64.3 | ||||||||||
| Control | [-] | 22.4 | 22.2 | 63.6 | 0.465 | 0.698 | -2.38 | 0.476 | 0.701 | 0.588 | ||
| Randomized | [-] | 22.4 | 22.2 | 63.6 | 0.463 | 0.698 | -2.38 | 0.476 | 0.700 | 0.588 |
Download Data |
Period Mean (original grids) [Pg] |
Model Period Mean (intersection) [Pg] |
Benchmark Period Mean (intersection) [Pg] |
Model Period Mean (complement) [Pg] |
Benchmark Period Mean (complement) [Pg] |
Bias [kg m-2] |
Bias Score [1] |
Spatial Distribution Score [1] |
Overall Score [1] |
|||
|---|---|---|---|---|---|---|---|---|---|---|---|---|
| Benchmark | [-] | 13.3 | ||||||||||
| Control | [-] | 130. | 8.34 | 12.1 | 122. | 1.24 | -0.610 | 0.456 | 0.452 | 0.454 | ||
| Randomized | [-] | 129. | 8.32 | 12.1 | 121. | 1.24 | -0.628 | 0.456 | 0.454 | 0.455 |
Download Data |
Period Mean (original grids) [Pg] |
Model Period Mean (intersection) [Pg] |
Benchmark Period Mean (intersection) [Pg] |
Model Period Mean (complement) [Pg] |
Benchmark Period Mean (complement) [Pg] |
Bias [kg m-2] |
Bias Score [1] |
Spatial Distribution Score [1] |
Overall Score [1] |
|||
|---|---|---|---|---|---|---|---|---|---|---|---|---|
| Benchmark | [-] | 42.5 | ||||||||||
| Control | [-] | 18.6 | 17.3 | 40.2 | 0.913 | 2.26 | -5.00 | 0.610 | 0.735 | 0.672 | ||
| Randomized | [-] | 18.6 | 17.3 | 40.2 | 0.912 | 2.26 | -5.01 | 0.610 | 0.733 | 0.672 |
Download Data |
Period Mean (original grids) [Pg] |
Model Period Mean (intersection) [Pg] |
Benchmark Period Mean (intersection) [Pg] |
Model Period Mean (complement) [Pg] |
Benchmark Period Mean (complement) [Pg] |
Bias [kg m-2] |
Bias Score [1] |
Spatial Distribution Score [1] |
Overall Score [1] |
|||
|---|---|---|---|---|---|---|---|---|---|---|---|---|
| Benchmark | [-] | 45.3 | ||||||||||
| Control | [-] | 38.3 | 37.2 | 44.4 | 0.387 | 0.888 | -1.22 | 0.775 | 0.744 | 0.760 | ||
| Randomized | [-] | 38.3 | 37.2 | 44.4 | 0.386 | 0.888 | -1.23 | 0.775 | 0.746 | 0.761 |
Download Data |
Period Mean (original grids) [Pg] |
Model Period Mean (intersection) [Pg] |
Benchmark Period Mean (intersection) [Pg] |
Model Period Mean (complement) [Pg] |
Benchmark Period Mean (complement) [Pg] |
Bias [kg m-2] |
Bias Score [1] |
Spatial Distribution Score [1] |
Overall Score [1] |
|||
|---|---|---|---|---|---|---|---|---|---|---|---|---|
| Benchmark | [-] | 51.3 | ||||||||||
| Control | [-] | 86.7 | 43.5 | 49.6 | 42.9 | 1.76 | -1.27 | 0.651 | 0.892 | 0.772 | ||
| Randomized | [-] | 86.6 | 43.4 | 49.6 | 42.9 | 1.76 | -1.30 | 0.651 | 0.891 | 0.771 |
Download Data |
Period Mean (original grids) [Pg] |
Model Period Mean (intersection) [Pg] |
Benchmark Period Mean (intersection) [Pg] |
Model Period Mean (complement) [Pg] |
Benchmark Period Mean (complement) [Pg] |
Bias [kg m-2] |
Bias Score [1] |
Spatial Distribution Score [1] |
Overall Score [1] |
|||
|---|---|---|---|---|---|---|---|---|---|---|---|---|
| Benchmark | [-] | 34.3 | ||||||||||
| Control | [-] | 15.0 | 15.5 | 34.0 | 0.267 | 0.216 | -4.50 | 0.609 | 0.903 | 0.756 | ||
| Randomized | [-] | 15.1 | 15.6 | 34.0 | 0.267 | 0.216 | -4.48 | 0.610 | 0.903 | 0.757 |
Download Data |
Period Mean (original grids) [Pg] |
Model Period Mean (intersection) [Pg] |
Benchmark Period Mean (intersection) [Pg] |
Model Period Mean (complement) [Pg] |
Benchmark Period Mean (complement) [Pg] |
Bias [kg m-2] |
Bias Score [1] |
Spatial Distribution Score [1] |
Overall Score [1] |
|||
|---|---|---|---|---|---|---|---|---|---|---|---|---|
| Benchmark | [-] | 101. | ||||||||||
| Control | [-] | 85.1 | 84.2 | 100. | 0.402 | 0.811 | -1.39 | 0.738 | 0.425 | 0.582 | ||
| Randomized | [-] | 84.7 | 83.8 | 100. | 0.401 | 0.811 | -1.43 | 0.741 | 0.413 | 0.577 |
Download Data |
Period Mean (original grids) [Pg] |
Model Period Mean (intersection) [Pg] |
Benchmark Period Mean (intersection) [Pg] |
Model Period Mean (complement) [Pg] |
Benchmark Period Mean (complement) [Pg] |
Bias [kg m-2] |
Bias Score [1] |
Spatial Distribution Score [1] |
Overall Score [1] |
|||
|---|---|---|---|---|---|---|---|---|---|---|---|---|
| Benchmark | [-] | 60.7 | ||||||||||
| Control | [-] | 41.7 | 42.2 | 60.4 | 0.485 | 0.300 | -2.21 | 0.692 | 0.768 | 0.730 | ||
| Randomized | [-] | 41.9 | 42.4 | 60.4 | 0.485 | 0.300 | -2.18 | 0.693 | 0.769 | 0.731 |
Download Data |
Period Mean (original grids) [Pg] |
Model Period Mean (intersection) [Pg] |
Benchmark Period Mean (intersection) [Pg] |
Model Period Mean (complement) [Pg] |
Benchmark Period Mean (complement) [Pg] |
Bias [kg m-2] |
Bias Score [1] |
Spatial Distribution Score [1] |
Overall Score [1] |
|||
|---|---|---|---|---|---|---|---|---|---|---|---|---|
| Benchmark | [-] | 29.6 | ||||||||||
| Control | [-] | 17.3 | 16.5 | 28.2 | 0.288 | 1.46 | -2.82 | 0.610 | 0.385 | 0.498 | ||
| Randomized | [-] | 17.3 | 16.5 | 28.2 | 0.288 | 1.46 | -2.83 | 0.609 | 0.385 | 0.497 |
Temporally integrated period mean