Mean State
Download Data |
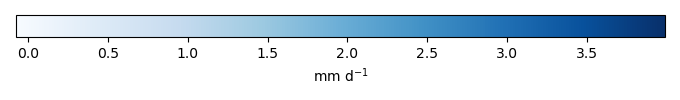
Period Mean (original grids) [mm d-1] |
Model Period Mean (intersection) [mm d-1] |
Benchmark Period Mean (intersection) [mm d-1] |
Model Period Mean (complement) [mm d-1] |
Benchmark Period Mean (complement) [mm d-1] |
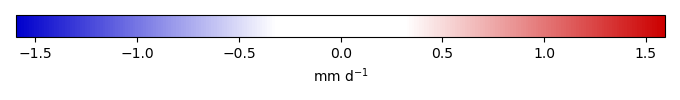
Bias [mm d-1] |
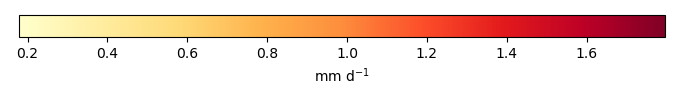
RMSE [mm d-1] |
Phase Shift [months] |
Bias Score [1] |
RMSE Score [1] |
Seasonal Cycle Score [1] |
Spatial Distribution Score [1] |
Overall Score [1] |
|||
|---|---|---|---|---|---|---|---|---|---|---|---|---|---|---|---|---|
| Benchmark | [-] | 2.48 | ||||||||||||||
| Control | [-] | 2.48 | 2.51 | 2.48 | 1.85 | 2.68 | 0.0240 | 0.725 | 2.67 | 0.571 | 0.603 | 0.569 | 0.985 | 0.666 | ||
| Randomized | [-] | 2.49 | 2.52 | 2.48 | 1.81 | 2.68 | 0.0320 | 0.713 | 2.63 | 0.580 | 0.603 | 0.577 | 0.986 | 0.670 |
Download Data |
Period Mean (original grids) [mm d-1] |
Model Period Mean (intersection) [mm d-1] |
Benchmark Period Mean (intersection) [mm d-1] |
Model Period Mean (complement) [mm d-1] |
Benchmark Period Mean (complement) [mm d-1] |
Bias [mm d-1] |
RMSE [mm d-1] |
Phase Shift [months] |
Bias Score [1] |
RMSE Score [1] |
Seasonal Cycle Score [1] |
Spatial Distribution Score [1] |
Overall Score [1] |
|||
|---|---|---|---|---|---|---|---|---|---|---|---|---|---|---|---|---|
| Benchmark | [-] | 1.21 | ||||||||||||||
| Control | [-] | 1.26 | 1.26 | 1.21 | 0.416 | 2.59 | 0.0483 | 0.858 | 1.08 | 0.438 | 0.540 | 0.866 | 0.900 | 0.657 | ||
| Randomized | [-] | 1.37 | 1.37 | 1.21 | 0.507 | 2.59 | 0.157 | 0.863 | 1.11 | 0.429 | 0.528 | 0.861 | 0.886 | 0.647 |
Download Data |
Period Mean (original grids) [mm d-1] |
Model Period Mean (intersection) [mm d-1] |
Benchmark Period Mean (intersection) [mm d-1] |
Model Period Mean (complement) [mm d-1] |
Benchmark Period Mean (complement) [mm d-1] |
Bias [mm d-1] |
RMSE [mm d-1] |
Phase Shift [months] |
Bias Score [1] |
RMSE Score [1] |
Seasonal Cycle Score [1] |
Spatial Distribution Score [1] |
Overall Score [1] |
|||
|---|---|---|---|---|---|---|---|---|---|---|---|---|---|---|---|---|
| Benchmark | [-] | 1.66 | ||||||||||||||
| Control | [-] | 1.55 | 1.53 | 1.66 | 1.87 | 2.05 | -0.113 | 0.745 | 1.63 | 0.611 | 0.539 | 0.774 | 0.961 | 0.685 | ||
| Randomized | [-] | 1.52 | 1.50 | 1.66 | 1.83 | 2.05 | -0.146 | 0.742 | 1.64 | 0.615 | 0.539 | 0.784 | 0.963 | 0.688 |
Download Data |
Period Mean (original grids) [mm d-1] |
Model Period Mean (intersection) [mm d-1] |
Benchmark Period Mean (intersection) [mm d-1] |
Model Period Mean (complement) [mm d-1] |
Benchmark Period Mean (complement) [mm d-1] |
Bias [mm d-1] |
RMSE [mm d-1] |
Phase Shift [months] |
Bias Score [1] |
RMSE Score [1] |
Seasonal Cycle Score [1] |
Spatial Distribution Score [1] |
Overall Score [1] |
|||
|---|---|---|---|---|---|---|---|---|---|---|---|---|---|---|---|---|
| Benchmark | [-] | 0.854 | ||||||||||||||
| Control | [-] | 0.281 | 0.295 | 0.854 | 0.0747 | 1.06 | -0.568 | 0.774 | 0.268 | 0.0217 | 0.0729 | 0.978 | 0.822 | 0.393 | ||
| Randomized | [-] | 0.340 | 0.356 | 0.854 | 0.0988 | 1.06 | -0.510 | 0.737 | 0.271 | 0.0578 | 0.0765 | 0.979 | 0.794 | 0.397 |
Download Data |
Period Mean (original grids) [mm d-1] |
Model Period Mean (intersection) [mm d-1] |
Benchmark Period Mean (intersection) [mm d-1] |
Model Period Mean (complement) [mm d-1] |
Benchmark Period Mean (complement) [mm d-1] |
Bias [mm d-1] |
RMSE [mm d-1] |
Phase Shift [months] |
Bias Score [1] |
RMSE Score [1] |
Seasonal Cycle Score [1] |
Spatial Distribution Score [1] |
Overall Score [1] |
|||
|---|---|---|---|---|---|---|---|---|---|---|---|---|---|---|---|---|
| Benchmark | [-] | 3.76 | ||||||||||||||
| Control | [-] | 3.02 | 2.93 | 3.76 | 3.46 | 3.92 | -0.712 | 0.921 | 3.12 | 0.320 | 0.730 | 0.485 | 0.331 | 0.519 | ||
| Randomized | [-] | 3.08 | 2.99 | 3.76 | 3.50 | 3.92 | -0.655 | 0.886 | 2.94 | 0.350 | 0.724 | 0.517 | 0.334 | 0.530 |
Download Data |
Period Mean (original grids) [mm d-1] |
Model Period Mean (intersection) [mm d-1] |
Benchmark Period Mean (intersection) [mm d-1] |
Model Period Mean (complement) [mm d-1] |
Benchmark Period Mean (complement) [mm d-1] |
Bias [mm d-1] |
RMSE [mm d-1] |
Phase Shift [months] |
Bias Score [1] |
RMSE Score [1] |
Seasonal Cycle Score [1] |
Spatial Distribution Score [1] |
Overall Score [1] |
|||
|---|---|---|---|---|---|---|---|---|---|---|---|---|---|---|---|---|
| Benchmark | [-] | 1.12 | ||||||||||||||
| Control | [-] | 0.628 | 0.625 | 1.11 | 0.648 | 1.40 | -0.489 | 0.612 | 0.264 | 0.0616 | 0.449 | 0.982 | 0.818 | 0.552 | ||
| Randomized | [-] | 0.636 | 0.633 | 1.11 | 0.644 | 1.40 | -0.481 | 0.615 | 0.217 | 0.0678 | 0.442 | 0.985 | 0.802 | 0.548 |
Download Data |
Period Mean (original grids) [mm d-1] |
Model Period Mean (intersection) [mm d-1] |
Benchmark Period Mean (intersection) [mm d-1] |
Model Period Mean (complement) [mm d-1] |
Benchmark Period Mean (complement) [mm d-1] |
Bias [mm d-1] |
RMSE [mm d-1] |
Phase Shift [months] |
Bias Score [1] |
RMSE Score [1] |
Seasonal Cycle Score [1] |
Spatial Distribution Score [1] |
Overall Score [1] |
|||
|---|---|---|---|---|---|---|---|---|---|---|---|---|---|---|---|---|
| Benchmark | [-] | 1.17 | ||||||||||||||
| Control | [-] | 0.920 | 0.978 | 1.17 | 0.644 | 1.94 | -0.179 | 0.765 | 1.51 | 0.509 | 0.290 | 0.779 | 0.887 | 0.551 | ||
| Randomized | [-] | 0.972 | 1.03 | 1.17 | 0.688 | 1.94 | -0.127 | 0.843 | 1.43 | 0.468 | 0.234 | 0.786 | 0.849 | 0.514 |
Download Data |
Period Mean (original grids) [mm d-1] |
Model Period Mean (intersection) [mm d-1] |
Benchmark Period Mean (intersection) [mm d-1] |
Model Period Mean (complement) [mm d-1] |
Benchmark Period Mean (complement) [mm d-1] |
Bias [mm d-1] |
RMSE [mm d-1] |
Phase Shift [months] |
Bias Score [1] |
RMSE Score [1] |
Seasonal Cycle Score [1] |
Spatial Distribution Score [1] |
Overall Score [1] |
|||
|---|---|---|---|---|---|---|---|---|---|---|---|---|---|---|---|---|
| Benchmark | [-] | 2.11 | ||||||||||||||
| Control | [-] | 1.98 | 2.04 | 2.10 | 1.56 | 3.39 | 0.0158 | 0.967 | 1.93 | 0.443 | 0.425 | 0.711 | 0.922 | 0.585 | ||
| Randomized | [-] | 2.03 | 2.08 | 2.10 | 1.58 | 3.39 | 0.0588 | 0.984 | 1.84 | 0.422 | 0.417 | 0.728 | 0.914 | 0.580 |
Download Data |
Period Mean (original grids) [mm d-1] |
Model Period Mean (intersection) [mm d-1] |
Benchmark Period Mean (intersection) [mm d-1] |
Model Period Mean (complement) [mm d-1] |
Benchmark Period Mean (complement) [mm d-1] |
Bias [mm d-1] |
RMSE [mm d-1] |
Phase Shift [months] |
Bias Score [1] |
RMSE Score [1] |
Seasonal Cycle Score [1] |
Spatial Distribution Score [1] |
Overall Score [1] |
|||
|---|---|---|---|---|---|---|---|---|---|---|---|---|---|---|---|---|
| Benchmark | [-] | 0.786 | ||||||||||||||
| Control | [-] | 0.145 | 0.173 | 0.786 | -0.0639 | 0.745 | -0.615 | 0.793 | 0.447 | 0.00147 | 0.0908 | 0.957 | 0.855 | 0.399 | ||
| Randomized | [-] | 0.147 | 0.174 | 0.786 | -0.0648 | 0.745 | -0.613 | 0.788 | 0.471 | 0.00323 | 0.101 | 0.954 | 0.846 | 0.401 |
Download Data |
Period Mean (original grids) [mm d-1] |
Model Period Mean (intersection) [mm d-1] |
Benchmark Period Mean (intersection) [mm d-1] |
Model Period Mean (complement) [mm d-1] |
Benchmark Period Mean (complement) [mm d-1] |
Bias [mm d-1] |
RMSE [mm d-1] |
Phase Shift [months] |
Bias Score [1] |
RMSE Score [1] |
Seasonal Cycle Score [1] |
Spatial Distribution Score [1] |
Overall Score [1] |
|||
|---|---|---|---|---|---|---|---|---|---|---|---|---|---|---|---|---|
| Benchmark | [-] | 0.785 | ||||||||||||||
| Control | [-] | 1.07 | 1.02 | 0.778 | 1.89 | 2.20 | 0.288 | 0.590 | 2.03 | 0.518 | 0.663 | 0.681 | 0.912 | 0.687 | ||
| Randomized | [-] | 1.06 | 1.02 | 0.778 | 1.90 | 2.20 | 0.287 | 0.595 | 2.09 | 0.521 | 0.654 | 0.668 | 0.894 | 0.678 |
Download Data |
Period Mean (original grids) [mm d-1] |
Model Period Mean (intersection) [mm d-1] |
Benchmark Period Mean (intersection) [mm d-1] |
Model Period Mean (complement) [mm d-1] |
Benchmark Period Mean (complement) [mm d-1] |
Bias [mm d-1] |
RMSE [mm d-1] |
Phase Shift [months] |
Bias Score [1] |
RMSE Score [1] |
Seasonal Cycle Score [1] |
Spatial Distribution Score [1] |
Overall Score [1] |
|||
|---|---|---|---|---|---|---|---|---|---|---|---|---|---|---|---|---|
| Benchmark | [-] | 1.32 | ||||||||||||||
| Control | [-] | 0.965 | 0.954 | 1.32 | 1.11 | 1.44 | -0.343 | 0.648 | 0.392 | 0.331 | 0.496 | 0.971 | 0.849 | 0.629 | ||
| Randomized | [-] | 0.962 | 0.952 | 1.32 | 1.11 | 1.44 | -0.346 | 0.662 | 0.461 | 0.321 | 0.490 | 0.966 | 0.846 | 0.623 |
Download Data |
Period Mean (original grids) [mm d-1] |
Model Period Mean (intersection) [mm d-1] |
Benchmark Period Mean (intersection) [mm d-1] |
Model Period Mean (complement) [mm d-1] |
Benchmark Period Mean (complement) [mm d-1] |
Bias [mm d-1] |
RMSE [mm d-1] |
Phase Shift [months] |
Bias Score [1] |
RMSE Score [1] |
Seasonal Cycle Score [1] |
Spatial Distribution Score [1] |
Overall Score [1] |
|||
|---|---|---|---|---|---|---|---|---|---|---|---|---|---|---|---|---|
| Benchmark | [-] | 1.56 | ||||||||||||||
| Control | [-] | 1.05 | 1.32 | 1.56 | 0.294 | 2.44 | -0.207 | 0.758 | 1.37 | 0.386 | 0.447 | 0.805 | 0.966 | 0.610 | ||
| Randomized | [-] | 1.08 | 1.36 | 1.56 | 0.310 | 2.44 | -0.174 | 0.778 | 1.38 | 0.377 | 0.427 | 0.802 | 0.965 | 0.600 |
Download Data |
Period Mean (original grids) [mm d-1] |
Model Period Mean (intersection) [mm d-1] |
Benchmark Period Mean (intersection) [mm d-1] |
Model Period Mean (complement) [mm d-1] |
Benchmark Period Mean (complement) [mm d-1] |
Bias [mm d-1] |
RMSE [mm d-1] |
Phase Shift [months] |
Bias Score [1] |
RMSE Score [1] |
Seasonal Cycle Score [1] |
Spatial Distribution Score [1] |
Overall Score [1] |
|||
|---|---|---|---|---|---|---|---|---|---|---|---|---|---|---|---|---|
| Benchmark | [-] | 0.604 | ||||||||||||||
| Control | [-] | 0.253 | 0.753 | 0.605 | 0.133 | 0.431 | 0.156 | 0.741 | 2.07 | 0.600 | 0.358 | 0.685 | 0.949 | 0.590 | ||
| Randomized | [-] | 0.289 | 0.822 | 0.605 | 0.160 | 0.431 | 0.222 | 0.826 | 2.15 | 0.545 | 0.308 | 0.669 | 0.945 | 0.555 |
Download Data |
Period Mean (original grids) [mm d-1] |
Model Period Mean (intersection) [mm d-1] |
Benchmark Period Mean (intersection) [mm d-1] |
Model Period Mean (complement) [mm d-1] |
Benchmark Period Mean (complement) [mm d-1] |
Bias [mm d-1] |
RMSE [mm d-1] |
Phase Shift [months] |
Bias Score [1] |
RMSE Score [1] |
Seasonal Cycle Score [1] |
Spatial Distribution Score [1] |
Overall Score [1] |
|||
|---|---|---|---|---|---|---|---|---|---|---|---|---|---|---|---|---|
| Benchmark | [-] | 0.875 | ||||||||||||||
| Control | [-] | 0.259 | 0.336 | 0.874 | 0.0687 | 1.05 | -0.544 | 0.742 | 0.529 | 0.0510 | 0.173 | 0.960 | 0.840 | 0.439 | ||
| Randomized | [-] | 0.277 | 0.355 | 0.874 | 0.0840 | 1.05 | -0.525 | 0.741 | 0.548 | 0.0662 | 0.156 | 0.959 | 0.835 | 0.434 |
Download Data |
Period Mean (original grids) [mm d-1] |
Model Period Mean (intersection) [mm d-1] |
Benchmark Period Mean (intersection) [mm d-1] |
Model Period Mean (complement) [mm d-1] |
Benchmark Period Mean (complement) [mm d-1] |
Bias [mm d-1] |
RMSE [mm d-1] |
Phase Shift [months] |
Bias Score [1] |
RMSE Score [1] |
Seasonal Cycle Score [1] |
Spatial Distribution Score [1] |
Overall Score [1] |
|||
|---|---|---|---|---|---|---|---|---|---|---|---|---|---|---|---|---|
| Benchmark | [-] | 2.13 | ||||||||||||||
| Control | [-] | 1.83 | 1.81 | 2.13 | 2.02 | 2.79 | -0.224 | 0.815 | 1.62 | 0.470 | 0.556 | 0.771 | 0.901 | 0.651 | ||
| Randomized | [-] | 1.88 | 1.85 | 2.13 | 2.09 | 2.79 | -0.177 | 0.841 | 1.65 | 0.455 | 0.541 | 0.768 | 0.893 | 0.640 |
Download Data |
Period Mean (original grids) [mm d-1] |
Model Period Mean (intersection) [mm d-1] |
Benchmark Period Mean (intersection) [mm d-1] |
Model Period Mean (complement) [mm d-1] |
Benchmark Period Mean (complement) [mm d-1] |
Bias [mm d-1] |
RMSE [mm d-1] |
Phase Shift [months] |
Bias Score [1] |
RMSE Score [1] |
Seasonal Cycle Score [1] |
Spatial Distribution Score [1] |
Overall Score [1] |
|||
|---|---|---|---|---|---|---|---|---|---|---|---|---|---|---|---|---|
| Benchmark | [-] | 1.88 | ||||||||||||||
| Control | [-] | 1.52 | 1.51 | 1.88 | 1.68 | 2.11 | -0.340 | 0.638 | 0.479 | 0.292 | 0.467 | 0.964 | 0.990 | 0.636 | ||
| Randomized | [-] | 1.55 | 1.55 | 1.88 | 1.71 | 2.11 | -0.301 | 0.646 | 0.464 | 0.318 | 0.439 | 0.965 | 0.991 | 0.631 |
Download Data |
Period Mean (original grids) [mm d-1] |
Model Period Mean (intersection) [mm d-1] |
Benchmark Period Mean (intersection) [mm d-1] |
Model Period Mean (complement) [mm d-1] |
Benchmark Period Mean (complement) [mm d-1] |
Bias [mm d-1] |
RMSE [mm d-1] |
Phase Shift [months] |
Bias Score [1] |
RMSE Score [1] |
Seasonal Cycle Score [1] |
Spatial Distribution Score [1] |
Overall Score [1] |
|||
|---|---|---|---|---|---|---|---|---|---|---|---|---|---|---|---|---|
| Benchmark | [-] | 1.13 | ||||||||||||||
| Control | [-] | 0.729 | 0.725 | 1.13 | 0.843 | 1.29 | -0.408 | 0.655 | 0.142 | 0.239 | 0.383 | 0.989 | 0.878 | 0.574 | ||
| Randomized | [-] | 0.744 | 0.740 | 1.13 | 0.848 | 1.29 | -0.394 | 0.661 | 0.0864 | 0.259 | 0.365 | 0.993 | 0.886 | 0.574 |
Download Data |
Period Mean (original grids) [mm d-1] |
Model Period Mean (intersection) [mm d-1] |
Benchmark Period Mean (intersection) [mm d-1] |
Model Period Mean (complement) [mm d-1] |
Benchmark Period Mean (complement) [mm d-1] |
Bias [mm d-1] |
RMSE [mm d-1] |
Phase Shift [months] |
Bias Score [1] |
RMSE Score [1] |
Seasonal Cycle Score [1] |
Spatial Distribution Score [1] |
Overall Score [1] |
|||
|---|---|---|---|---|---|---|---|---|---|---|---|---|---|---|---|---|
| Benchmark | [-] | 0.788 | ||||||||||||||
| Control | [-] | 0.847 | 0.860 | 0.787 | 0.793 | 1.93 | 0.0804 | 0.750 | 1.78 | 0.563 | 0.329 | 0.722 | 0.872 | 0.563 | ||
| Randomized | [-] | 0.907 | 0.920 | 0.787 | 0.855 | 1.93 | 0.140 | 0.825 | 1.90 | 0.509 | 0.280 | 0.697 | 0.891 | 0.531 |
Download Data |
Period Mean (original grids) [mm d-1] |
Model Period Mean (intersection) [mm d-1] |
Benchmark Period Mean (intersection) [mm d-1] |
Model Period Mean (complement) [mm d-1] |
Benchmark Period Mean (complement) [mm d-1] |
Bias [mm d-1] |
RMSE [mm d-1] |
Phase Shift [months] |
Bias Score [1] |
RMSE Score [1] |
Seasonal Cycle Score [1] |
Spatial Distribution Score [1] |
Overall Score [1] |
|||
|---|---|---|---|---|---|---|---|---|---|---|---|---|---|---|---|---|
| Benchmark | [-] | 3.62 | ||||||||||||||
| Control | [-] | 3.04 | 3.04 | 3.62 | 3.42 | 3.15 | -0.576 | 0.839 | 2.25 | 0.383 | 0.652 | 0.660 | 0.876 | 0.645 | ||
| Randomized | [-] | 3.08 | 3.07 | 3.62 | 3.43 | 3.15 | -0.540 | 0.832 | 2.53 | 0.403 | 0.633 | 0.608 | 0.895 | 0.634 |
Download Data |
Period Mean (original grids) [mm d-1] |
Model Period Mean (intersection) [mm d-1] |
Benchmark Period Mean (intersection) [mm d-1] |
Model Period Mean (complement) [mm d-1] |
Benchmark Period Mean (complement) [mm d-1] |
Bias [mm d-1] |
RMSE [mm d-1] |
Phase Shift [months] |
Bias Score [1] |
RMSE Score [1] |
Seasonal Cycle Score [1] |
Spatial Distribution Score [1] |
Overall Score [1] |
|||
|---|---|---|---|---|---|---|---|---|---|---|---|---|---|---|---|---|
| Benchmark | [-] | 1.97 | ||||||||||||||
| Control | [-] | 2.02 | 2.01 | 1.97 | 2.48 | 2.09 | 0.0498 | 0.888 | 1.22 | 0.440 | 0.484 | 0.855 | 0.907 | 0.634 | ||
| Randomized | [-] | 2.11 | 2.10 | 1.97 | 2.47 | 2.09 | 0.140 | 0.953 | 1.33 | 0.381 | 0.460 | 0.844 | 0.908 | 0.611 |
Download Data |
Period Mean (original grids) [mm d-1] |
Model Period Mean (intersection) [mm d-1] |
Benchmark Period Mean (intersection) [mm d-1] |
Model Period Mean (complement) [mm d-1] |
Benchmark Period Mean (complement) [mm d-1] |
Bias [mm d-1] |
RMSE [mm d-1] |
Phase Shift [months] |
Bias Score [1] |
RMSE Score [1] |
Seasonal Cycle Score [1] |
Spatial Distribution Score [1] |
Overall Score [1] |
|||
|---|---|---|---|---|---|---|---|---|---|---|---|---|---|---|---|---|
| Benchmark | [-] | 1.18 | ||||||||||||||
| Control | [-] | 0.823 | 0.904 | 1.17 | 0.465 | 1.34 | -0.282 | 0.820 | 2.00 | 0.397 | 0.457 | 0.693 | 0.818 | 0.564 | ||
| Randomized | [-] | 0.879 | 0.964 | 1.17 | 0.488 | 1.34 | -0.227 | 0.862 | 1.93 | 0.347 | 0.433 | 0.706 | 0.824 | 0.549 |
Temporally integrated period mean