Mean State
Download Data |
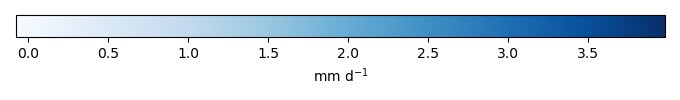
Period Mean (original grids) [mm d-1] |
Model Period Mean (intersection) [mm d-1] |
Benchmark Period Mean (intersection) [mm d-1] |
Model Period Mean (complement) [mm d-1] |
Benchmark Period Mean (complement) [mm d-1] |
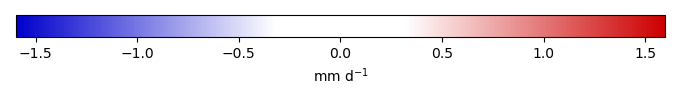
Bias [mm d-1] |
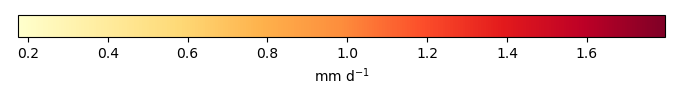
RMSE [mm d-1] |
Phase Shift [months] |
Bias Score [1] |
RMSE Score [1] |
Seasonal Cycle Score [1] |
Spatial Distribution Score [1] |
Overall Score [1] |
|||
|---|---|---|---|---|---|---|---|---|---|---|---|---|---|---|---|---|
| Benchmark | [-] | 2.49 | ||||||||||||||
| Control | [-] | 2.46 | 2.49 | 2.49 | 1.84 | 2.68 | -0.00751 | 0.715 | 2.64 | 0.584 | 0.606 | 0.570 | 0.985 | 0.670 | ||
| Randomized | [-] | 2.49 | 2.52 | 2.49 | 1.81 | 2.68 | 0.0231 | 0.707 | 2.55 | 0.586 | 0.604 | 0.591 | 0.986 | 0.674 |
Download Data |
Period Mean (original grids) [mm d-1] |
Model Period Mean (intersection) [mm d-1] |
Benchmark Period Mean (intersection) [mm d-1] |
Model Period Mean (complement) [mm d-1] |
Benchmark Period Mean (complement) [mm d-1] |
Bias [mm d-1] |
RMSE [mm d-1] |
Phase Shift [months] |
Bias Score [1] |
RMSE Score [1] |
Seasonal Cycle Score [1] |
Spatial Distribution Score [1] |
Overall Score [1] |
|||
|---|---|---|---|---|---|---|---|---|---|---|---|---|---|---|---|---|
| Benchmark | [-] | 1.21 | ||||||||||||||
| Control | [-] | 1.24 | 1.24 | 1.20 | 0.414 | 2.59 | 0.0334 | 0.861 | 1.11 | 0.438 | 0.537 | 0.864 | 0.897 | 0.655 | ||
| Randomized | [-] | 1.36 | 1.36 | 1.20 | 0.504 | 2.59 | 0.153 | 0.864 | 1.12 | 0.429 | 0.528 | 0.861 | 0.887 | 0.647 |
Download Data |
Period Mean (original grids) [mm d-1] |
Model Period Mean (intersection) [mm d-1] |
Benchmark Period Mean (intersection) [mm d-1] |
Model Period Mean (complement) [mm d-1] |
Benchmark Period Mean (complement) [mm d-1] |
Bias [mm d-1] |
RMSE [mm d-1] |
Phase Shift [months] |
Bias Score [1] |
RMSE Score [1] |
Seasonal Cycle Score [1] |
Spatial Distribution Score [1] |
Overall Score [1] |
|||
|---|---|---|---|---|---|---|---|---|---|---|---|---|---|---|---|---|
| Benchmark | [-] | 1.67 | ||||||||||||||
| Control | [-] | 1.54 | 1.52 | 1.67 | 1.86 | 2.05 | -0.136 | 0.739 | 1.64 | 0.612 | 0.543 | 0.773 | 0.961 | 0.687 | ||
| Randomized | [-] | 1.52 | 1.50 | 1.67 | 1.83 | 2.05 | -0.153 | 0.739 | 1.64 | 0.614 | 0.542 | 0.784 | 0.961 | 0.689 |
Download Data |
Period Mean (original grids) [mm d-1] |
Model Period Mean (intersection) [mm d-1] |
Benchmark Period Mean (intersection) [mm d-1] |
Model Period Mean (complement) [mm d-1] |
Benchmark Period Mean (complement) [mm d-1] |
Bias [mm d-1] |
RMSE [mm d-1] |
Phase Shift [months] |
Bias Score [1] |
RMSE Score [1] |
Seasonal Cycle Score [1] |
Spatial Distribution Score [1] |
Overall Score [1] |
|||
|---|---|---|---|---|---|---|---|---|---|---|---|---|---|---|---|---|
| Benchmark | [-] | 0.851 | ||||||||||||||
| Control | [-] | 0.280 | 0.293 | 0.851 | 0.0755 | 1.06 | -0.567 | 0.772 | 0.258 | 0.0207 | 0.0723 | 0.979 | 0.827 | 0.394 | ||
| Randomized | [-] | 0.340 | 0.355 | 0.851 | 0.0991 | 1.06 | -0.507 | 0.731 | 0.270 | 0.0582 | 0.0828 | 0.979 | 0.800 | 0.400 |
Download Data |
Period Mean (original grids) [mm d-1] |
Model Period Mean (intersection) [mm d-1] |
Benchmark Period Mean (intersection) [mm d-1] |
Model Period Mean (complement) [mm d-1] |
Benchmark Period Mean (complement) [mm d-1] |
Bias [mm d-1] |
RMSE [mm d-1] |
Phase Shift [months] |
Bias Score [1] |
RMSE Score [1] |
Seasonal Cycle Score [1] |
Spatial Distribution Score [1] |
Overall Score [1] |
|||
|---|---|---|---|---|---|---|---|---|---|---|---|---|---|---|---|---|
| Benchmark | [-] | 3.76 | ||||||||||||||
| Control | [-] | 3.02 | 2.92 | 3.75 | 3.45 | 3.91 | -0.717 | 0.924 | 3.17 | 0.318 | 0.729 | 0.473 | 0.335 | 0.516 | ||
| Randomized | [-] | 3.08 | 2.99 | 3.75 | 3.50 | 3.91 | -0.648 | 0.883 | 3.04 | 0.352 | 0.722 | 0.497 | 0.334 | 0.526 |
Download Data |
Period Mean (original grids) [mm d-1] |
Model Period Mean (intersection) [mm d-1] |
Benchmark Period Mean (intersection) [mm d-1] |
Model Period Mean (complement) [mm d-1] |
Benchmark Period Mean (complement) [mm d-1] |
Bias [mm d-1] |
RMSE [mm d-1] |
Phase Shift [months] |
Bias Score [1] |
RMSE Score [1] |
Seasonal Cycle Score [1] |
Spatial Distribution Score [1] |
Overall Score [1] |
|||
|---|---|---|---|---|---|---|---|---|---|---|---|---|---|---|---|---|
| Benchmark | [-] | 1.12 | ||||||||||||||
| Control | [-] | 0.624 | 0.621 | 1.12 | 0.643 | 1.40 | -0.495 | 0.617 | 0.266 | 0.0583 | 0.444 | 0.982 | 0.820 | 0.550 | ||
| Randomized | [-] | 0.636 | 0.633 | 1.12 | 0.641 | 1.40 | -0.483 | 0.616 | 0.218 | 0.0658 | 0.442 | 0.985 | 0.805 | 0.548 |
Download Data |
Period Mean (original grids) [mm d-1] |
Model Period Mean (intersection) [mm d-1] |
Benchmark Period Mean (intersection) [mm d-1] |
Model Period Mean (complement) [mm d-1] |
Benchmark Period Mean (complement) [mm d-1] |
Bias [mm d-1] |
RMSE [mm d-1] |
Phase Shift [months] |
Bias Score [1] |
RMSE Score [1] |
Seasonal Cycle Score [1] |
Spatial Distribution Score [1] |
Overall Score [1] |
|||
|---|---|---|---|---|---|---|---|---|---|---|---|---|---|---|---|---|
| Benchmark | [-] | 1.17 | ||||||||||||||
| Control | [-] | 0.916 | 0.973 | 1.17 | 0.641 | 1.94 | -0.184 | 0.762 | 1.50 | 0.509 | 0.294 | 0.781 | 0.890 | 0.554 | ||
| Randomized | [-] | 0.972 | 1.03 | 1.17 | 0.689 | 1.94 | -0.128 | 0.843 | 1.42 | 0.468 | 0.235 | 0.788 | 0.848 | 0.515 |
Download Data |
Period Mean (original grids) [mm d-1] |
Model Period Mean (intersection) [mm d-1] |
Benchmark Period Mean (intersection) [mm d-1] |
Model Period Mean (complement) [mm d-1] |
Benchmark Period Mean (complement) [mm d-1] |
Bias [mm d-1] |
RMSE [mm d-1] |
Phase Shift [months] |
Bias Score [1] |
RMSE Score [1] |
Seasonal Cycle Score [1] |
Spatial Distribution Score [1] |
Overall Score [1] |
|||
|---|---|---|---|---|---|---|---|---|---|---|---|---|---|---|---|---|
| Benchmark | [-] | 2.11 | ||||||||||||||
| Control | [-] | 1.98 | 2.04 | 2.11 | 1.55 | 3.39 | 0.0116 | 0.965 | 1.91 | 0.443 | 0.429 | 0.715 | 0.923 | 0.588 | ||
| Randomized | [-] | 2.03 | 2.08 | 2.11 | 1.58 | 3.39 | 0.0558 | 0.982 | 1.83 | 0.425 | 0.418 | 0.730 | 0.917 | 0.581 |
Download Data |
Period Mean (original grids) [mm d-1] |
Model Period Mean (intersection) [mm d-1] |
Benchmark Period Mean (intersection) [mm d-1] |
Model Period Mean (complement) [mm d-1] |
Benchmark Period Mean (complement) [mm d-1] |
Bias [mm d-1] |
RMSE [mm d-1] |
Phase Shift [months] |
Bias Score [1] |
RMSE Score [1] |
Seasonal Cycle Score [1] |
Spatial Distribution Score [1] |
Overall Score [1] |
|||
|---|---|---|---|---|---|---|---|---|---|---|---|---|---|---|---|---|
| Benchmark | [-] | 0.785 | ||||||||||||||
| Control | [-] | 0.146 | 0.173 | 0.785 | -0.0630 | 0.741 | -0.613 | 0.789 | 0.447 | 0.00147 | 0.0936 | 0.956 | 0.864 | 0.402 | ||
| Randomized | [-] | 0.153 | 0.181 | 0.785 | -0.0624 | 0.741 | -0.605 | 0.779 | 0.443 | 0.00368 | 0.105 | 0.958 | 0.856 | 0.406 |
Download Data |
Period Mean (original grids) [mm d-1] |
Model Period Mean (intersection) [mm d-1] |
Benchmark Period Mean (intersection) [mm d-1] |
Model Period Mean (complement) [mm d-1] |
Benchmark Period Mean (complement) [mm d-1] |
Bias [mm d-1] |
RMSE [mm d-1] |
Phase Shift [months] |
Bias Score [1] |
RMSE Score [1] |
Seasonal Cycle Score [1] |
Spatial Distribution Score [1] |
Overall Score [1] |
|||
|---|---|---|---|---|---|---|---|---|---|---|---|---|---|---|---|---|
| Benchmark | [-] | 0.787 | ||||||||||||||
| Control | [-] | 1.06 | 1.02 | 0.779 | 1.88 | 2.20 | 0.284 | 0.588 | 2.06 | 0.521 | 0.663 | 0.679 | 0.911 | 0.687 | ||
| Randomized | [-] | 1.07 | 1.02 | 0.779 | 1.90 | 2.20 | 0.286 | 0.595 | 2.14 | 0.522 | 0.652 | 0.664 | 0.897 | 0.677 |
Download Data |
Period Mean (original grids) [mm d-1] |
Model Period Mean (intersection) [mm d-1] |
Benchmark Period Mean (intersection) [mm d-1] |
Model Period Mean (complement) [mm d-1] |
Benchmark Period Mean (complement) [mm d-1] |
Bias [mm d-1] |
RMSE [mm d-1] |
Phase Shift [months] |
Bias Score [1] |
RMSE Score [1] |
Seasonal Cycle Score [1] |
Spatial Distribution Score [1] |
Overall Score [1] |
|||
|---|---|---|---|---|---|---|---|---|---|---|---|---|---|---|---|---|
| Benchmark | [-] | 1.32 | ||||||||||||||
| Control | [-] | 0.958 | 0.947 | 1.31 | 1.10 | 1.43 | -0.347 | 0.649 | 0.400 | 0.327 | 0.496 | 0.971 | 0.850 | 0.628 | ||
| Randomized | [-] | 0.960 | 0.950 | 1.31 | 1.11 | 1.43 | -0.345 | 0.661 | 0.464 | 0.322 | 0.492 | 0.966 | 0.842 | 0.623 |
Download Data |
Period Mean (original grids) [mm d-1] |
Model Period Mean (intersection) [mm d-1] |
Benchmark Period Mean (intersection) [mm d-1] |
Model Period Mean (complement) [mm d-1] |
Benchmark Period Mean (complement) [mm d-1] |
Bias [mm d-1] |
RMSE [mm d-1] |
Phase Shift [months] |
Bias Score [1] |
RMSE Score [1] |
Seasonal Cycle Score [1] |
Spatial Distribution Score [1] |
Overall Score [1] |
|||
|---|---|---|---|---|---|---|---|---|---|---|---|---|---|---|---|---|
| Benchmark | [-] | 1.56 | ||||||||||||||
| Control | [-] | 1.04 | 1.31 | 1.56 | 0.292 | 2.43 | -0.215 | 0.757 | 1.37 | 0.387 | 0.448 | 0.804 | 0.965 | 0.610 | ||
| Randomized | [-] | 1.08 | 1.36 | 1.56 | 0.310 | 2.43 | -0.173 | 0.777 | 1.39 | 0.378 | 0.428 | 0.802 | 0.965 | 0.600 |
Download Data |
Period Mean (original grids) [mm d-1] |
Model Period Mean (intersection) [mm d-1] |
Benchmark Period Mean (intersection) [mm d-1] |
Model Period Mean (complement) [mm d-1] |
Benchmark Period Mean (complement) [mm d-1] |
Bias [mm d-1] |
RMSE [mm d-1] |
Phase Shift [months] |
Bias Score [1] |
RMSE Score [1] |
Seasonal Cycle Score [1] |
Spatial Distribution Score [1] |
Overall Score [1] |
|||
|---|---|---|---|---|---|---|---|---|---|---|---|---|---|---|---|---|
| Benchmark | [-] | 0.603 | ||||||||||||||
| Control | [-] | 0.249 | 0.745 | 0.603 | 0.130 | 0.429 | 0.150 | 0.735 | 2.06 | 0.605 | 0.362 | 0.688 | 0.948 | 0.593 | ||
| Randomized | [-] | 0.288 | 0.819 | 0.603 | 0.159 | 0.429 | 0.221 | 0.822 | 2.16 | 0.547 | 0.310 | 0.668 | 0.944 | 0.556 |
Download Data |
Period Mean (original grids) [mm d-1] |
Model Period Mean (intersection) [mm d-1] |
Benchmark Period Mean (intersection) [mm d-1] |
Model Period Mean (complement) [mm d-1] |
Benchmark Period Mean (complement) [mm d-1] |
Bias [mm d-1] |
RMSE [mm d-1] |
Phase Shift [months] |
Bias Score [1] |
RMSE Score [1] |
Seasonal Cycle Score [1] |
Spatial Distribution Score [1] |
Overall Score [1] |
|||
|---|---|---|---|---|---|---|---|---|---|---|---|---|---|---|---|---|
| Benchmark | [-] | 0.876 | ||||||||||||||
| Control | [-] | 0.256 | 0.332 | 0.875 | 0.0674 | 1.04 | -0.549 | 0.746 | 0.540 | 0.0487 | 0.170 | 0.960 | 0.836 | 0.437 | ||
| Randomized | [-] | 0.280 | 0.360 | 0.875 | 0.0844 | 1.04 | -0.521 | 0.741 | 0.542 | 0.0690 | 0.154 | 0.960 | 0.835 | 0.434 |
Download Data |
Period Mean (original grids) [mm d-1] |
Model Period Mean (intersection) [mm d-1] |
Benchmark Period Mean (intersection) [mm d-1] |
Model Period Mean (complement) [mm d-1] |
Benchmark Period Mean (complement) [mm d-1] |
Bias [mm d-1] |
RMSE [mm d-1] |
Phase Shift [months] |
Bias Score [1] |
RMSE Score [1] |
Seasonal Cycle Score [1] |
Spatial Distribution Score [1] |
Overall Score [1] |
|||
|---|---|---|---|---|---|---|---|---|---|---|---|---|---|---|---|---|
| Benchmark | [-] | 2.12 | ||||||||||||||
| Control | [-] | 1.82 | 1.79 | 2.12 | 2.01 | 2.78 | -0.230 | 0.811 | 1.62 | 0.473 | 0.558 | 0.772 | 0.904 | 0.653 | ||
| Randomized | [-] | 1.87 | 1.85 | 2.12 | 2.09 | 2.78 | -0.173 | 0.843 | 1.69 | 0.454 | 0.540 | 0.761 | 0.893 | 0.638 |
Download Data |
Period Mean (original grids) [mm d-1] |
Model Period Mean (intersection) [mm d-1] |
Benchmark Period Mean (intersection) [mm d-1] |
Model Period Mean (complement) [mm d-1] |
Benchmark Period Mean (complement) [mm d-1] |
Bias [mm d-1] |
RMSE [mm d-1] |
Phase Shift [months] |
Bias Score [1] |
RMSE Score [1] |
Seasonal Cycle Score [1] |
Spatial Distribution Score [1] |
Overall Score [1] |
|||
|---|---|---|---|---|---|---|---|---|---|---|---|---|---|---|---|---|
| Benchmark | [-] | 1.88 | ||||||||||||||
| Control | [-] | 1.52 | 1.51 | 1.88 | 1.68 | 2.11 | -0.342 | 0.640 | 0.475 | 0.293 | 0.464 | 0.964 | 0.989 | 0.635 | ||
| Randomized | [-] | 1.55 | 1.55 | 1.88 | 1.71 | 2.11 | -0.303 | 0.649 | 0.482 | 0.320 | 0.435 | 0.963 | 0.992 | 0.629 |
Download Data |
Period Mean (original grids) [mm d-1] |
Model Period Mean (intersection) [mm d-1] |
Benchmark Period Mean (intersection) [mm d-1] |
Model Period Mean (complement) [mm d-1] |
Benchmark Period Mean (complement) [mm d-1] |
Bias [mm d-1] |
RMSE [mm d-1] |
Phase Shift [months] |
Bias Score [1] |
RMSE Score [1] |
Seasonal Cycle Score [1] |
Spatial Distribution Score [1] |
Overall Score [1] |
|||
|---|---|---|---|---|---|---|---|---|---|---|---|---|---|---|---|---|
| Benchmark | [-] | 1.14 | ||||||||||||||
| Control | [-] | 0.731 | 0.726 | 1.14 | 0.847 | 1.29 | -0.408 | 0.655 | 0.142 | 0.238 | 0.383 | 0.989 | 0.871 | 0.573 | ||
| Randomized | [-] | 0.745 | 0.741 | 1.14 | 0.848 | 1.29 | -0.394 | 0.662 | 0.0813 | 0.259 | 0.364 | 0.993 | 0.884 | 0.573 |
Download Data |
Period Mean (original grids) [mm d-1] |
Model Period Mean (intersection) [mm d-1] |
Benchmark Period Mean (intersection) [mm d-1] |
Model Period Mean (complement) [mm d-1] |
Benchmark Period Mean (complement) [mm d-1] |
Bias [mm d-1] |
RMSE [mm d-1] |
Phase Shift [months] |
Bias Score [1] |
RMSE Score [1] |
Seasonal Cycle Score [1] |
Spatial Distribution Score [1] |
Overall Score [1] |
|||
|---|---|---|---|---|---|---|---|---|---|---|---|---|---|---|---|---|
| Benchmark | [-] | 0.787 | ||||||||||||||
| Control | [-] | 0.838 | 0.851 | 0.786 | 0.792 | 1.92 | 0.0715 | 0.745 | 1.78 | 0.572 | 0.331 | 0.722 | 0.874 | 0.566 | ||
| Randomized | [-] | 0.906 | 0.918 | 0.786 | 0.861 | 1.92 | 0.140 | 0.824 | 1.90 | 0.510 | 0.282 | 0.698 | 0.887 | 0.532 |
Download Data |
Period Mean (original grids) [mm d-1] |
Model Period Mean (intersection) [mm d-1] |
Benchmark Period Mean (intersection) [mm d-1] |
Model Period Mean (complement) [mm d-1] |
Benchmark Period Mean (complement) [mm d-1] |
Bias [mm d-1] |
RMSE [mm d-1] |
Phase Shift [months] |
Bias Score [1] |
RMSE Score [1] |
Seasonal Cycle Score [1] |
Spatial Distribution Score [1] |
Overall Score [1] |
|||
|---|---|---|---|---|---|---|---|---|---|---|---|---|---|---|---|---|
| Benchmark | [-] | 3.61 | ||||||||||||||
| Control | [-] | 3.03 | 3.02 | 3.61 | 3.41 | 3.16 | -0.582 | 0.844 | 2.26 | 0.378 | 0.650 | 0.657 | 0.880 | 0.643 | ||
| Randomized | [-] | 3.08 | 3.07 | 3.61 | 3.43 | 3.16 | -0.531 | 0.829 | 2.51 | 0.408 | 0.631 | 0.611 | 0.898 | 0.636 |
Download Data |
Period Mean (original grids) [mm d-1] |
Model Period Mean (intersection) [mm d-1] |
Benchmark Period Mean (intersection) [mm d-1] |
Model Period Mean (complement) [mm d-1] |
Benchmark Period Mean (complement) [mm d-1] |
Bias [mm d-1] |
RMSE [mm d-1] |
Phase Shift [months] |
Bias Score [1] |
RMSE Score [1] |
Seasonal Cycle Score [1] |
Spatial Distribution Score [1] |
Overall Score [1] |
|||
|---|---|---|---|---|---|---|---|---|---|---|---|---|---|---|---|---|
| Benchmark | [-] | 1.96 | ||||||||||||||
| Control | [-] | 2.00 | 1.99 | 1.96 | 2.48 | 2.09 | 0.0415 | 0.882 | 1.25 | 0.441 | 0.489 | 0.851 | 0.902 | 0.635 | ||
| Randomized | [-] | 2.11 | 2.10 | 1.96 | 2.47 | 2.09 | 0.152 | 0.958 | 1.36 | 0.375 | 0.460 | 0.841 | 0.907 | 0.609 |
Download Data |
Period Mean (original grids) [mm d-1] |
Model Period Mean (intersection) [mm d-1] |
Benchmark Period Mean (intersection) [mm d-1] |
Model Period Mean (complement) [mm d-1] |
Benchmark Period Mean (complement) [mm d-1] |
Bias [mm d-1] |
RMSE [mm d-1] |
Phase Shift [months] |
Bias Score [1] |
RMSE Score [1] |
Seasonal Cycle Score [1] |
Spatial Distribution Score [1] |
Overall Score [1] |
|||
|---|---|---|---|---|---|---|---|---|---|---|---|---|---|---|---|---|
| Benchmark | [-] | 1.17 | ||||||||||||||
| Control | [-] | 0.822 | 0.904 | 1.17 | 0.463 | 1.34 | -0.279 | 0.820 | 2.03 | 0.399 | 0.455 | 0.685 | 0.819 | 0.562 | ||
| Randomized | [-] | 0.880 | 0.964 | 1.17 | 0.488 | 1.34 | -0.223 | 0.860 | 1.96 | 0.349 | 0.435 | 0.699 | 0.825 | 0.549 |
Temporally integrated period mean