Mean State
Download Data |
Period Mean (original grids) [Pg] |
Model Period Mean (intersection) [Pg] |
Benchmark Period Mean (intersection) [Pg] |
Model Period Mean (complement) [Pg] |
Benchmark Period Mean (complement) [Pg] |
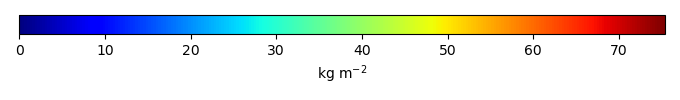
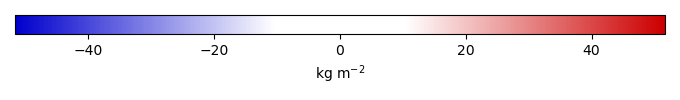
Bias [kg m-2] |
Bias Score [1] |
Spatial Distribution Score [1] |
Overall Score [1] |
|||
|---|---|---|---|---|---|---|---|---|---|---|---|---|
| Benchmark | [-] | 76.5 | ||||||||||
| CLM5_GSWP3V1 | [-] | 69.5 | 61.3 | 76.1 | 8.09 | 0.362 | -4.25 | 0.527 | 0.507 | 0.517 | ||
| Control | [-] | 153. | 145. | 76.1 | 8.29 | 0.362 | 25.9 | 0.363 | 0.217 | 0.290 | ||
| Randomized | [-] | 153. | 145. | 76.1 | 8.29 | 0.362 | 25.9 | 0.363 | 0.217 | 0.290 |
Download Data |
Period Mean (original grids) [Pg] |
Model Period Mean (intersection) [Pg] |
Benchmark Period Mean (intersection) [Pg] |
Model Period Mean (complement) [Pg] |
Benchmark Period Mean (complement) [Pg] |
Bias [kg m-2] |
Bias Score [1] |
Spatial Distribution Score [1] |
Overall Score [1] |
|||
|---|---|---|---|---|---|---|---|---|---|---|---|---|
| Benchmark | [-] | 113. | ||||||||||
| CLM5_GSWP3V1 | [-] | 139. | 76.1 | 113. | 59.9 | 0.00185 | -7.87 | 0.530 | 0.832 | 0.681 | ||
| Control | [-] | 148. | 88.1 | 113. | 56.1 | 0.00185 | -5.17 | 0.636 | 0.722 | 0.679 | ||
| Randomized | [-] | 148. | 88.1 | 113. | 56.2 | 0.00185 | -5.16 | 0.637 | 0.721 | 0.679 |
Download Data |
Period Mean (original grids) [Pg] |
Model Period Mean (intersection) [Pg] |
Benchmark Period Mean (intersection) [Pg] |
Model Period Mean (complement) [Pg] |
Benchmark Period Mean (complement) [Pg] |
Bias [kg m-2] |
Bias Score [1] |
Spatial Distribution Score [1] |
Overall Score [1] |
|||
|---|---|---|---|---|---|---|---|---|---|---|---|---|
| Benchmark | [-] | 12.2 | ||||||||||
| CLM5_GSWP3V1 | [-] | 119. | 6.40 | 12.2 | 116. | -5.84 | 0.567 | 0.863 | 0.715 | |||
| Control | [-] | 119. | 10.8 | 12.2 | 110. | -1.59 | 0.723 | 0.811 | 0.767 | |||
| Randomized | [-] | 118. | 10.7 | 12.2 | 110. | -1.73 | 0.723 | 0.806 | 0.764 |
Download Data |
Period Mean (original grids) [Pg] |
Model Period Mean (intersection) [Pg] |
Benchmark Period Mean (intersection) [Pg] |
Model Period Mean (complement) [Pg] |
Benchmark Period Mean (complement) [Pg] |
Bias [kg m-2] |
Bias Score [1] |
Spatial Distribution Score [1] |
Overall Score [1] |
|||
|---|---|---|---|---|---|---|---|---|---|---|---|---|
| Benchmark | [-] | 97.3 | ||||||||||
| CLM5_GSWP3V1 | [-] | 92.1 | 85.0 | 97.2 | 8.38 | 0.0996 | -3.55 | 0.558 | 0.593 | 0.576 | ||
| Control | [-] | 124. | 118. | 97.2 | 7.02 | 0.0996 | 7.14 | 0.505 | 0.377 | 0.441 | ||
| Randomized | [-] | 124. | 118. | 97.2 | 7.01 | 0.0996 | 7.14 | 0.505 | 0.378 | 0.441 |
Download Data |
Period Mean (original grids) [Pg] |
Model Period Mean (intersection) [Pg] |
Benchmark Period Mean (intersection) [Pg] |
Model Period Mean (complement) [Pg] |
Benchmark Period Mean (complement) [Pg] |
Bias [kg m-2] |
Bias Score [1] |
Spatial Distribution Score [1] |
Overall Score [1] |
|||
|---|---|---|---|---|---|---|---|---|---|---|---|---|
| Benchmark | [-] | 5.12 | ||||||||||
| CLM5_GSWP3V1 | [-] | 45.9 | 2.88 | 5.12 | 42.4 | -8.41 | 0.535 | 0.585 | 0.560 | |||
| Control | [-] | 48.3 | 2.24 | 5.12 | 45.4 | -10.8 | 0.539 | 0.410 | 0.474 | |||
| Randomized | [-] | 48.2 | 2.24 | 5.12 | 45.3 | -10.8 | 0.539 | 0.408 | 0.473 |
Download Data |
Period Mean (original grids) [Pg] |
Model Period Mean (intersection) [Pg] |
Benchmark Period Mean (intersection) [Pg] |
Model Period Mean (complement) [Pg] |
Benchmark Period Mean (complement) [Pg] |
Bias [kg m-2] |
Bias Score [1] |
Spatial Distribution Score [1] |
Overall Score [1] |
|||
|---|---|---|---|---|---|---|---|---|---|---|---|---|
| Benchmark | [-] | 473. | ||||||||||
| CLM5_GSWP3V1 | [-] | 1.07e+03 | 355. | 472. | 714. | 0.940 | -4.96 | 0.532 | 0.788 | 0.660 | ||
| Control | [-] | 1.23e+03 | 536. | 472. | 696. | 0.940 | 3.39 | 0.531 | 0.574 | 0.552 | ||
| Randomized | [-] | 1.23e+03 | 536. | 472. | 696. | 0.940 | 3.38 | 0.531 | 0.575 | 0.553 |
Download Data |
Period Mean (original grids) [Pg] |
Model Period Mean (intersection) [Pg] |
Benchmark Period Mean (intersection) [Pg] |
Model Period Mean (complement) [Pg] |
Benchmark Period Mean (complement) [Pg] |
Bias [kg m-2] |
Bias Score [1] |
Spatial Distribution Score [1] |
Overall Score [1] |
|||
|---|---|---|---|---|---|---|---|---|---|---|---|---|
| Benchmark | [-] | 116. | ||||||||||
| CLM5_GSWP3V1 | [-] | 89.4 | 83.9 | 116. | 5.06 | 0.373 | -4.73 | 0.424 | 0.741 | 0.583 | ||
| Control | [-] | 130. | 123. | 116. | 6.58 | 0.373 | 2.27 | 0.417 | 0.637 | 0.527 | ||
| Randomized | [-] | 129. | 123. | 116. | 6.57 | 0.373 | 2.25 | 0.417 | 0.638 | 0.528 |
Download Data |
Period Mean (original grids) [Pg] |
Model Period Mean (intersection) [Pg] |
Benchmark Period Mean (intersection) [Pg] |
Model Period Mean (complement) [Pg] |
Benchmark Period Mean (complement) [Pg] |
Bias [kg m-2] |
Bias Score [1] |
Spatial Distribution Score [1] |
Overall Score [1] |
|||
|---|---|---|---|---|---|---|---|---|---|---|---|---|
| Benchmark | [-] | 0.0131 | ||||||||||
| CLM5_GSWP3V1 | [-] | 38.6 | 0.0226 | 0.0131 | 37.9 | 4.34 | 0.480 | 2.68e-23 | 0.240 | |||
| Control | [-] | 38.3 | 0.0227 | 0.0131 | 37.6 | 4.32 | 0.481 | 5.04e-23 | 0.241 | |||
| Randomized | [-] | 38.3 | 0.0226 | 0.0131 | 37.6 | 4.28 | 0.485 | 7.00e-23 | 0.242 |
Download Data |
Period Mean (original grids) [Pg] |
Model Period Mean (intersection) [Pg] |
Benchmark Period Mean (intersection) [Pg] |
Model Period Mean (complement) [Pg] |
Benchmark Period Mean (complement) [Pg] |
Bias [kg m-2] |
Bias Score [1] |
Spatial Distribution Score [1] |
Overall Score [1] |
|||
|---|---|---|---|---|---|---|---|---|---|---|---|---|
| Benchmark | [-] | 46.1 | ||||||||||
| CLM5_GSWP3V1 | [-] | 82.6 | 38.3 | 46.1 | 44.8 | 0.00725 | -3.81 | 0.501 | 0.568 | 0.534 | ||
| Control | [-] | 86.7 | 42.8 | 46.1 | 43.6 | 0.00725 | -1.84 | 0.519 | 0.783 | 0.651 | ||
| Randomized | [-] | 86.6 | 42.8 | 46.1 | 43.6 | 0.00725 | -1.85 | 0.518 | 0.783 | 0.651 |
Download Data |
Period Mean (original grids) [Pg] |
Model Period Mean (intersection) [Pg] |
Benchmark Period Mean (intersection) [Pg] |
Model Period Mean (complement) [Pg] |
Benchmark Period Mean (complement) [Pg] |
Bias [kg m-2] |
Bias Score [1] |
Spatial Distribution Score [1] |
Overall Score [1] |
|||
|---|---|---|---|---|---|---|---|---|---|---|---|---|
| Benchmark | [-] | 0.232 | ||||||||||
| CLM5_GSWP3V1 | [-] | 14.2 | 0.336 | 0.232 | 14.6 | 0.994 | 0.480 | 0.833 | 0.657 | |||
| Control | [-] | 15.0 | 0.200 | 0.232 | 15.6 | -1.06 | 0.524 | 0.440 | 0.482 | |||
| Randomized | [-] | 15.1 | 0.200 | 0.232 | 15.6 | -1.05 | 0.524 | 0.439 | 0.481 |
Temporally integrated period mean