Mean State
Download Data |
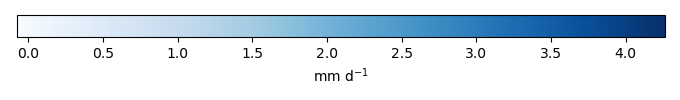
Period Mean (original grids) [mm d-1] |
Model Period Mean (intersection) [mm d-1] |
Benchmark Period Mean (intersection) [mm d-1] |
Model Period Mean (complement) [mm d-1] |
Benchmark Period Mean (complement) [mm d-1] |
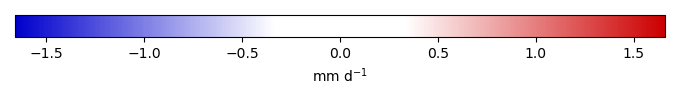
Bias [mm d-1] |
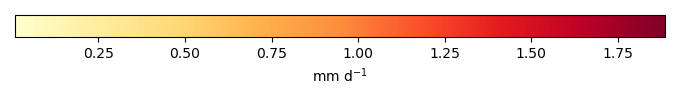
RMSE [mm d-1] |
Phase Shift [months] |
Bias Score [1] |
RMSE Score [1] |
Seasonal Cycle Score [1] |
Spatial Distribution Score [1] |
Overall Score [1] |
|||
|---|---|---|---|---|---|---|---|---|---|---|---|---|---|---|---|---|
| Benchmark | [-] | 2.78 | ||||||||||||||
| CLM5_GSWP3V1 | [-] | 2.50 | 2.51 | 2.78 | 2.53 | 3.97 | -0.287 | 0.609 | 1.46 | 0.584 | 0.729 | 0.788 | 0.946 | 0.755 | ||
| Control | [-] | 2.39 | 2.39 | 2.78 | 2.54 | 3.97 | -0.399 | 0.705 | 1.77 | 0.512 | 0.711 | 0.727 | 0.960 | 0.724 | ||
| Randomized | [-] | 2.49 | 2.50 | 2.78 | 2.63 | 3.97 | -0.296 | 0.664 | 1.90 | 0.554 | 0.704 | 0.699 | 0.960 | 0.724 |
Download Data |
Period Mean (original grids) [mm d-1] |
Model Period Mean (intersection) [mm d-1] |
Benchmark Period Mean (intersection) [mm d-1] |
Model Period Mean (complement) [mm d-1] |
Benchmark Period Mean (complement) [mm d-1] |
Bias [mm d-1] |
RMSE [mm d-1] |
Phase Shift [months] |
Bias Score [1] |
RMSE Score [1] |
Seasonal Cycle Score [1] |
Spatial Distribution Score [1] |
Overall Score [1] |
|||
|---|---|---|---|---|---|---|---|---|---|---|---|---|---|---|---|---|
| Benchmark | [-] | 1.69 | ||||||||||||||
| CLM5_GSWP3V1 | [-] | 1.61 | 1.59 | 1.69 | 1.72 | 4.49 | -0.100 | 0.614 | 1.46 | 0.682 | 0.597 | 0.784 | 0.926 | 0.717 | ||
| Control | [-] | 1.29 | 1.27 | 1.69 | 1.45 | 4.50 | -0.425 | 0.762 | 1.02 | 0.500 | 0.570 | 0.865 | 0.947 | 0.690 | ||
| Randomized | [-] | 1.37 | 1.34 | 1.69 | 1.48 | 4.50 | -0.349 | 0.727 | 1.10 | 0.542 | 0.573 | 0.854 | 0.955 | 0.699 |
Download Data |
Period Mean (original grids) [mm d-1] |
Model Period Mean (intersection) [mm d-1] |
Benchmark Period Mean (intersection) [mm d-1] |
Model Period Mean (complement) [mm d-1] |
Benchmark Period Mean (complement) [mm d-1] |
Bias [mm d-1] |
RMSE [mm d-1] |
Phase Shift [months] |
Bias Score [1] |
RMSE Score [1] |
Seasonal Cycle Score [1] |
Spatial Distribution Score [1] |
Overall Score [1] |
|||
|---|---|---|---|---|---|---|---|---|---|---|---|---|---|---|---|---|
| Benchmark | [-] | 1.93 | ||||||||||||||
| CLM5_GSWP3V1 | [-] | 1.75 | 1.74 | 1.92 | 1.93 | 3.54 | -0.170 | 0.722 | 1.10 | 0.677 | 0.562 | 0.863 | 0.940 | 0.721 | ||
| Control | [-] | 1.48 | 1.45 | 1.92 | 2.00 | 3.54 | -0.446 | 0.822 | 1.08 | 0.525 | 0.555 | 0.861 | 0.942 | 0.688 | ||
| Randomized | [-] | 1.52 | 1.50 | 1.92 | 2.04 | 3.54 | -0.398 | 0.806 | 1.27 | 0.547 | 0.554 | 0.838 | 0.952 | 0.689 |
Download Data |
Period Mean (original grids) [mm d-1] |
Model Period Mean (intersection) [mm d-1] |
Benchmark Period Mean (intersection) [mm d-1] |
Model Period Mean (complement) [mm d-1] |
Benchmark Period Mean (complement) [mm d-1] |
Bias [mm d-1] |
RMSE [mm d-1] |
Phase Shift [months] |
Bias Score [1] |
RMSE Score [1] |
Seasonal Cycle Score [1] |
Spatial Distribution Score [1] |
Overall Score [1] |
|||
|---|---|---|---|---|---|---|---|---|---|---|---|---|---|---|---|---|
| Benchmark | [-] | 0.676 | ||||||||||||||
| CLM5_GSWP3V1 | [-] | 0.507 | 0.512 | 0.676 | 0.424 | 0.670 | -0.174 | 0.357 | 0.236 | 0.397 | 0.417 | 0.983 | 0.972 | 0.637 | ||
| Control | [-] | 0.288 | 0.297 | 0.678 | 0.135 | 0.673 | -0.396 | 0.613 | 0.252 | 0.0994 | 0.155 | 0.975 | 0.873 | 0.452 | ||
| Randomized | [-] | 0.320 | 0.329 | 0.678 | 0.152 | 0.673 | -0.365 | 0.585 | 0.244 | 0.150 | 0.177 | 0.978 | 0.853 | 0.467 |
Download Data |
Period Mean (original grids) [mm d-1] |
Model Period Mean (intersection) [mm d-1] |
Benchmark Period Mean (intersection) [mm d-1] |
Model Period Mean (complement) [mm d-1] |
Benchmark Period Mean (complement) [mm d-1] |
Bias [mm d-1] |
RMSE [mm d-1] |
Phase Shift [months] |
Bias Score [1] |
RMSE Score [1] |
Seasonal Cycle Score [1] |
Spatial Distribution Score [1] |
Overall Score [1] |
|||
|---|---|---|---|---|---|---|---|---|---|---|---|---|---|---|---|---|
| Benchmark | [-] | 4.09 | ||||||||||||||
| CLM5_GSWP3V1 | [-] | 3.43 | 3.41 | 4.05 | 3.54 | 4.58 | -0.615 | 0.775 | 2.13 | 0.298 | 0.753 | 0.659 | 0.818 | 0.656 | ||
| Control | [-] | 3.01 | 2.94 | 4.05 | 3.42 | 4.58 | -0.997 | 1.13 | 2.32 | 0.237 | 0.727 | 0.633 | 0.720 | 0.609 | ||
| Randomized | [-] | 3.08 | 3.01 | 4.05 | 3.49 | 4.58 | -0.921 | 1.08 | 2.28 | 0.258 | 0.724 | 0.633 | 0.711 | 0.610 |
Download Data |
Period Mean (original grids) [mm d-1] |
Model Period Mean (intersection) [mm d-1] |
Benchmark Period Mean (intersection) [mm d-1] |
Model Period Mean (complement) [mm d-1] |
Benchmark Period Mean (complement) [mm d-1] |
Bias [mm d-1] |
RMSE [mm d-1] |
Phase Shift [months] |
Bias Score [1] |
RMSE Score [1] |
Seasonal Cycle Score [1] |
Spatial Distribution Score [1] |
Overall Score [1] |
|||
|---|---|---|---|---|---|---|---|---|---|---|---|---|---|---|---|---|
| Benchmark | [-] | 1.12 | ||||||||||||||
| CLM5_GSWP3V1 | [-] | 0.875 | 0.872 | 1.12 | 0.886 | 1.54 | -0.248 | 0.447 | 0.351 | 0.304 | 0.408 | 0.976 | 0.979 | 0.615 | ||
| Control | [-] | 0.618 | 0.614 | 1.12 | 0.646 | 1.53 | -0.506 | 0.694 | 0.382 | 0.0692 | 0.241 | 0.974 | 0.927 | 0.490 | ||
| Randomized | [-] | 0.630 | 0.626 | 1.12 | 0.659 | 1.53 | -0.495 | 0.689 | 0.428 | 0.0782 | 0.240 | 0.971 | 0.917 | 0.489 |
Download Data |
Period Mean (original grids) [mm d-1] |
Model Period Mean (intersection) [mm d-1] |
Benchmark Period Mean (intersection) [mm d-1] |
Model Period Mean (complement) [mm d-1] |
Benchmark Period Mean (complement) [mm d-1] |
Bias [mm d-1] |
RMSE [mm d-1] |
Phase Shift [months] |
Bias Score [1] |
RMSE Score [1] |
Seasonal Cycle Score [1] |
Spatial Distribution Score [1] |
Overall Score [1] |
|||
|---|---|---|---|---|---|---|---|---|---|---|---|---|---|---|---|---|
| Benchmark | [-] | 1.04 | ||||||||||||||
| CLM5_GSWP3V1 | [-] | 0.956 | 0.936 | 1.04 | 1.70 | 2.44 | -0.0808 | 0.414 | 0.653 | 0.630 | 0.613 | 0.935 | 0.943 | 0.747 | ||
| Control | [-] | 0.931 | 0.908 | 1.05 | 1.63 | 2.45 | -0.120 | 0.541 | 0.742 | 0.532 | 0.515 | 0.923 | 0.858 | 0.668 | ||
| Randomized | [-] | 0.969 | 0.945 | 1.05 | 1.66 | 2.45 | -0.0830 | 0.563 | 0.714 | 0.524 | 0.486 | 0.926 | 0.861 | 0.657 |
Download Data |
Period Mean (original grids) [mm d-1] |
Model Period Mean (intersection) [mm d-1] |
Benchmark Period Mean (intersection) [mm d-1] |
Model Period Mean (complement) [mm d-1] |
Benchmark Period Mean (complement) [mm d-1] |
Bias [mm d-1] |
RMSE [mm d-1] |
Phase Shift [months] |
Bias Score [1] |
RMSE Score [1] |
Seasonal Cycle Score [1] |
Spatial Distribution Score [1] |
Overall Score [1] |
|||
|---|---|---|---|---|---|---|---|---|---|---|---|---|---|---|---|---|
| Benchmark | [-] | 2.01 | ||||||||||||||
| CLM5_GSWP3V1 | [-] | 2.02 | 1.98 | 1.99 | 2.66 | 4.28 | 0.0627 | 0.770 | 2.04 | 0.526 | 0.533 | 0.681 | 0.912 | 0.637 | ||
| Control | [-] | 1.97 | 1.93 | 2.00 | 2.89 | 4.28 | 0.0257 | 0.784 | 1.65 | 0.509 | 0.551 | 0.754 | 0.956 | 0.664 | ||
| Randomized | [-] | 2.01 | 1.97 | 2.00 | 2.94 | 4.28 | 0.0648 | 0.794 | 1.69 | 0.499 | 0.544 | 0.749 | 0.957 | 0.658 |
Download Data |
Period Mean (original grids) [mm d-1] |
Model Period Mean (intersection) [mm d-1] |
Benchmark Period Mean (intersection) [mm d-1] |
Model Period Mean (complement) [mm d-1] |
Benchmark Period Mean (complement) [mm d-1] |
Bias [mm d-1] |
RMSE [mm d-1] |
Phase Shift [months] |
Bias Score [1] |
RMSE Score [1] |
Seasonal Cycle Score [1] |
Spatial Distribution Score [1] |
Overall Score [1] |
|||
|---|---|---|---|---|---|---|---|---|---|---|---|---|---|---|---|---|
| Benchmark | [-] | 0.591 | ||||||||||||||
| CLM5_GSWP3V1 | [-] | 0.561 | 0.571 | 0.591 | 0.422 | 0.481 | -0.0286 | 0.331 | 0.108 | 0.543 | 0.394 | 0.993 | 0.984 | 0.662 | ||
| Control | [-] | 0.136 | 0.146 | 0.595 | -0.0183 | 0.487 | -0.455 | 0.687 | 0.302 | 0.0149 | 0.0677 | 0.966 | 0.864 | 0.396 | ||
| Randomized | [-] | 0.140 | 0.150 | 0.595 | -0.0164 | 0.487 | -0.451 | 0.680 | 0.314 | 0.0189 | 0.0748 | 0.965 | 0.869 | 0.400 |
Download Data |
Period Mean (original grids) [mm d-1] |
Model Period Mean (intersection) [mm d-1] |
Benchmark Period Mean (intersection) [mm d-1] |
Model Period Mean (complement) [mm d-1] |
Benchmark Period Mean (complement) [mm d-1] |
Bias [mm d-1] |
RMSE [mm d-1] |
Phase Shift [months] |
Bias Score [1] |
RMSE Score [1] |
Seasonal Cycle Score [1] |
Spatial Distribution Score [1] |
Overall Score [1] |
|||
|---|---|---|---|---|---|---|---|---|---|---|---|---|---|---|---|---|
| Benchmark | [-] | 1.21 | ||||||||||||||
| CLM5_GSWP3V1 | [-] | 1.16 | 1.12 | 1.18 | 2.09 | 3.66 | 0.00332 | 0.395 | 0.668 | 0.739 | 0.776 | 0.927 | 0.917 | 0.827 | ||
| Control | [-] | 1.06 | 1.03 | 1.19 | 1.93 | 3.67 | -0.0992 | 0.453 | 0.640 | 0.724 | 0.735 | 0.932 | 0.832 | 0.792 | ||
| Randomized | [-] | 1.06 | 1.02 | 1.19 | 1.95 | 3.67 | -0.103 | 0.446 | 0.659 | 0.734 | 0.734 | 0.929 | 0.846 | 0.796 |
Download Data |
Period Mean (original grids) [mm d-1] |
Model Period Mean (intersection) [mm d-1] |
Benchmark Period Mean (intersection) [mm d-1] |
Model Period Mean (complement) [mm d-1] |
Benchmark Period Mean (complement) [mm d-1] |
Bias [mm d-1] |
RMSE [mm d-1] |
Phase Shift [months] |
Bias Score [1] |
RMSE Score [1] |
Seasonal Cycle Score [1] |
Spatial Distribution Score [1] |
Overall Score [1] |
|||
|---|---|---|---|---|---|---|---|---|---|---|---|---|---|---|---|---|
| Benchmark | [-] | 1.37 | ||||||||||||||
| CLM5_GSWP3V1 | [-] | 1.17 | 1.18 | 1.36 | 1.17 | 1.84 | -0.177 | 0.493 | 0.493 | 0.525 | 0.557 | 0.966 | 0.970 | 0.715 | ||
| Control | [-] | 0.933 | 0.923 | 1.37 | 1.08 | 1.85 | -0.417 | 0.676 | 0.482 | 0.333 | 0.459 | 0.966 | 0.964 | 0.636 | ||
| Randomized | [-] | 0.959 | 0.950 | 1.37 | 1.10 | 1.85 | -0.391 | 0.670 | 0.511 | 0.357 | 0.452 | 0.964 | 0.960 | 0.637 |
Download Data |
Period Mean (original grids) [mm d-1] |
Model Period Mean (intersection) [mm d-1] |
Benchmark Period Mean (intersection) [mm d-1] |
Model Period Mean (complement) [mm d-1] |
Benchmark Period Mean (complement) [mm d-1] |
Bias [mm d-1] |
RMSE [mm d-1] |
Phase Shift [months] |
Bias Score [1] |
RMSE Score [1] |
Seasonal Cycle Score [1] |
Spatial Distribution Score [1] |
Overall Score [1] |
|||
|---|---|---|---|---|---|---|---|---|---|---|---|---|---|---|---|---|
| Benchmark | [-] | 1.35 | ||||||||||||||
| CLM5_GSWP3V1 | [-] | 1.20 | 1.19 | 1.34 | 1.52 | 2.96 | -0.123 | 0.458 | 1.07 | 0.583 | 0.614 | 0.855 | 0.969 | 0.727 | ||
| Control | [-] | 1.04 | 1.03 | 1.34 | 1.42 | 2.96 | -0.282 | 0.589 | 0.865 | 0.454 | 0.538 | 0.891 | 0.936 | 0.671 | ||
| Randomized | [-] | 1.08 | 1.06 | 1.34 | 1.44 | 2.96 | -0.248 | 0.583 | 0.915 | 0.466 | 0.530 | 0.884 | 0.945 | 0.671 |
Download Data |
Period Mean (original grids) [mm d-1] |
Model Period Mean (intersection) [mm d-1] |
Benchmark Period Mean (intersection) [mm d-1] |
Model Period Mean (complement) [mm d-1] |
Benchmark Period Mean (complement) [mm d-1] |
Bias [mm d-1] |
RMSE [mm d-1] |
Phase Shift [months] |
Bias Score [1] |
RMSE Score [1] |
Seasonal Cycle Score [1] |
Spatial Distribution Score [1] |
Overall Score [1] |
|||
|---|---|---|---|---|---|---|---|---|---|---|---|---|---|---|---|---|
| Benchmark | [-] | 0.340 | ||||||||||||||
| CLM5_GSWP3V1 | [-] | 0.304 | 0.302 | 0.329 | 0.675 | 2.70 | -0.0140 | 0.277 | 1.08 | 0.830 | 0.837 | 0.852 | 0.692 | 0.810 | ||
| Control | [-] | 0.277 | 0.273 | 0.334 | 0.698 | 2.71 | -0.0449 | 0.290 | 0.972 | 0.837 | 0.818 | 0.874 | 0.688 | 0.807 | ||
| Randomized | [-] | 0.287 | 0.283 | 0.334 | 0.705 | 2.71 | -0.0346 | 0.297 | 1.07 | 0.834 | 0.811 | 0.859 | 0.698 | 0.803 |
Download Data |
Period Mean (original grids) [mm d-1] |
Model Period Mean (intersection) [mm d-1] |
Benchmark Period Mean (intersection) [mm d-1] |
Model Period Mean (complement) [mm d-1] |
Benchmark Period Mean (complement) [mm d-1] |
Bias [mm d-1] |
RMSE [mm d-1] |
Phase Shift [months] |
Bias Score [1] |
RMSE Score [1] |
Seasonal Cycle Score [1] |
Spatial Distribution Score [1] |
Overall Score [1] |
|||
|---|---|---|---|---|---|---|---|---|---|---|---|---|---|---|---|---|
| Benchmark | [-] | 0.694 | ||||||||||||||
| CLM5_GSWP3V1 | [-] | 0.547 | 0.556 | 0.694 | 0.412 | 0.644 | -0.154 | 0.365 | 0.336 | 0.418 | 0.394 | 0.978 | 0.983 | 0.634 | ||
| Control | [-] | 0.268 | 0.278 | 0.696 | 0.169 | 0.646 | -0.431 | 0.648 | 0.607 | 0.0519 | 0.146 | 0.944 | 0.912 | 0.440 | ||
| Randomized | [-] | 0.273 | 0.283 | 0.696 | 0.172 | 0.646 | -0.426 | 0.643 | 0.643 | 0.0576 | 0.154 | 0.939 | 0.915 | 0.444 |
Download Data |
Period Mean (original grids) [mm d-1] |
Model Period Mean (intersection) [mm d-1] |
Benchmark Period Mean (intersection) [mm d-1] |
Model Period Mean (complement) [mm d-1] |
Benchmark Period Mean (complement) [mm d-1] |
Bias [mm d-1] |
RMSE [mm d-1] |
Phase Shift [months] |
Bias Score [1] |
RMSE Score [1] |
Seasonal Cycle Score [1] |
Spatial Distribution Score [1] |
Overall Score [1] |
|||
|---|---|---|---|---|---|---|---|---|---|---|---|---|---|---|---|---|
| Benchmark | [-] | 2.38 | ||||||||||||||
| CLM5_GSWP3V1 | [-] | 2.01 | 2.00 | 2.33 | 2.15 | 4.12 | -0.212 | 0.705 | 1.24 | 0.566 | 0.656 | 0.827 | 0.950 | 0.731 | ||
| Control | [-] | 1.82 | 1.80 | 2.34 | 2.05 | 4.13 | -0.420 | 0.894 | 1.28 | 0.459 | 0.583 | 0.824 | 0.909 | 0.672 | ||
| Randomized | [-] | 1.89 | 1.87 | 2.34 | 2.11 | 4.13 | -0.355 | 0.886 | 1.33 | 0.461 | 0.578 | 0.818 | 0.909 | 0.669 |
Download Data |
Period Mean (original grids) [mm d-1] |
Model Period Mean (intersection) [mm d-1] |
Benchmark Period Mean (intersection) [mm d-1] |
Model Period Mean (complement) [mm d-1] |
Benchmark Period Mean (complement) [mm d-1] |
Bias [mm d-1] |
RMSE [mm d-1] |
Phase Shift [months] |
Bias Score [1] |
RMSE Score [1] |
Seasonal Cycle Score [1] |
Spatial Distribution Score [1] |
Overall Score [1] |
|||
|---|---|---|---|---|---|---|---|---|---|---|---|---|---|---|---|---|
| Benchmark | [-] | 2.04 | ||||||||||||||
| CLM5_GSWP3V1 | [-] | 1.84 | 1.84 | 2.03 | 1.94 | 3.76 | -0.159 | 0.496 | 0.487 | 0.550 | 0.513 | 0.963 | 0.960 | 0.699 | ||
| Control | [-] | 1.54 | 1.54 | 2.04 | 1.70 | 3.76 | -0.465 | 0.697 | 0.452 | 0.237 | 0.453 | 0.967 | 0.971 | 0.616 | ||
| Randomized | [-] | 1.57 | 1.56 | 2.04 | 1.72 | 3.76 | -0.440 | 0.708 | 0.438 | 0.259 | 0.416 | 0.968 | 0.978 | 0.607 |
Download Data |
Period Mean (original grids) [mm d-1] |
Model Period Mean (intersection) [mm d-1] |
Benchmark Period Mean (intersection) [mm d-1] |
Model Period Mean (complement) [mm d-1] |
Benchmark Period Mean (complement) [mm d-1] |
Bias [mm d-1] |
RMSE [mm d-1] |
Phase Shift [months] |
Bias Score [1] |
RMSE Score [1] |
Seasonal Cycle Score [1] |
Spatial Distribution Score [1] |
Overall Score [1] |
|||
|---|---|---|---|---|---|---|---|---|---|---|---|---|---|---|---|---|
| Benchmark | [-] | 1.38 | ||||||||||||||
| CLM5_GSWP3V1 | [-] | 1.08 | 1.08 | 1.38 | 1.15 | 1.72 | -0.298 | 0.536 | 0.362 | 0.331 | 0.453 | 0.976 | 0.736 | 0.590 | ||
| Control | [-] | 0.741 | 0.737 | 1.38 | 0.830 | 1.72 | -0.642 | 0.872 | 0.388 | 0.134 | 0.240 | 0.973 | 0.928 | 0.503 | ||
| Randomized | [-] | 0.743 | 0.740 | 1.38 | 0.827 | 1.72 | -0.640 | 0.884 | 0.396 | 0.139 | 0.221 | 0.972 | 0.927 | 0.496 |
Download Data |
Period Mean (original grids) [mm d-1] |
Model Period Mean (intersection) [mm d-1] |
Benchmark Period Mean (intersection) [mm d-1] |
Model Period Mean (complement) [mm d-1] |
Benchmark Period Mean (complement) [mm d-1] |
Bias [mm d-1] |
RMSE [mm d-1] |
Phase Shift [months] |
Bias Score [1] |
RMSE Score [1] |
Seasonal Cycle Score [1] |
Spatial Distribution Score [1] |
Overall Score [1] |
|||
|---|---|---|---|---|---|---|---|---|---|---|---|---|---|---|---|---|
| Benchmark | [-] | 1.05 | ||||||||||||||
| CLM5_GSWP3V1 | [-] | 0.926 | 0.939 | 1.05 | 1.19 | 2.75 | -0.104 | 0.524 | 0.670 | 0.621 | 0.586 | 0.933 | 0.746 | 0.694 | ||
| Control | [-] | 0.864 | 0.876 | 1.06 | 0.927 | 2.75 | -0.175 | 0.604 | 0.817 | 0.595 | 0.532 | 0.915 | 0.601 | 0.635 | ||
| Randomized | [-] | 0.902 | 0.915 | 1.06 | 0.943 | 2.75 | -0.136 | 0.637 | 0.843 | 0.580 | 0.499 | 0.912 | 0.646 | 0.627 |
Download Data |
Period Mean (original grids) [mm d-1] |
Model Period Mean (intersection) [mm d-1] |
Benchmark Period Mean (intersection) [mm d-1] |
Model Period Mean (complement) [mm d-1] |
Benchmark Period Mean (complement) [mm d-1] |
Bias [mm d-1] |
RMSE [mm d-1] |
Phase Shift [months] |
Bias Score [1] |
RMSE Score [1] |
Seasonal Cycle Score [1] |
Spatial Distribution Score [1] |
Overall Score [1] |
|||
|---|---|---|---|---|---|---|---|---|---|---|---|---|---|---|---|---|
| Benchmark | [-] | 3.69 | ||||||||||||||
| CLM5_GSWP3V1 | [-] | 3.27 | 3.27 | 3.68 | 3.09 | 4.50 | -0.415 | 0.728 | 3.10 | 0.427 | 0.675 | 0.467 | 0.797 | 0.608 | ||
| Control | [-] | 2.99 | 2.98 | 3.68 | 3.33 | 4.51 | -0.675 | 0.942 | 2.32 | 0.313 | 0.654 | 0.637 | 0.969 | 0.645 | ||
| Randomized | [-] | 3.09 | 3.09 | 3.68 | 3.42 | 4.51 | -0.574 | 0.879 | 2.48 | 0.363 | 0.648 | 0.606 | 0.976 | 0.648 |
Download Data |
Period Mean (original grids) [mm d-1] |
Model Period Mean (intersection) [mm d-1] |
Benchmark Period Mean (intersection) [mm d-1] |
Model Period Mean (complement) [mm d-1] |
Benchmark Period Mean (complement) [mm d-1] |
Bias [mm d-1] |
RMSE [mm d-1] |
Phase Shift [months] |
Bias Score [1] |
RMSE Score [1] |
Seasonal Cycle Score [1] |
Spatial Distribution Score [1] |
Overall Score [1] |
|||
|---|---|---|---|---|---|---|---|---|---|---|---|---|---|---|---|---|
| Benchmark | [-] | 2.31 | ||||||||||||||
| CLM5_GSWP3V1 | [-] | 2.32 | 2.30 | 2.31 | 2.55 | 3.70 | 0.00826 | 0.542 | 0.966 | 0.675 | 0.677 | 0.894 | 0.981 | 0.781 | ||
| Control | [-] | 2.02 | 2.01 | 2.31 | 2.42 | 3.70 | -0.281 | 0.620 | 0.617 | 0.570 | 0.672 | 0.942 | 0.988 | 0.769 | ||
| Randomized | [-] | 2.12 | 2.11 | 2.31 | 2.46 | 3.70 | -0.184 | 0.585 | 0.784 | 0.610 | 0.672 | 0.922 | 0.989 | 0.773 |
Download Data |
Period Mean (original grids) [mm d-1] |
Model Period Mean (intersection) [mm d-1] |
Benchmark Period Mean (intersection) [mm d-1] |
Model Period Mean (complement) [mm d-1] |
Benchmark Period Mean (complement) [mm d-1] |
Bias [mm d-1] |
RMSE [mm d-1] |
Phase Shift [months] |
Bias Score [1] |
RMSE Score [1] |
Seasonal Cycle Score [1] |
Spatial Distribution Score [1] |
Overall Score [1] |
|||
|---|---|---|---|---|---|---|---|---|---|---|---|---|---|---|---|---|
| Benchmark | [-] | 0.970 | ||||||||||||||
| CLM5_GSWP3V1 | [-] | 0.978 | 0.985 | 0.962 | 0.687 | 1.85 | 0.0177 | 0.544 | 0.904 | 0.498 | 0.676 | 0.898 | 0.859 | 0.721 | ||
| Control | [-] | 0.843 | 0.845 | 0.970 | 0.622 | 1.85 | -0.138 | 0.734 | 1.17 | 0.405 | 0.577 | 0.847 | 0.733 | 0.628 | ||
| Randomized | [-] | 0.877 | 0.878 | 0.970 | 0.638 | 1.85 | -0.107 | 0.751 | 1.24 | 0.391 | 0.564 | 0.838 | 0.753 | 0.622 |
Temporally integrated period mean