Mean State
Download Data |
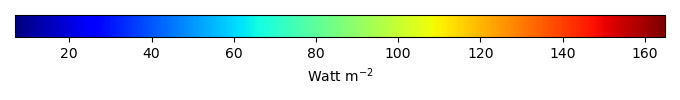
Period Mean (original grids) [Watt m-2] |
Model Period Mean (intersection) [Watt m-2] |
Benchmark Period Mean (intersection) [Watt m-2] |
Model Period Mean (complement) [Watt m-2] |
Benchmark Period Mean (complement) [Watt m-2] |
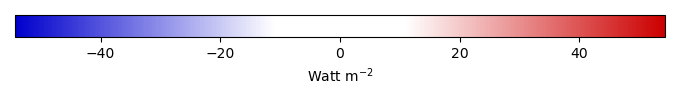
Bias [Watt m-2] |
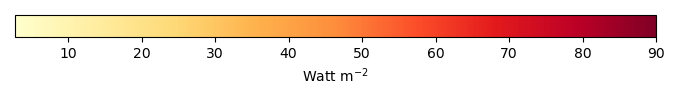
RMSE [Watt m-2] |
Phase Shift [months] |
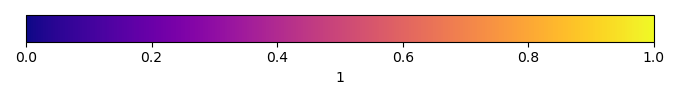
Bias Score [1] |
RMSE Score [1] |
Seasonal Cycle Score [1] |
Spatial Distribution Score [1] |
Overall Score [1] |
|||
|---|---|---|---|---|---|---|---|---|---|---|---|---|---|---|---|---|
| Benchmark | [-] | 38.3 | ||||||||||||||
| CLM5_GSWP3V1 | [-] | 34.1 | 33.9 | 39.6 | 15.5 | -5.11 | 9.35 | 1.56 | 0.289 | 0.782 | 0.757 | 0.981 | 0.718 | |||
| Control | [-] | 66.9 | 67.0 | 39.6 | 15.5 | 28.6 | 29.6 | 2.32 | 0.0341 | 0.444 | 0.618 | 0.976 | 0.503 | |||
| Randomized | [-] | 67.9 | 68.0 | 39.6 | 15.5 | 29.7 | 30.6 | 2.30 | 0.0324 | 0.472 | 0.616 | 0.974 | 0.513 |
Download Data |
Period Mean (original grids) [Watt m-2] |
Model Period Mean (intersection) [Watt m-2] |
Benchmark Period Mean (intersection) [Watt m-2] |
Model Period Mean (complement) [Watt m-2] |
Benchmark Period Mean (complement) [Watt m-2] |
Bias [Watt m-2] |
RMSE [Watt m-2] |
Phase Shift [months] |
Bias Score [1] |
RMSE Score [1] |
Seasonal Cycle Score [1] |
Spatial Distribution Score [1] |
Overall Score [1] |
|||
|---|---|---|---|---|---|---|---|---|---|---|---|---|---|---|---|---|
| Benchmark | [-] | 52.3 | ||||||||||||||
| CLM5_GSWP3V1 | [-] | 45.4 | 45.8 | 52.8 | 14.1 | -7.04 | 11.6 | 1.24 | 0.290 | 0.593 | 0.846 | 0.990 | 0.662 | |||
| Control | [-] | 87.1 | 87.6 | 52.8 | 14.1 | 34.9 | 37.0 | 1.42 | 0.0195 | 0.244 | 0.828 | 0.956 | 0.458 | |||
| Randomized | [-] | 87.1 | 87.6 | 52.8 | 14.1 | 34.9 | 36.9 | 1.41 | 0.0200 | 0.261 | 0.825 | 0.965 | 0.467 |
Download Data |
Period Mean (original grids) [Watt m-2] |
Model Period Mean (intersection) [Watt m-2] |
Benchmark Period Mean (intersection) [Watt m-2] |
Model Period Mean (complement) [Watt m-2] |
Benchmark Period Mean (complement) [Watt m-2] |
Bias [Watt m-2] |
RMSE [Watt m-2] |
Phase Shift [months] |
Bias Score [1] |
RMSE Score [1] |
Seasonal Cycle Score [1] |
Spatial Distribution Score [1] |
Overall Score [1] |
|||
|---|---|---|---|---|---|---|---|---|---|---|---|---|---|---|---|---|
| Benchmark | [-] | 39.3 | ||||||||||||||
| CLM5_GSWP3V1 | [-] | 37.0 | 37.0 | 40.4 | 16.6 | -3.30 | 10.5 | 1.84 | 0.367 | 0.605 | 0.717 | 0.902 | 0.639 | |||
| Control | [-] | 71.5 | 71.5 | 40.4 | 16.6 | 31.0 | 32.8 | 2.17 | 0.0122 | 0.272 | 0.656 | 0.969 | 0.436 | |||
| Randomized | [-] | 71.9 | 71.9 | 40.4 | 16.6 | 31.5 | 33.1 | 2.15 | 0.0122 | 0.289 | 0.662 | 0.969 | 0.444 |
Download Data |
Period Mean (original grids) [Watt m-2] |
Model Period Mean (intersection) [Watt m-2] |
Benchmark Period Mean (intersection) [Watt m-2] |
Model Period Mean (complement) [Watt m-2] |
Benchmark Period Mean (complement) [Watt m-2] |
Bias [Watt m-2] |
RMSE [Watt m-2] |
Phase Shift [months] |
Bias Score [1] |
RMSE Score [1] |
Seasonal Cycle Score [1] |
Spatial Distribution Score [1] |
Overall Score [1] |
|||
|---|---|---|---|---|---|---|---|---|---|---|---|---|---|---|---|---|
| Benchmark | [-] | 31.6 | ||||||||||||||
| CLM5_GSWP3V1 | [-] | 34.6 | 34.6 | 31.5 | 32.6 | 3.82 | 15.5 | 0.325 | 0.580 | 0.535 | 0.978 | 0.971 | 0.720 | |||
| Control | [-] | 51.6 | 51.6 | 31.5 | 32.6 | 21.7 | 31.7 | 0.390 | 0.102 | 0.348 | 0.973 | 0.897 | 0.534 | |||
| Randomized | [-] | 51.1 | 51.1 | 31.5 | 32.6 | 21.2 | 31.2 | 0.406 | 0.111 | 0.358 | 0.972 | 0.895 | 0.539 |
Download Data |
Period Mean (original grids) [Watt m-2] |
Model Period Mean (intersection) [Watt m-2] |
Benchmark Period Mean (intersection) [Watt m-2] |
Model Period Mean (complement) [Watt m-2] |
Benchmark Period Mean (complement) [Watt m-2] |
Bias [Watt m-2] |
RMSE [Watt m-2] |
Phase Shift [months] |
Bias Score [1] |
RMSE Score [1] |
Seasonal Cycle Score [1] |
Spatial Distribution Score [1] |
Overall Score [1] |
|||
|---|---|---|---|---|---|---|---|---|---|---|---|---|---|---|---|---|
| Benchmark | [-] | 23.5 | ||||||||||||||
| CLM5_GSWP3V1 | [-] | 28.0 | 27.9 | 25.9 | 15.5 | 2.69 | 8.87 | 1.43 | 0.354 | 0.792 | 0.791 | 0.230 | 0.592 | |||
| Control | [-] | 59.9 | 59.8 | 25.9 | 15.5 | 37.1 | 38.1 | 2.02 | 0.0241 | 0.466 | 0.689 | 0.842 | 0.497 | |||
| Randomized | [-] | 60.7 | 60.7 | 25.9 | 15.5 | 37.8 | 38.9 | 1.92 | 0.0223 | 0.472 | 0.708 | 0.832 | 0.501 |
Download Data |
Period Mean (original grids) [Watt m-2] |
Model Period Mean (intersection) [Watt m-2] |
Benchmark Period Mean (intersection) [Watt m-2] |
Model Period Mean (complement) [Watt m-2] |
Benchmark Period Mean (complement) [Watt m-2] |
Bias [Watt m-2] |
RMSE [Watt m-2] |
Phase Shift [months] |
Bias Score [1] |
RMSE Score [1] |
Seasonal Cycle Score [1] |
Spatial Distribution Score [1] |
Overall Score [1] |
|||
|---|---|---|---|---|---|---|---|---|---|---|---|---|---|---|---|---|
| Benchmark | [-] | 21.4 | ||||||||||||||
| CLM5_GSWP3V1 | [-] | 24.7 | 24.6 | 21.5 | 17.6 | 3.10 | 10.0 | 0.628 | 0.605 | 0.532 | 0.923 | 0.880 | 0.694 | |||
| Control | [-] | 41.9 | 41.7 | 21.5 | 17.6 | 20.2 | 24.2 | 0.664 | 0.0172 | 0.347 | 0.942 | 0.460 | 0.423 | |||
| Randomized | [-] | 41.3 | 41.1 | 21.5 | 17.6 | 19.7 | 23.4 | 0.700 | 0.0202 | 0.368 | 0.940 | 0.464 | 0.432 |
Download Data |
Period Mean (original grids) [Watt m-2] |
Model Period Mean (intersection) [Watt m-2] |
Benchmark Period Mean (intersection) [Watt m-2] |
Model Period Mean (complement) [Watt m-2] |
Benchmark Period Mean (complement) [Watt m-2] |
Bias [Watt m-2] |
RMSE [Watt m-2] |
Phase Shift [months] |
Bias Score [1] |
RMSE Score [1] |
Seasonal Cycle Score [1] |
Spatial Distribution Score [1] |
Overall Score [1] |
|||
|---|---|---|---|---|---|---|---|---|---|---|---|---|---|---|---|---|
| Benchmark | [-] | 30.0 | ||||||||||||||
| CLM5_GSWP3V1 | [-] | 35.3 | 35.3 | 30.4 | 10.5 | 4.30 | 8.34 | 0.955 | 0.535 | 0.616 | 0.874 | 0.970 | 0.722 | |||
| Control | [-] | 71.2 | 71.1 | 30.4 | 10.5 | 39.7 | 42.3 | 1.27 | 0.000190 | 0.248 | 0.830 | 0.427 | 0.351 | |||
| Randomized | [-] | 70.9 | 70.8 | 30.4 | 10.5 | 39.4 | 41.9 | 1.29 | 0.000169 | 0.266 | 0.824 | 0.429 | 0.357 |
Download Data |
Period Mean (original grids) [Watt m-2] |
Model Period Mean (intersection) [Watt m-2] |
Benchmark Period Mean (intersection) [Watt m-2] |
Model Period Mean (complement) [Watt m-2] |
Benchmark Period Mean (complement) [Watt m-2] |
Bias [Watt m-2] |
RMSE [Watt m-2] |
Phase Shift [months] |
Bias Score [1] |
RMSE Score [1] |
Seasonal Cycle Score [1] |
Spatial Distribution Score [1] |
Overall Score [1] |
|||
|---|---|---|---|---|---|---|---|---|---|---|---|---|---|---|---|---|
| Benchmark | [-] | 29.5 | ||||||||||||||
| CLM5_GSWP3V1 | [-] | 33.6 | 33.6 | 30.6 | 14.2 | 2.48 | 8.47 | 0.999 | 0.558 | 0.626 | 0.883 | 0.979 | 0.734 | |||
| Control | [-] | 79.4 | 79.2 | 30.6 | 14.2 | 47.7 | 49.1 | 1.32 | 0.000720 | 0.264 | 0.833 | 0.607 | 0.394 | |||
| Randomized | [-] | 79.9 | 79.6 | 30.6 | 14.2 | 48.2 | 49.5 | 1.20 | 0.00108 | 0.264 | 0.854 | 0.631 | 0.403 |
Download Data |
Period Mean (original grids) [Watt m-2] |
Model Period Mean (intersection) [Watt m-2] |
Benchmark Period Mean (intersection) [Watt m-2] |
Model Period Mean (complement) [Watt m-2] |
Benchmark Period Mean (complement) [Watt m-2] |
Bias [Watt m-2] |
RMSE [Watt m-2] |
Phase Shift [months] |
Bias Score [1] |
RMSE Score [1] |
Seasonal Cycle Score [1] |
Spatial Distribution Score [1] |
Overall Score [1] |
|||
|---|---|---|---|---|---|---|---|---|---|---|---|---|---|---|---|---|
| Benchmark | [-] | 33.0 | ||||||||||||||
| CLM5_GSWP3V1 | [-] | 31.0 | 30.9 | 32.8 | 37.1 | -1.33 | 12.8 | 0.330 | 0.597 | 0.554 | 0.978 | 0.798 | 0.696 | |||
| Control | [-] | 49.5 | 49.3 | 32.8 | 37.1 | 17.4 | 32.6 | 0.302 | 0.111 | 0.225 | 0.979 | 0.987 | 0.506 | |||
| Randomized | [-] | 47.8 | 47.6 | 32.8 | 37.1 | 15.6 | 30.4 | 0.227 | 0.153 | 0.262 | 0.985 | 0.986 | 0.529 |
Download Data |
Period Mean (original grids) [Watt m-2] |
Model Period Mean (intersection) [Watt m-2] |
Benchmark Period Mean (intersection) [Watt m-2] |
Model Period Mean (complement) [Watt m-2] |
Benchmark Period Mean (complement) [Watt m-2] |
Bias [Watt m-2] |
RMSE [Watt m-2] |
Phase Shift [months] |
Bias Score [1] |
RMSE Score [1] |
Seasonal Cycle Score [1] |
Spatial Distribution Score [1] |
Overall Score [1] |
|||
|---|---|---|---|---|---|---|---|---|---|---|---|---|---|---|---|---|
| Benchmark | [-] | 35.1 | ||||||||||||||
| CLM5_GSWP3V1 | [-] | 39.9 | 39.9 | 36.7 | 14.1 | 2.22 | 8.41 | 0.497 | 0.575 | 0.761 | 0.958 | 0.877 | 0.786 | |||
| Control | [-] | 68.0 | 68.0 | 36.7 | 14.1 | 30.4 | 31.4 | 0.870 | 0.00303 | 0.507 | 0.915 | 0.955 | 0.578 | |||
| Randomized | [-] | 69.6 | 69.6 | 36.7 | 14.1 | 31.9 | 33.0 | 0.874 | 0.00133 | 0.486 | 0.921 | 0.967 | 0.572 |
Download Data |
Period Mean (original grids) [Watt m-2] |
Model Period Mean (intersection) [Watt m-2] |
Benchmark Period Mean (intersection) [Watt m-2] |
Model Period Mean (complement) [Watt m-2] |
Benchmark Period Mean (complement) [Watt m-2] |
Bias [Watt m-2] |
RMSE [Watt m-2] |
Phase Shift [months] |
Bias Score [1] |
RMSE Score [1] |
Seasonal Cycle Score [1] |
Spatial Distribution Score [1] |
Overall Score [1] |
|||
|---|---|---|---|---|---|---|---|---|---|---|---|---|---|---|---|---|
| Benchmark | [-] | 19.8 | ||||||||||||||
| CLM5_GSWP3V1 | [-] | 22.5 | 22.5 | 20.7 | 10.0 | 1.74 | 8.32 | 1.06 | 0.606 | 0.520 | 0.879 | 0.886 | 0.682 | |||
| Control | [-] | 43.8 | 43.9 | 20.7 | 10.0 | 23.4 | 25.9 | 1.55 | 0.0140 | 0.288 | 0.802 | 0.743 | 0.427 | |||
| Randomized | [-] | 43.8 | 43.9 | 20.7 | 10.0 | 23.4 | 25.9 | 1.41 | 0.0151 | 0.302 | 0.826 | 0.747 | 0.438 |
Download Data |
Period Mean (original grids) [Watt m-2] |
Model Period Mean (intersection) [Watt m-2] |
Benchmark Period Mean (intersection) [Watt m-2] |
Model Period Mean (complement) [Watt m-2] |
Benchmark Period Mean (complement) [Watt m-2] |
Bias [Watt m-2] |
RMSE [Watt m-2] |
Phase Shift [months] |
Bias Score [1] |
RMSE Score [1] |
Seasonal Cycle Score [1] |
Spatial Distribution Score [1] |
Overall Score [1] |
|||
|---|---|---|---|---|---|---|---|---|---|---|---|---|---|---|---|---|
| Benchmark | [-] | 42.3 | ||||||||||||||
| CLM5_GSWP3V1 | [-] | 45.2 | 45.2 | 43.6 | 17.5 | 0.835 | 11.0 | 0.862 | 0.498 | 0.637 | 0.887 | 0.878 | 0.707 | |||
| Control | [-] | 74.3 | 74.3 | 43.6 | 17.5 | 30.1 | 37.1 | 1.13 | 0.0195 | 0.344 | 0.848 | 0.745 | 0.460 | |||
| Randomized | [-] | 74.4 | 74.4 | 43.6 | 17.5 | 30.2 | 37.2 | 1.12 | 0.0212 | 0.348 | 0.851 | 0.748 | 0.464 |
Download Data |
Period Mean (original grids) [Watt m-2] |
Model Period Mean (intersection) [Watt m-2] |
Benchmark Period Mean (intersection) [Watt m-2] |
Model Period Mean (complement) [Watt m-2] |
Benchmark Period Mean (complement) [Watt m-2] |
Bias [Watt m-2] |
RMSE [Watt m-2] |
Phase Shift [months] |
Bias Score [1] |
RMSE Score [1] |
Seasonal Cycle Score [1] |
Spatial Distribution Score [1] |
Overall Score [1] |
|||
|---|---|---|---|---|---|---|---|---|---|---|---|---|---|---|---|---|
| Benchmark | [-] | 64.3 | ||||||||||||||
| CLM5_GSWP3V1 | [-] | 78.3 | 78.1 | 66.1 | 16.6 | 10.2 | 15.6 | 0.549 | 0.367 | 0.698 | 0.948 | 0.985 | 0.739 | |||
| Control | [-] | 112. | 112. | 66.1 | 16.6 | 43.7 | 44.9 | 0.769 | 0.0126 | 0.541 | 0.917 | 0.984 | 0.599 | |||
| Randomized | [-] | 112. | 112. | 66.1 | 16.6 | 43.9 | 45.1 | 0.758 | 0.0124 | 0.548 | 0.918 | 0.984 | 0.602 |
Download Data |
Period Mean (original grids) [Watt m-2] |
Model Period Mean (intersection) [Watt m-2] |
Benchmark Period Mean (intersection) [Watt m-2] |
Model Period Mean (complement) [Watt m-2] |
Benchmark Period Mean (complement) [Watt m-2] |
Bias [Watt m-2] |
RMSE [Watt m-2] |
Phase Shift [months] |
Bias Score [1] |
RMSE Score [1] |
Seasonal Cycle Score [1] |
Spatial Distribution Score [1] |
Overall Score [1] |
|||
|---|---|---|---|---|---|---|---|---|---|---|---|---|---|---|---|---|
| Benchmark | [-] | 34.3 | ||||||||||||||
| CLM5_GSWP3V1 | [-] | 38.3 | 38.3 | 34.2 | 35.0 | 5.11 | 15.3 | 0.212 | 0.484 | 0.523 | 0.983 | 0.974 | 0.697 | |||
| Control | [-] | 56.0 | 55.9 | 34.2 | 35.0 | 23.7 | 35.5 | 0.320 | 0.0653 | 0.227 | 0.977 | 0.956 | 0.490 | |||
| Randomized | [-] | 55.0 | 55.0 | 34.2 | 35.0 | 22.8 | 34.6 | 0.340 | 0.0750 | 0.233 | 0.975 | 0.954 | 0.494 |
Download Data |
Period Mean (original grids) [Watt m-2] |
Model Period Mean (intersection) [Watt m-2] |
Benchmark Period Mean (intersection) [Watt m-2] |
Model Period Mean (complement) [Watt m-2] |
Benchmark Period Mean (complement) [Watt m-2] |
Bias [Watt m-2] |
RMSE [Watt m-2] |
Phase Shift [months] |
Bias Score [1] |
RMSE Score [1] |
Seasonal Cycle Score [1] |
Spatial Distribution Score [1] |
Overall Score [1] |
|||
|---|---|---|---|---|---|---|---|---|---|---|---|---|---|---|---|---|
| Benchmark | [-] | 24.8 | ||||||||||||||
| CLM5_GSWP3V1 | [-] | 34.1 | 34.1 | 27.0 | 14.3 | 6.83 | 9.07 | 0.888 | 0.533 | 0.753 | 0.907 | 0.852 | 0.760 | |||
| Control | [-] | 81.6 | 81.7 | 27.0 | 14.3 | 54.5 | 55.3 | 1.12 | 0.00 | 0.369 | 0.860 | 0.977 | 0.515 | |||
| Randomized | [-] | 81.7 | 81.8 | 27.0 | 14.3 | 54.7 | 55.5 | 1.16 | 0.00 | 0.370 | 0.851 | 0.973 | 0.513 |
Download Data |
Period Mean (original grids) [Watt m-2] |
Model Period Mean (intersection) [Watt m-2] |
Benchmark Period Mean (intersection) [Watt m-2] |
Model Period Mean (complement) [Watt m-2] |
Benchmark Period Mean (complement) [Watt m-2] |
Bias [Watt m-2] |
RMSE [Watt m-2] |
Phase Shift [months] |
Bias Score [1] |
RMSE Score [1] |
Seasonal Cycle Score [1] |
Spatial Distribution Score [1] |
Overall Score [1] |
|||
|---|---|---|---|---|---|---|---|---|---|---|---|---|---|---|---|---|
| Benchmark | [-] | 20.7 | ||||||||||||||
| CLM5_GSWP3V1 | [-] | 27.4 | 27.3 | 21.1 | 12.1 | 5.90 | 7.35 | 0.934 | 0.357 | 0.672 | 0.877 | 0.985 | 0.713 | |||
| Control | [-] | 61.1 | 60.9 | 21.1 | 12.1 | 39.8 | 40.7 | 1.40 | 0.00 | 0.300 | 0.818 | 0.680 | 0.420 | |||
| Randomized | [-] | 61.6 | 61.5 | 21.1 | 12.1 | 40.4 | 41.3 | 1.28 | 0.00 | 0.296 | 0.830 | 0.689 | 0.422 |
Download Data |
Period Mean (original grids) [Watt m-2] |
Model Period Mean (intersection) [Watt m-2] |
Benchmark Period Mean (intersection) [Watt m-2] |
Model Period Mean (complement) [Watt m-2] |
Benchmark Period Mean (complement) [Watt m-2] |
Bias [Watt m-2] |
RMSE [Watt m-2] |
Phase Shift [months] |
Bias Score [1] |
RMSE Score [1] |
Seasonal Cycle Score [1] |
Spatial Distribution Score [1] |
Overall Score [1] |
|||
|---|---|---|---|---|---|---|---|---|---|---|---|---|---|---|---|---|
| Benchmark | [-] | 20.3 | ||||||||||||||
| CLM5_GSWP3V1 | [-] | 24.5 | 24.6 | 20.6 | 10.6 | 3.84 | 9.15 | 0.619 | 0.445 | 0.551 | 0.918 | 0.871 | 0.667 | |||
| Control | [-] | 44.0 | 44.1 | 20.6 | 10.6 | 23.4 | 25.8 | 0.802 | 0.0125 | 0.331 | 0.914 | 0.652 | 0.448 | |||
| Randomized | [-] | 44.2 | 44.3 | 20.6 | 10.6 | 23.5 | 26.1 | 0.848 | 0.0121 | 0.316 | 0.911 | 0.653 | 0.442 |
Download Data |
Period Mean (original grids) [Watt m-2] |
Model Period Mean (intersection) [Watt m-2] |
Benchmark Period Mean (intersection) [Watt m-2] |
Model Period Mean (complement) [Watt m-2] |
Benchmark Period Mean (complement) [Watt m-2] |
Bias [Watt m-2] |
RMSE [Watt m-2] |
Phase Shift [months] |
Bias Score [1] |
RMSE Score [1] |
Seasonal Cycle Score [1] |
Spatial Distribution Score [1] |
Overall Score [1] |
|||
|---|---|---|---|---|---|---|---|---|---|---|---|---|---|---|---|---|
| Benchmark | [-] | 30.8 | ||||||||||||||
| CLM5_GSWP3V1 | [-] | 34.7 | 34.7 | 31.1 | 10.8 | 3.22 | 6.75 | 0.796 | 0.588 | 0.691 | 0.895 | 0.994 | 0.772 | |||
| Control | [-] | 77.6 | 77.5 | 31.1 | 10.8 | 45.9 | 47.6 | 1.14 | 0.00 | 0.214 | 0.842 | 0.712 | 0.396 | |||
| Randomized | [-] | 77.3 | 77.3 | 31.1 | 10.8 | 45.6 | 47.5 | 1.12 | 0.00 | 0.204 | 0.842 | 0.729 | 0.396 |
Download Data |
Period Mean (original grids) [Watt m-2] |
Model Period Mean (intersection) [Watt m-2] |
Benchmark Period Mean (intersection) [Watt m-2] |
Model Period Mean (complement) [Watt m-2] |
Benchmark Period Mean (complement) [Watt m-2] |
Bias [Watt m-2] |
RMSE [Watt m-2] |
Phase Shift [months] |
Bias Score [1] |
RMSE Score [1] |
Seasonal Cycle Score [1] |
Spatial Distribution Score [1] |
Overall Score [1] |
|||
|---|---|---|---|---|---|---|---|---|---|---|---|---|---|---|---|---|
| Benchmark | [-] | 26.8 | ||||||||||||||
| CLM5_GSWP3V1 | [-] | 27.3 | 27.3 | 27.1 | 15.2 | 0.386 | 4.06 | 2.26 | 0.739 | 0.762 | 0.636 | 0.815 | 0.743 | |||
| Control | [-] | 57.1 | 57.2 | 27.1 | 15.2 | 30.6 | 31.5 | 2.50 | 0.00111 | 0.310 | 0.602 | 0.631 | 0.371 | |||
| Randomized | [-] | 58.0 | 58.0 | 27.1 | 15.2 | 31.4 | 32.4 | 2.57 | 0.000367 | 0.275 | 0.587 | 0.694 | 0.366 |
Download Data |
Period Mean (original grids) [Watt m-2] |
Model Period Mean (intersection) [Watt m-2] |
Benchmark Period Mean (intersection) [Watt m-2] |
Model Period Mean (complement) [Watt m-2] |
Benchmark Period Mean (complement) [Watt m-2] |
Bias [Watt m-2] |
RMSE [Watt m-2] |
Phase Shift [months] |
Bias Score [1] |
RMSE Score [1] |
Seasonal Cycle Score [1] |
Spatial Distribution Score [1] |
Overall Score [1] |
|||
|---|---|---|---|---|---|---|---|---|---|---|---|---|---|---|---|---|
| Benchmark | [-] | 29.5 | ||||||||||||||
| CLM5_GSWP3V1 | [-] | 31.8 | 31.8 | 29.9 | 14.5 | 1.89 | 5.59 | 1.06 | 0.700 | 0.664 | 0.858 | 0.811 | 0.739 | |||
| Control | [-] | 57.9 | 58.0 | 29.9 | 14.5 | 28.3 | 28.9 | 1.52 | 0.00 | 0.518 | 0.772 | 0.963 | 0.554 | |||
| Randomized | [-] | 58.3 | 58.4 | 29.9 | 14.5 | 28.8 | 29.4 | 1.38 | 7.96e-05 | 0.502 | 0.808 | 0.963 | 0.555 |
Download Data |
Period Mean (original grids) [Watt m-2] |
Model Period Mean (intersection) [Watt m-2] |
Benchmark Period Mean (intersection) [Watt m-2] |
Model Period Mean (complement) [Watt m-2] |
Benchmark Period Mean (complement) [Watt m-2] |
Bias [Watt m-2] |
RMSE [Watt m-2] |
Phase Shift [months] |
Bias Score [1] |
RMSE Score [1] |
Seasonal Cycle Score [1] |
Spatial Distribution Score [1] |
Overall Score [1] |
|||
|---|---|---|---|---|---|---|---|---|---|---|---|---|---|---|---|---|
| Benchmark | [-] | 28.0 | ||||||||||||||
| CLM5_GSWP3V1 | [-] | 33.5 | 33.4 | 29.7 | 12.6 | 3.30 | 9.39 | 0.750 | 0.477 | 0.724 | 0.917 | 0.933 | 0.755 | |||
| Control | [-] | 70.2 | 70.1 | 29.7 | 12.6 | 38.5 | 40.1 | 1.68 | 0.00324 | 0.356 | 0.770 | 0.763 | 0.450 | |||
| Randomized | [-] | 70.5 | 70.6 | 29.7 | 12.6 | 38.8 | 40.5 | 1.59 | 0.00309 | 0.347 | 0.783 | 0.776 | 0.451 |
Temporally integrated period mean