Mean State
Download Data |
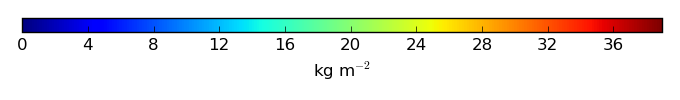
Period Mean (original grids) [Pg] |
Model Period Mean (intersection) [Pg] |
Model Period Mean (complement) [Pg] |
Benchmark Period Mean (intersection) [Pg] |
Benchmark Period Mean (complement) [Pg] |
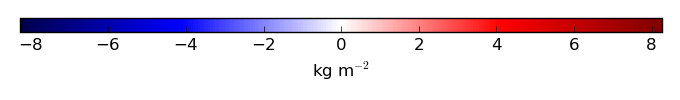
Bias [kg m-2] |
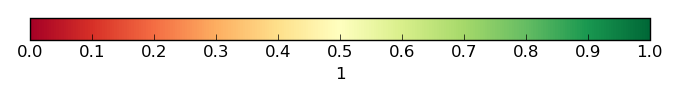
Bias Score [1] |
Spatial Distribution Score [1] |
Overall Score [1] |
|||
|---|---|---|---|---|---|---|---|---|---|---|---|---|
| Benchmark | [-] | 6.34 | ||||||||||
| CLM4 | [-] | 4.45 | 3.97 | 0.385 | 6.34 | 0.191 | -0.0931 | 0.55 | 0.78 | 0.66 | ||
| CLM4.5 | [-] | 5.22 | 4.61 | 0.498 | 6.34 | 0.191 | 0.0491 | 0.55 | 0.80 | 0.67 | ||
| CLM5 | [-] | 8.25 | 7.39 | 0.731 | 6.34 | 0.191 | 0.499 | 0.59 | 0.83 | 0.71 |
Download Data |
Period Mean (original grids) [Pg] |
Model Period Mean (intersection) [Pg] |
Model Period Mean (complement) [Pg] |
Benchmark Period Mean (intersection) [Pg] |
Benchmark Period Mean (complement) [Pg] |
Bias [kg m-2] |
Bias Score [1] |
Spatial Distribution Score [1] |
Overall Score [1] |
|||
|---|---|---|---|---|---|---|---|---|---|---|---|---|
| Benchmark | [-] | 36.8 | ||||||||||
| CLM4 | [-] | 27.3 | 27.3 | 0.0667 | 37.9 | 0.0273 | -0.863 | 0.54 | 0.82 | 0.68 | ||
| CLM4.5 | [-] | 36.6 | 36.5 | 0.104 | 37.9 | 0.0273 | -0.0876 | 0.55 | 0.81 | 0.68 | ||
| CLM5 | [-] | 68.0 | 67.8 | 0.253 | 37.9 | 0.0273 | 2.60 | 0.49 | 0.52 | 0.50 |
Download Data |
Period Mean (original grids) [Pg] |
Model Period Mean (intersection) [Pg] |
Model Period Mean (complement) [Pg] |
Benchmark Period Mean (intersection) [Pg] |
Benchmark Period Mean (complement) [Pg] |
Bias [kg m-2] |
Bias Score [1] |
Spatial Distribution Score [1] |
Overall Score [1] |
|||
|---|---|---|---|---|---|---|---|---|---|---|---|---|
| Benchmark | [-] | 19.1 | ||||||||||
| CLM4 | [-] | 17.6 | 17.6 | 0.0609 | 19.0 | 0.240 | -0.0530 | 0.58 | 0.84 | 0.71 | ||
| CLM4.5 | [-] | 29.0 | 29.0 | 0.183 | 19.0 | 0.240 | 1.18 | 0.56 | 0.86 | 0.71 | ||
| CLM5 | [-] | 54.2 | 54.1 | 0.371 | 19.0 | 0.240 | 3.94 | 0.31 | 0.48 | 0.39 |
Download Data |
Period Mean (original grids) [Pg] |
Model Period Mean (intersection) [Pg] |
Model Period Mean (complement) [Pg] |
Benchmark Period Mean (intersection) [Pg] |
Benchmark Period Mean (complement) [Pg] |
Bias [kg m-2] |
Bias Score [1] |
Spatial Distribution Score [1] |
Overall Score [1] |
|||
|---|---|---|---|---|---|---|---|---|---|---|---|---|
| Benchmark | [-] | 7.57 | ||||||||||
| CLM4 | [-] | 4.03 | 3.46 | 0.263 | 7.28 | 0.0545 | -0.862 | 0.49 | 0.70 | 0.60 | ||
| CLM4.5 | [-] | 9.76 | 9.07 | 0.437 | 7.28 | 0.0545 | 1.48 | 0.46 | 0.46 | 0.46 | ||
| CLM5 | [-] | 10.2 | 9.47 | 0.496 | 7.28 | 0.0545 | 1.74 | 0.53 | 0.56 | 0.54 |
Download Data |
Period Mean (original grids) [Pg] |
Model Period Mean (intersection) [Pg] |
Model Period Mean (complement) [Pg] |
Benchmark Period Mean (intersection) [Pg] |
Benchmark Period Mean (complement) [Pg] |
Bias [kg m-2] |
Bias Score [1] |
Spatial Distribution Score [1] |
Overall Score [1] |
|||
|---|---|---|---|---|---|---|---|---|---|---|---|---|
| Benchmark | [-] | 34.1 | ||||||||||
| CLM4 | [-] | 36.7 | 35.5 | 0.910 | 33.6 | 0.103 | 0.390 | 0.56 | 0.76 | 0.66 | ||
| CLM4.5 | [-] | 35.6 | 34.4 | 0.931 | 33.6 | 0.103 | 0.317 | 0.52 | 0.76 | 0.64 | ||
| CLM5 | [-] | 37.8 | 36.3 | 1.08 | 33.6 | 0.103 | 0.429 | 0.54 | 0.78 | 0.66 |
Download Data |
Period Mean (original grids) [Pg] |
Model Period Mean (intersection) [Pg] |
Model Period Mean (complement) [Pg] |
Benchmark Period Mean (intersection) [Pg] |
Benchmark Period Mean (complement) [Pg] |
Bias [kg m-2] |
Bias Score [1] |
Spatial Distribution Score [1] |
Overall Score [1] |
|||
|---|---|---|---|---|---|---|---|---|---|---|---|---|
| Benchmark | [-] | 28.1 | ||||||||||
| CLM4 | [-] | 79.5 | 75.3 | 3.23 | 26.7 | 1.53 | 21.2 | 0.19 | 0.51 | 0.35 | ||
| CLM4.5 | [-] | 67.6 | 63.7 | 2.91 | 26.7 | 1.53 | 17.3 | 0.27 | 0.76 | 0.52 | ||
| CLM5 | [-] | 49.8 | 46.9 | 2.23 | 26.7 | 1.53 | 11.2 | 0.46 | 0.90 | 0.68 |
Download Data |
Period Mean (original grids) [Pg] |
Model Period Mean (intersection) [Pg] |
Model Period Mean (complement) [Pg] |
Benchmark Period Mean (intersection) [Pg] |
Benchmark Period Mean (complement) [Pg] |
Bias [kg m-2] |
Bias Score [1] |
Spatial Distribution Score [1] |
Overall Score [1] |
|||
|---|---|---|---|---|---|---|---|---|---|---|---|---|
| Benchmark | [-] | 13.6 | ||||||||||
| CLM4 | [-] | 10.3 | 10.0 | 0.235 | 13.5 | 0.0773 | -0.216 | 0.58 | 0.82 | 0.70 | ||
| CLM4.5 | [-] | 17.7 | 17.1 | 0.403 | 13.5 | 0.0773 | 1.00 | 0.60 | 0.74 | 0.67 | ||
| CLM5 | [-] | 30.4 | 29.4 | 0.754 | 13.5 | 0.0773 | 3.29 | 0.43 | 0.26 | 0.35 |
Download Data |
Period Mean (original grids) [Pg] |
Model Period Mean (intersection) [Pg] |
Model Period Mean (complement) [Pg] |
Benchmark Period Mean (intersection) [Pg] |
Benchmark Period Mean (complement) [Pg] |
Bias [kg m-2] |
Bias Score [1] |
Spatial Distribution Score [1] |
Overall Score [1] |
|||
|---|---|---|---|---|---|---|---|---|---|---|---|---|
| Benchmark | [-] | 368. | ||||||||||
| CLM4 | [-] | 582. | 573. | 9.02 | 363. | 4.64 | 2.29 | 0.46 | 0.49 | 0.48 | ||
| CLM4.5 | [-] | 560. | 550. | 9.81 | 363. | 4.64 | 2.12 | 0.45 | 0.58 | 0.51 | ||
| CLM5 | [-] | 589. | 578. | 11.2 | 363. | 4.64 | 2.37 | 0.51 | 0.68 | 0.60 |
Download Data |
Period Mean (original grids) [Pg] |
Model Period Mean (intersection) [Pg] |
Model Period Mean (complement) [Pg] |
Benchmark Period Mean (intersection) [Pg] |
Benchmark Period Mean (complement) [Pg] |
Bias [kg m-2] |
Bias Score [1] |
Spatial Distribution Score [1] |
Overall Score [1] |
|||
|---|---|---|---|---|---|---|---|---|---|---|---|---|
| Benchmark | [-] | 1.17 | ||||||||||
| CLM4 | [-] | 1.46 | 1.34 | 0.116 | 1.14 | 0.0276 | 0.117 | 0.57 | 0.84 | 0.71 | ||
| CLM4.5 | [-] | 1.89 | 1.63 | 0.247 | 1.14 | 0.0276 | 0.238 | 0.54 | 0.73 | 0.63 | ||
| CLM5 | [-] | 1.86 | 1.51 | 0.341 | 1.14 | 0.0276 | 0.219 | 0.50 | 0.65 | 0.58 |
Download Data |
Period Mean (original grids) [Pg] |
Model Period Mean (intersection) [Pg] |
Model Period Mean (complement) [Pg] |
Benchmark Period Mean (intersection) [Pg] |
Benchmark Period Mean (complement) [Pg] |
Bias [kg m-2] |
Bias Score [1] |
Spatial Distribution Score [1] |
Overall Score [1] |
|||
|---|---|---|---|---|---|---|---|---|---|---|---|---|
| Benchmark | [-] | 26.7 | ||||||||||
| CLM4 | [-] | 41.8 | 37.9 | 0.286 | 26.6 | 0.0438 | 1.39 | 0.52 | 0.65 | 0.59 | ||
| CLM4.5 | [-] | 36.9 | 32.5 | 0.406 | 26.6 | 0.0438 | 0.802 | 0.41 | 0.55 | 0.48 | ||
| CLM5 | [-] | 29.2 | 26.1 | 0.472 | 26.6 | 0.0438 | 0.0763 | 0.60 | 0.84 | 0.72 |
Download Data |
Period Mean (original grids) [Pg] |
Model Period Mean (intersection) [Pg] |
Model Period Mean (complement) [Pg] |
Benchmark Period Mean (intersection) [Pg] |
Benchmark Period Mean (complement) [Pg] |
Bias [kg m-2] |
Bias Score [1] |
Spatial Distribution Score [1] |
Overall Score [1] |
|||
|---|---|---|---|---|---|---|---|---|---|---|---|---|
| Benchmark | [-] | 28.3 | ||||||||||
| CLM4 | [-] | 67.5 | 60.2 | 0.521 | 28.2 | 0.0700 | 11.9 | 0.39 | 0.51 | 0.45 | ||
| CLM4.5 | [-] | 60.5 | 54.2 | 0.585 | 28.2 | 0.0700 | 9.96 | 0.40 | 0.60 | 0.50 | ||
| CLM5 | [-] | 51.3 | 46.5 | 0.541 | 28.2 | 0.0700 | 7.29 | 0.58 | 0.90 | 0.74 |
Download Data |
Period Mean (original grids) [Pg] |
Model Period Mean (intersection) [Pg] |
Model Period Mean (complement) [Pg] |
Benchmark Period Mean (intersection) [Pg] |
Benchmark Period Mean (complement) [Pg] |
Bias [kg m-2] |
Bias Score [1] |
Spatial Distribution Score [1] |
Overall Score [1] |
|||
|---|---|---|---|---|---|---|---|---|---|---|---|---|
| Benchmark | [-] | 31.5 | ||||||||||
| CLM4 | [-] | 45.8 | 45.6 | 0.599 | 30.5 | 0.349 | 2.52 | 0.54 | 0.74 | 0.64 | ||
| CLM4.5 | [-] | 39.5 | 39.1 | 0.702 | 30.5 | 0.349 | 1.82 | 0.46 | 0.64 | 0.55 | ||
| CLM5 | [-] | 35.1 | 34.5 | 0.777 | 30.5 | 0.349 | 1.20 | 0.53 | 0.79 | 0.66 |
Download Data |
Period Mean (original grids) [Pg] |
Model Period Mean (intersection) [Pg] |
Model Period Mean (complement) [Pg] |
Benchmark Period Mean (intersection) [Pg] |
Benchmark Period Mean (complement) [Pg] |
Bias [kg m-2] |
Bias Score [1] |
Spatial Distribution Score [1] |
Overall Score [1] |
|||
|---|---|---|---|---|---|---|---|---|---|---|---|---|
| Benchmark | [-] | 23.7 | ||||||||||
| CLM4 | [-] | 34.9 | 38.3 | 0.106 | 23.7 | 0.0475 | 1.52 | 0.48 | 0.61 | 0.54 | ||
| CLM4.5 | [-] | 28.6 | 32.3 | 0.131 | 23.7 | 0.0475 | 0.909 | 0.43 | 0.58 | 0.50 | ||
| CLM5 | [-] | 31.5 | 33.8 | 0.295 | 23.7 | 0.0475 | 1.12 | 0.60 | 0.84 | 0.72 |
Download Data |
Period Mean (original grids) [Pg] |
Model Period Mean (intersection) [Pg] |
Model Period Mean (complement) [Pg] |
Benchmark Period Mean (intersection) [Pg] |
Benchmark Period Mean (complement) [Pg] |
Bias [kg m-2] |
Bias Score [1] |
Spatial Distribution Score [1] |
Overall Score [1] |
|||
|---|---|---|---|---|---|---|---|---|---|---|---|---|
| Benchmark | [-] | 72.3 | ||||||||||
| CLM4 | [-] | 166. | 172. | 0.337 | 72.2 | 0.0879 | 6.72 | 0.33 | 0.44 | 0.38 | ||
| CLM4.5 | [-] | 141. | 146. | 0.430 | 72.2 | 0.0879 | 5.06 | 0.39 | 0.58 | 0.48 | ||
| CLM5 | [-] | 128. | 132. | 0.623 | 72.2 | 0.0879 | 4.19 | 0.51 | 0.78 | 0.64 |
Download Data |
Period Mean (original grids) [Pg] |
Model Period Mean (intersection) [Pg] |
Model Period Mean (complement) [Pg] |
Benchmark Period Mean (intersection) [Pg] |
Benchmark Period Mean (complement) [Pg] |
Bias [kg m-2] |
Bias Score [1] |
Spatial Distribution Score [1] |
Overall Score [1] |
|||
|---|---|---|---|---|---|---|---|---|---|---|---|---|
| Benchmark | [-] | 27.3 | ||||||||||
| CLM4 | [-] | 31.1 | 30.6 | 0.248 | 27.4 | 0.0588 | 0.524 | 0.58 | 0.84 | 0.71 | ||
| CLM4.5 | [-] | 35.5 | 34.9 | 0.278 | 27.4 | 0.0588 | 1.01 | 0.52 | 0.77 | 0.65 | ||
| CLM5 | [-] | 35.4 | 34.7 | 0.307 | 27.4 | 0.0588 | 0.996 | 0.54 | 0.73 | 0.64 |
Temporally integrated period mean