Mean State
Download Data |
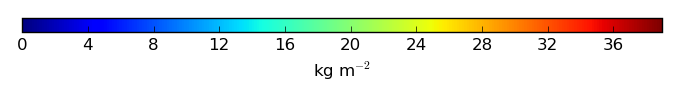
Period Mean (original grids) [Pg] |
Model Period Mean (intersection) [Pg] |
Model Period Mean (complement) [Pg] |
Benchmark Period Mean (intersection) [Pg] |
Benchmark Period Mean (complement) [Pg] |
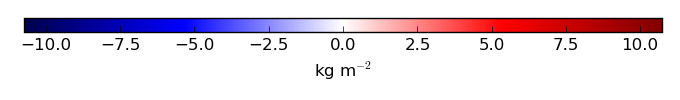
Bias [kg m-2] |
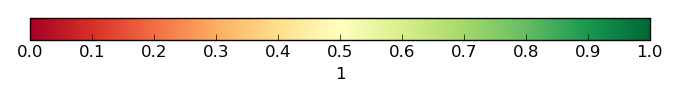
Bias Score [1] |
Spatial Distribution Score [1] |
Overall Score [1] |
|||
|---|---|---|---|---|---|---|---|---|---|---|---|---|
| Benchmark | [-] | 13.7 | ||||||||||
| CLM4 | [-] | 4.43 | 1.49 | 2.84 | 13.5 | 0.172 | -1.82 | 0.41 | 0.63 | 0.52 | ||
| CLM4.5 | [-] | 5.19 | 1.72 | 3.37 | 13.5 | 0.172 | -1.79 | 0.41 | 0.65 | 0.53 | ||
| CLM5 | [-] | 8.23 | 4.36 | 3.74 | 13.5 | 0.172 | -1.24 | 0.46 | 0.57 | 0.51 |
Download Data |
Period Mean (original grids) [Pg] |
Model Period Mean (intersection) [Pg] |
Model Period Mean (complement) [Pg] |
Benchmark Period Mean (intersection) [Pg] |
Benchmark Period Mean (complement) [Pg] |
Bias [kg m-2] |
Bias Score [1] |
Spatial Distribution Score [1] |
Overall Score [1] |
|||
|---|---|---|---|---|---|---|---|---|---|---|---|---|
| Benchmark | [-] | 10.3 | ||||||||||
| CLM4 | [-] | 4.03 | 3.43 | 0.292 | 9.93 | 0.106 | -1.77 | 0.48 | 0.73 | 0.60 | ||
| CLM4.5 | [-] | 9.75 | 9.03 | 0.466 | 9.93 | 0.106 | 0.567 | 0.52 | 0.66 | 0.59 | ||
| CLM5 | [-] | 10.2 | 9.43 | 0.529 | 9.93 | 0.106 | 0.818 | 0.59 | 0.76 | 0.67 |
Download Data |
Period Mean (original grids) [Pg] |
Model Period Mean (intersection) [Pg] |
Model Period Mean (complement) [Pg] |
Benchmark Period Mean (intersection) [Pg] |
Benchmark Period Mean (complement) [Pg] |
Bias [kg m-2] |
Bias Score [1] |
Spatial Distribution Score [1] |
Overall Score [1] |
|||
|---|---|---|---|---|---|---|---|---|---|---|---|---|
| Benchmark | [-] | 24.2 | ||||||||||
| CLM4 | [-] | 36.6 | 13.3 | 23.1 | 25.2 | 0.0842 | -1.27 | 0.45 | 0.38 | 0.42 | ||
| CLM4.5 | [-] | 35.6 | 12.9 | 22.3 | 25.2 | 0.0842 | -1.37 | 0.43 | 0.39 | 0.41 | ||
| CLM5 | [-] | 37.8 | 11.0 | 26.3 | 25.2 | 0.0842 | -1.68 | 0.46 | 0.48 | 0.47 |
Download Data |
Period Mean (original grids) [Pg] |
Model Period Mean (intersection) [Pg] |
Model Period Mean (complement) [Pg] |
Benchmark Period Mean (intersection) [Pg] |
Benchmark Period Mean (complement) [Pg] |
Bias [kg m-2] |
Bias Score [1] |
Spatial Distribution Score [1] |
Overall Score [1] |
|||
|---|---|---|---|---|---|---|---|---|---|---|---|---|
| Benchmark | [-] | 37.5 | ||||||||||
| CLM4 | [-] | 79.5 | 74.7 | 3.79 | 35.6 | 1.95 | 18.7 | 0.32 | 0.57 | 0.44 | ||
| CLM4.5 | [-] | 67.5 | 63.1 | 3.39 | 35.6 | 1.95 | 14.7 | 0.40 | 0.82 | 0.61 | ||
| CLM5 | [-] | 49.7 | 46.5 | 2.61 | 35.6 | 1.95 | 8.53 | 0.61 | 0.93 | 0.77 |
Download Data |
Period Mean (original grids) [Pg] |
Model Period Mean (intersection) [Pg] |
Model Period Mean (complement) [Pg] |
Benchmark Period Mean (intersection) [Pg] |
Benchmark Period Mean (complement) [Pg] |
Bias [kg m-2] |
Bias Score [1] |
Spatial Distribution Score [1] |
Overall Score [1] |
|||
|---|---|---|---|---|---|---|---|---|---|---|---|---|
| Benchmark | [-] | 352. | ||||||||||
| CLM4 | [-] | 582. | 459. | 123. | 348. | 3.81 | 2.37 | 0.47 | 0.48 | 0.48 | ||
| CLM4.5 | [-] | 559. | 404. | 156. | 348. | 3.81 | 1.57 | 0.46 | 0.57 | 0.51 | ||
| CLM5 | [-] | 589. | 355. | 233. | 348. | 3.81 | 0.826 | 0.59 | 0.77 | 0.68 |
Download Data |
Period Mean (original grids) [Pg] |
Model Period Mean (intersection) [Pg] |
Model Period Mean (complement) [Pg] |
Benchmark Period Mean (intersection) [Pg] |
Benchmark Period Mean (complement) [Pg] |
Bias [kg m-2] |
Bias Score [1] |
Spatial Distribution Score [1] |
Overall Score [1] |
|||
|---|---|---|---|---|---|---|---|---|---|---|---|---|
| Benchmark | [-] | 0.216 | ||||||||||
| CLM4 | [-] | 1.46 | 0.00875 | 1.44 | 0.215 | 0.000273 | -0.437 | 0.38 | 0.0062 | 0.19 | ||
| CLM4.5 | [-] | 1.89 | 0.0235 | 1.85 | 0.215 | 0.000273 | -0.405 | 0.39 | 0.058 | 0.22 | ||
| CLM5 | [-] | 1.86 | 0.0260 | 1.82 | 0.215 | 0.000273 | -0.400 | 0.39 | 0.053 | 0.22 |
Download Data |
Period Mean (original grids) [Pg] |
Model Period Mean (intersection) [Pg] |
Model Period Mean (complement) [Pg] |
Benchmark Period Mean (intersection) [Pg] |
Benchmark Period Mean (complement) [Pg] |
Bias [kg m-2] |
Bias Score [1] |
Spatial Distribution Score [1] |
Overall Score [1] |
|||
|---|---|---|---|---|---|---|---|---|---|---|---|---|
| Benchmark | [-] | 34.3 | ||||||||||
| CLM4 | [-] | 41.8 | 38.0 | 0.222 | 34.3 | 0.0601 | 0.461 | 0.55 | 0.73 | 0.64 | ||
| CLM4.5 | [-] | 36.9 | 32.6 | 0.274 | 34.3 | 0.0601 | -0.0322 | 0.44 | 0.63 | 0.54 | ||
| CLM5 | [-] | 29.2 | 26.3 | 0.282 | 34.3 | 0.0601 | -0.644 | 0.61 | 0.90 | 0.75 |
Download Data |
Period Mean (original grids) [Pg] |
Model Period Mean (intersection) [Pg] |
Model Period Mean (complement) [Pg] |
Benchmark Period Mean (intersection) [Pg] |
Benchmark Period Mean (complement) [Pg] |
Bias [kg m-2] |
Bias Score [1] |
Spatial Distribution Score [1] |
Overall Score [1] |
|||
|---|---|---|---|---|---|---|---|---|---|---|---|---|
| Benchmark | [-] | 30.6 | ||||||||||
| CLM4 | [-] | 67.4 | 60.1 | 0.539 | 30.5 | 0.0685 | 11.1 | 0.38 | 0.46 | 0.42 | ||
| CLM4.5 | [-] | 60.4 | 54.1 | 0.608 | 30.5 | 0.0685 | 9.13 | 0.40 | 0.55 | 0.47 | ||
| CLM5 | [-] | 51.2 | 46.4 | 0.565 | 30.5 | 0.0685 | 6.46 | 0.59 | 0.87 | 0.73 |
Download Data |
Period Mean (original grids) [Pg] |
Model Period Mean (intersection) [Pg] |
Model Period Mean (complement) [Pg] |
Benchmark Period Mean (intersection) [Pg] |
Benchmark Period Mean (complement) [Pg] |
Bias [kg m-2] |
Bias Score [1] |
Spatial Distribution Score [1] |
Overall Score [1] |
|||
|---|---|---|---|---|---|---|---|---|---|---|---|---|
| Benchmark | [-] | 57.3 | ||||||||||
| CLM4 | [-] | 45.8 | 45.5 | 0.694 | 55.7 | 0.502 | -0.620 | 0.65 | 0.84 | 0.74 | ||
| CLM4.5 | [-] | 39.5 | 39.0 | 0.793 | 55.7 | 0.502 | -1.31 | 0.54 | 0.74 | 0.64 | ||
| CLM5 | [-] | 35.1 | 34.4 | 0.874 | 55.7 | 0.502 | -1.92 | 0.61 | 0.88 | 0.74 |
Download Data |
Period Mean (original grids) [Pg] |
Model Period Mean (intersection) [Pg] |
Model Period Mean (complement) [Pg] |
Benchmark Period Mean (intersection) [Pg] |
Benchmark Period Mean (complement) [Pg] |
Bias [kg m-2] |
Bias Score [1] |
Spatial Distribution Score [1] |
Overall Score [1] |
|||
|---|---|---|---|---|---|---|---|---|---|---|---|---|
| Benchmark | [-] | 38.4 | ||||||||||
| CLM4 | [-] | 34.9 | 38.3 | 0.0908 | 38.3 | 0.0792 | -0.00715 | 0.51 | 0.65 | 0.58 | ||
| CLM4.5 | [-] | 28.5 | 32.3 | 0.106 | 38.3 | 0.0792 | -0.602 | 0.45 | 0.61 | 0.53 | ||
| CLM5 | [-] | 31.4 | 33.8 | 0.257 | 38.3 | 0.0792 | -0.394 | 0.62 | 0.87 | 0.75 |
Download Data |
Period Mean (original grids) [Pg] |
Model Period Mean (intersection) [Pg] |
Model Period Mean (complement) [Pg] |
Benchmark Period Mean (intersection) [Pg] |
Benchmark Period Mean (complement) [Pg] |
Bias [kg m-2] |
Bias Score [1] |
Spatial Distribution Score [1] |
Overall Score [1] |
|||
|---|---|---|---|---|---|---|---|---|---|---|---|---|
| Benchmark | [-] | 95.5 | ||||||||||
| CLM4 | [-] | 166. | 172. | 0.375 | 95.3 | 0.198 | 5.20 | 0.43 | 0.45 | 0.44 | ||
| CLM4.5 | [-] | 141. | 146. | 0.485 | 95.3 | 0.198 | 3.52 | 0.47 | 0.59 | 0.53 | ||
| CLM5 | [-] | 128. | 132. | 0.703 | 95.3 | 0.198 | 2.66 | 0.60 | 0.79 | 0.70 |
Download Data |
Period Mean (original grids) [Pg] |
Model Period Mean (intersection) [Pg] |
Model Period Mean (complement) [Pg] |
Benchmark Period Mean (intersection) [Pg] |
Benchmark Period Mean (complement) [Pg] |
Bias [kg m-2] |
Bias Score [1] |
Spatial Distribution Score [1] |
Overall Score [1] |
|||
|---|---|---|---|---|---|---|---|---|---|---|---|---|
| Benchmark | [-] | 0.794 | ||||||||||
| CLM4 | [-] | 31.1 | 2.76 | 28.1 | 1.09 | 0.00 | 2.20 | 0.49 | 0.41 | 0.45 | ||
| CLM4.5 | [-] | 35.5 | 2.97 | 32.2 | 1.09 | 0.00 | 2.47 | 0.47 | 0.35 | 0.41 | ||
| CLM5 | [-] | 35.4 | 2.94 | 32.0 | 1.09 | 0.00 | 2.46 | 0.44 | 0.36 | 0.40 |
Temporally integrated period mean