Mean State
Download Data |
Period Mean (original grids) [Pg] |
Model Period Mean (intersection) [Pg] |
Model Period Mean (complement) [Pg] |
Benchmark Period Mean (intersection) [Pg] |
Benchmark Period Mean (complement) [Pg] |
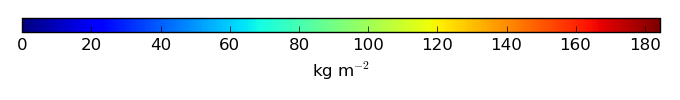
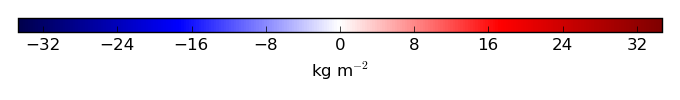
Bias [kg m-2] |
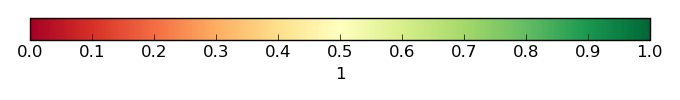
Bias Score [1] |
Spatial Distribution Score [1] |
Overall Score [1] |
|||
|---|---|---|---|---|---|---|---|---|---|---|---|---|
| Benchmark | [-] | 54.1 | ||||||||||
| CLM4 | [-] | 13.1 | 12.5 | 0.542 | 52.7 | 1.53 | -4.65 | 0.49 | 0.69 | 0.59 | ||
| CLM4.5 | [-] | 21.7 | 20.3 | 1.25 | 52.7 | 1.53 | -3.47 | 0.55 | 0.49 | 0.52 | ||
| CLM5 | [-] | 25.4 | 23.5 | 1.75 | 52.7 | 1.53 | -2.90 | 0.53 | 0.24 | 0.39 |
Download Data |
Period Mean (original grids) [Pg] |
Model Period Mean (intersection) [Pg] |
Model Period Mean (complement) [Pg] |
Benchmark Period Mean (intersection) [Pg] |
Benchmark Period Mean (complement) [Pg] |
Bias [kg m-2] |
Bias Score [1] |
Spatial Distribution Score [1] |
Overall Score [1] |
|||
|---|---|---|---|---|---|---|---|---|---|---|---|---|
| Benchmark | [-] | 182. | ||||||||||
| CLM4 | [-] | 70.7 | 70.4 | 0.272 | 184. | 1.33 | -9.50 | 0.54 | 0.60 | 0.57 | ||
| CLM4.5 | [-] | 252. | 248. | 1.22 | 184. | 1.33 | 5.67 | 0.57 | 0.51 | 0.54 | ||
| CLM5 | [-] | 630. | 620. | 1.59 | 184. | 1.33 | 37.0 | 0.40 | 0.065 | 0.23 |
Download Data |
Period Mean (original grids) [Pg] |
Model Period Mean (intersection) [Pg] |
Model Period Mean (complement) [Pg] |
Benchmark Period Mean (intersection) [Pg] |
Benchmark Period Mean (complement) [Pg] |
Bias [kg m-2] |
Bias Score [1] |
Spatial Distribution Score [1] |
Overall Score [1] |
|||
|---|---|---|---|---|---|---|---|---|---|---|---|---|
| Benchmark | [-] | 158. | ||||||||||
| CLM4 | [-] | 52.0 | 51.8 | 0.297 | 154. | 4.54 | -9.10 | 0.50 | 0.38 | 0.44 | ||
| CLM4.5 | [-] | 182. | 180. | 1.96 | 154. | 4.54 | 3.46 | 0.53 | 0.62 | 0.57 | ||
| CLM5 | [-] | 449. | 446. | 3.28 | 154. | 4.54 | 28.4 | 0.41 | 0.10 | 0.26 |
Download Data |
Period Mean (original grids) [Pg] |
Model Period Mean (intersection) [Pg] |
Model Period Mean (complement) [Pg] |
Benchmark Period Mean (intersection) [Pg] |
Benchmark Period Mean (complement) [Pg] |
Bias [kg m-2] |
Bias Score [1] |
Spatial Distribution Score [1] |
Overall Score [1] |
|||
|---|---|---|---|---|---|---|---|---|---|---|---|---|
| Benchmark | [-] | 42.0 | ||||||||||
| CLM4 | [-] | 7.49 | 7.06 | 0.365 | 37.8 | 2.79 | -9.55 | 0.47 | 0.25 | 0.36 | ||
| CLM4.5 | [-] | 19.5 | 18.3 | 1.11 | 37.8 | 2.79 | -4.53 | 0.58 | 0.78 | 0.68 | ||
| CLM5 | [-] | 19.3 | 18.1 | 1.19 | 37.8 | 2.79 | -4.65 | 0.59 | 0.82 | 0.71 |
Download Data |
Period Mean (original grids) [Pg] |
Model Period Mean (intersection) [Pg] |
Model Period Mean (complement) [Pg] |
Benchmark Period Mean (intersection) [Pg] |
Benchmark Period Mean (complement) [Pg] |
Bias [kg m-2] |
Bias Score [1] |
Spatial Distribution Score [1] |
Overall Score [1] |
|||
|---|---|---|---|---|---|---|---|---|---|---|---|---|
| Benchmark | [-] | 178. | ||||||||||
| CLM4 | [-] | 90.7 | 89.7 | 0.777 | 174. | 2.57 | -3.63 | 0.57 | 0.88 | 0.72 | ||
| CLM4.5 | [-] | 140. | 138. | 1.21 | 174. | 2.57 | -1.29 | 0.59 | 0.70 | 0.64 | ||
| CLM5 | [-] | 174. | 172. | 1.20 | 174. | 2.57 | 0.268 | 0.60 | 0.46 | 0.53 |
Download Data |
Period Mean (original grids) [Pg] |
Model Period Mean (intersection) [Pg] |
Model Period Mean (complement) [Pg] |
Benchmark Period Mean (intersection) [Pg] |
Benchmark Period Mean (complement) [Pg] |
Bias [kg m-2] |
Bias Score [1] |
Spatial Distribution Score [1] |
Overall Score [1] |
|||
|---|---|---|---|---|---|---|---|---|---|---|---|---|
| Benchmark | [-] | 61.4 | ||||||||||
| CLM4 | [-] | 25.3 | 23.4 | 1.46 | 52.4 | 9.26 | -5.00 | 0.68 | 0.21 | 0.44 | ||
| CLM4.5 | [-] | 30.4 | 27.7 | 2.12 | 52.4 | 9.26 | -2.59 | 0.69 | 0.37 | 0.53 | ||
| CLM5 | [-] | 26.3 | 23.9 | 1.97 | 52.4 | 9.26 | -3.91 | 0.69 | 0.31 | 0.50 |
Download Data |
Period Mean (original grids) [Pg] |
Model Period Mean (intersection) [Pg] |
Model Period Mean (complement) [Pg] |
Benchmark Period Mean (intersection) [Pg] |
Benchmark Period Mean (complement) [Pg] |
Bias [kg m-2] |
Bias Score [1] |
Spatial Distribution Score [1] |
Overall Score [1] |
|||
|---|---|---|---|---|---|---|---|---|---|---|---|---|
| Benchmark | [-] | 79.0 | ||||||||||
| CLM4 | [-] | 29.7 | 28.9 | 0.577 | 75.7 | 3.35 | -6.29 | 0.58 | 0.42 | 0.50 | ||
| CLM4.5 | [-] | 67.0 | 64.8 | 1.26 | 75.7 | 3.35 | -0.226 | 0.68 | 0.80 | 0.74 | ||
| CLM5 | [-] | 79.5 | 76.6 | 1.57 | 75.7 | 3.35 | 1.96 | 0.71 | 0.95 | 0.83 |
Download Data |
Period Mean (original grids) [Pg] |
Model Period Mean (intersection) [Pg] |
Model Period Mean (complement) [Pg] |
Benchmark Period Mean (intersection) [Pg] |
Benchmark Period Mean (complement) [Pg] |
Bias [kg m-2] |
Bias Score [1] |
Spatial Distribution Score [1] |
Overall Score [1] |
|||
|---|---|---|---|---|---|---|---|---|---|---|---|---|
| Benchmark | [-] | 1.38e+03 | ||||||||||
| CLM4 | [-] | 614. | 606. | 8.38 | 1.32e+03 | 56.4 | -4.71 | 0.58 | 0.62 | 0.60 | ||
| CLM4.5 | [-] | 1.27e+03 | 1.15e+03 | 121. | 1.32e+03 | 56.4 | -0.424 | 0.59 | 0.54 | 0.57 | ||
| CLM5 | [-] | 1.92e+03 | 1.90e+03 | 22.7 | 1.32e+03 | 56.4 | 5.01 | 0.56 | 0.10 | 0.33 |
Download Data |
Period Mean (original grids) [Pg] |
Model Period Mean (intersection) [Pg] |
Model Period Mean (complement) [Pg] |
Benchmark Period Mean (intersection) [Pg] |
Benchmark Period Mean (complement) [Pg] |
Bias [kg m-2] |
Bias Score [1] |
Spatial Distribution Score [1] |
Overall Score [1] |
|||
|---|---|---|---|---|---|---|---|---|---|---|---|---|
| Benchmark | [-] | 53.5 | ||||||||||
| CLM4 | [-] | 6.19 | 5.97 | 0.174 | 51.8 | 1.67 | -3.66 | 0.43 | 0.69 | 0.56 | ||
| CLM4.5 | [-] | 13.6 | 13.0 | 0.505 | 51.8 | 1.67 | -2.93 | 0.50 | 0.77 | 0.64 | ||
| CLM5 | [-] | 19.5 | 18.7 | 0.629 | 51.8 | 1.67 | -2.40 | 0.53 | 0.69 | 0.61 |
Download Data |
Period Mean (original grids) [Pg] |
Model Period Mean (intersection) [Pg] |
Model Period Mean (complement) [Pg] |
Benchmark Period Mean (intersection) [Pg] |
Benchmark Period Mean (complement) [Pg] |
Bias [kg m-2] |
Bias Score [1] |
Spatial Distribution Score [1] |
Overall Score [1] |
|||
|---|---|---|---|---|---|---|---|---|---|---|---|---|
| Benchmark | [-] | 76.8 | ||||||||||
| CLM4 | [-] | 42.7 | 40.7 | 0.176 | 75.9 | 0.930 | -2.66 | 0.59 | 0.86 | 0.73 | ||
| CLM4.5 | [-] | 44.0 | 41.5 | 0.377 | 75.9 | 0.930 | -2.51 | 0.53 | 0.75 | 0.64 | ||
| CLM5 | [-] | 47.2 | 44.7 | 0.348 | 75.9 | 0.930 | -2.28 | 0.53 | 0.70 | 0.61 |
Download Data |
Period Mean (original grids) [Pg] |
Model Period Mean (intersection) [Pg] |
Model Period Mean (complement) [Pg] |
Benchmark Period Mean (intersection) [Pg] |
Benchmark Period Mean (complement) [Pg] |
Bias [kg m-2] |
Bias Score [1] |
Spatial Distribution Score [1] |
Overall Score [1] |
|||
|---|---|---|---|---|---|---|---|---|---|---|---|---|
| Benchmark | [-] | 42.9 | ||||||||||
| CLM4 | [-] | 28.0 | 25.7 | 0.232 | 41.8 | 1.07 | -4.57 | 0.65 | 0.30 | 0.48 | ||
| CLM4.5 | [-] | 36.5 | 33.7 | 0.492 | 41.8 | 1.07 | -1.26 | 0.66 | 0.55 | 0.60 | ||
| CLM5 | [-] | 35.8 | 33.3 | 0.484 | 41.8 | 1.07 | -1.46 | 0.68 | 0.45 | 0.57 |
Download Data |
Period Mean (original grids) [Pg] |
Model Period Mean (intersection) [Pg] |
Model Period Mean (complement) [Pg] |
Benchmark Period Mean (intersection) [Pg] |
Benchmark Period Mean (complement) [Pg] |
Bias [kg m-2] |
Bias Score [1] |
Spatial Distribution Score [1] |
Overall Score [1] |
|||
|---|---|---|---|---|---|---|---|---|---|---|---|---|
| Benchmark | [-] | 76.0 | ||||||||||
| CLM4 | [-] | 56.8 | 56.2 | 0.711 | 71.7 | 2.73 | -1.31 | 0.69 | 0.74 | 0.71 | ||
| CLM4.5 | [-] | 66.6 | 65.3 | 1.43 | 71.7 | 2.73 | 0.184 | 0.65 | 0.64 | 0.64 | ||
| CLM5 | [-] | 49.5 | 48.3 | 1.27 | 71.7 | 2.73 | -1.97 | 0.67 | 0.80 | 0.73 |
Download Data |
Period Mean (original grids) [Pg] |
Model Period Mean (intersection) [Pg] |
Model Period Mean (complement) [Pg] |
Benchmark Period Mean (intersection) [Pg] |
Benchmark Period Mean (complement) [Pg] |
Bias [kg m-2] |
Bias Score [1] |
Spatial Distribution Score [1] |
Overall Score [1] |
|||
|---|---|---|---|---|---|---|---|---|---|---|---|---|
| Benchmark | [-] | 65.1 | ||||||||||
| CLM4 | [-] | 35.8 | 37.2 | 0.302 | 64.3 | 0.830 | -2.62 | 0.57 | 0.88 | 0.72 | ||
| CLM4.5 | [-] | 42.9 | 44.0 | 0.870 | 64.3 | 0.830 | -1.76 | 0.62 | 0.90 | 0.76 | ||
| CLM5 | [-] | 46.8 | 47.9 | 0.900 | 64.3 | 0.830 | -1.34 | 0.59 | 0.80 | 0.70 |
Download Data |
Period Mean (original grids) [Pg] |
Model Period Mean (intersection) [Pg] |
Model Period Mean (complement) [Pg] |
Benchmark Period Mean (intersection) [Pg] |
Benchmark Period Mean (complement) [Pg] |
Bias [kg m-2] |
Bias Score [1] |
Spatial Distribution Score [1] |
Overall Score [1] |
|||
|---|---|---|---|---|---|---|---|---|---|---|---|---|
| Benchmark | [-] | 151. | ||||||||||
| CLM4 | [-] | 93.7 | 95.1 | 0.493 | 148. | 3.09 | -3.14 | 0.68 | 0.67 | 0.68 | ||
| CLM4.5 | [-] | 114. | 115. | 0.923 | 148. | 3.09 | -1.61 | 0.67 | 0.83 | 0.75 | ||
| CLM5 | [-] | 132. | 132. | 1.18 | 148. | 3.09 | -0.412 | 0.68 | 0.87 | 0.77 |
Download Data |
Period Mean (original grids) [Pg] |
Model Period Mean (intersection) [Pg] |
Model Period Mean (complement) [Pg] |
Benchmark Period Mean (intersection) [Pg] |
Benchmark Period Mean (complement) [Pg] |
Bias [kg m-2] |
Bias Score [1] |
Spatial Distribution Score [1] |
Overall Score [1] |
|||
|---|---|---|---|---|---|---|---|---|---|---|---|---|
| Benchmark | [-] | 91.7 | ||||||||||
| CLM4 | [-] | 54.8 | 54.3 | 0.297 | 92.4 | 0.538 | -3.98 | 0.64 | 0.88 | 0.76 | ||
| CLM4.5 | [-] | 82.0 | 81.2 | 0.454 | 92.4 | 0.538 | -0.948 | 0.62 | 0.81 | 0.72 | ||
| CLM5 | [-] | 72.0 | 71.2 | 0.456 | 92.4 | 0.538 | -2.07 | 0.66 | 0.84 | 0.75 |
Temporally integrated period mean