Mean State
Download Data |
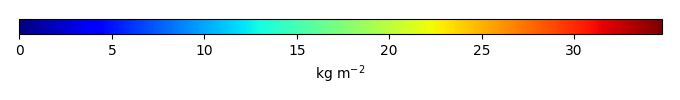
Period Mean (original grids) [Pg] |
Model Period Mean (intersection) [Pg] |
Model Period Mean (complement) [Pg] |
Benchmark Period Mean (intersection) [Pg] |
Benchmark Period Mean (complement) [Pg] |
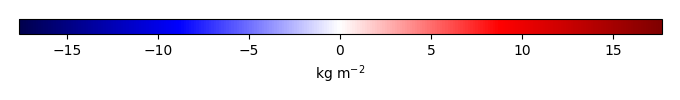
Bias [kg m-2] |
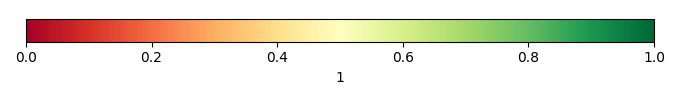
Bias Score [1] |
Spatial Distribution Score [1] |
Overall Score [1] |
|||
|---|---|---|---|---|---|---|---|---|---|---|---|---|
| Benchmark | [-] | 12.5 | ||||||||||
| CRUNCEPv7 | [-] | 8.54 | 6.70 | 1.71 | 12.6 | 0.398 | -0.742 | 0.56 | 0.73 | 0.64 | ||
| GSWP3v1 | [-] | 8.28 | 6.38 | 1.81 | 12.6 | 0.398 | -0.772 | 0.55 | 0.76 | 0.65 | ||
| WATCH | [-] | 9.29 | 7.33 | 1.85 | 12.6 | 0.398 | -0.546 | 0.56 | 0.79 | 0.68 |
Download Data |
Period Mean (original grids) [Pg] |
Model Period Mean (intersection) [Pg] |
Model Period Mean (complement) [Pg] |
Benchmark Period Mean (intersection) [Pg] |
Benchmark Period Mean (complement) [Pg] |
Bias [kg m-2] |
Bias Score [1] |
Spatial Distribution Score [1] |
Overall Score [1] |
|||
|---|---|---|---|---|---|---|---|---|---|---|---|---|
| Benchmark | [-] | 33.4 | ||||||||||
| CRUNCEPv7 | [-] | 68.1 | 65.9 | 2.17 | 34.3 | 0.00477 | 3.02 | 0.48 | 0.71 | 0.60 | ||
| GSWP3v1 | [-] | 48.5 | 46.6 | 1.80 | 34.3 | 0.00477 | 1.21 | 0.54 | 0.81 | 0.68 | ||
| WATCH | [-] | 45.2 | 43.9 | 1.24 | 34.3 | 0.00477 | 0.934 | 0.71 | 0.93 | 0.82 |
Download Data |
Period Mean (original grids) [Pg] |
Model Period Mean (intersection) [Pg] |
Model Period Mean (complement) [Pg] |
Benchmark Period Mean (intersection) [Pg] |
Benchmark Period Mean (complement) [Pg] |
Bias [kg m-2] |
Bias Score [1] |
Spatial Distribution Score [1] |
Overall Score [1] |
|||
|---|---|---|---|---|---|---|---|---|---|---|---|---|
| Benchmark | [-] | 17.1 | ||||||||||
| CRUNCEPv7 | [-] | 54.3 | 51.8 | 2.86 | 17.1 | 0.0944 | 5.34 | 0.37 | 0.60 | 0.48 | ||
| GSWP3v1 | [-] | 45.8 | 43.7 | 2.26 | 17.1 | 0.0944 | 4.09 | 0.40 | 0.69 | 0.54 | ||
| WATCH | [-] | 39.5 | 37.6 | 2.01 | 17.1 | 0.0944 | 3.15 | 0.48 | 0.78 | 0.63 |
Download Data |
Period Mean (original grids) [Pg] |
Model Period Mean (intersection) [Pg] |
Model Period Mean (complement) [Pg] |
Benchmark Period Mean (intersection) [Pg] |
Benchmark Period Mean (complement) [Pg] |
Bias [kg m-2] |
Bias Score [1] |
Spatial Distribution Score [1] |
Overall Score [1] |
|||
|---|---|---|---|---|---|---|---|---|---|---|---|---|
| Benchmark | [-] | 4.49 | ||||||||||
| CRUNCEPv7 | [-] | 10.2 | 9.25 | 0.775 | 4.32 | 0.0364 | 3.09 | 0.40 | 0.47 | 0.43 | ||
| GSWP3v1 | [-] | 8.56 | 7.68 | 0.679 | 4.32 | 0.0364 | 2.29 | 0.47 | 0.57 | 0.52 | ||
| WATCH | [-] | 9.34 | 8.51 | 0.701 | 4.32 | 0.0364 | 2.69 | 0.44 | 0.57 | 0.51 |
Download Data |
Period Mean (original grids) [Pg] |
Model Period Mean (intersection) [Pg] |
Model Period Mean (complement) [Pg] |
Benchmark Period Mean (intersection) [Pg] |
Benchmark Period Mean (complement) [Pg] |
Bias [kg m-2] |
Bias Score [1] |
Spatial Distribution Score [1] |
Overall Score [1] |
|||
|---|---|---|---|---|---|---|---|---|---|---|---|---|
| Benchmark | [-] | 21.9 | ||||||||||
| CRUNCEPv7 | [-] | 37.9 | 33.6 | 3.77 | 21.1 | 0.0586 | 1.74 | 0.51 | 0.68 | 0.59 | ||
| GSWP3v1 | [-] | 32.2 | 28.4 | 3.40 | 21.1 | 0.0586 | 1.11 | 0.55 | 0.76 | 0.65 | ||
| WATCH | [-] | 36.8 | 32.2 | 4.24 | 21.1 | 0.0586 | 1.47 | 0.61 | 0.84 | 0.73 |
Download Data |
Period Mean (original grids) [Pg] |
Model Period Mean (intersection) [Pg] |
Model Period Mean (complement) [Pg] |
Benchmark Period Mean (intersection) [Pg] |
Benchmark Period Mean (complement) [Pg] |
Bias [kg m-2] |
Bias Score [1] |
Spatial Distribution Score [1] |
Overall Score [1] |
|||
|---|---|---|---|---|---|---|---|---|---|---|---|---|
| Benchmark | [-] | 46.5 | ||||||||||
| CRUNCEPv7 | [-] | 50.0 | 46.7 | 2.61 | 44.5 | 2.11 | 6.25 | 0.71 | 0.66 | 0.68 | ||
| GSWP3v1 | [-] | 40.5 | 37.9 | 2.11 | 44.5 | 2.11 | 2.88 | 0.68 | 0.52 | 0.60 | ||
| WATCH | [-] | 39.3 | 36.7 | 2.16 | 44.5 | 2.11 | 2.53 | 0.66 | 0.43 | 0.54 |
Download Data |
Period Mean (original grids) [Pg] |
Model Period Mean (intersection) [Pg] |
Model Period Mean (complement) [Pg] |
Benchmark Period Mean (intersection) [Pg] |
Benchmark Period Mean (complement) [Pg] |
Bias [kg m-2] |
Bias Score [1] |
Spatial Distribution Score [1] |
Overall Score [1] |
|||
|---|---|---|---|---|---|---|---|---|---|---|---|---|
| Benchmark | [-] | 14.8 | ||||||||||
| CRUNCEPv7 | [-] | 30.4 | 28.7 | 1.41 | 14.8 | 0.0344 | 3.09 | 0.49 | 0.59 | 0.54 | ||
| GSWP3v1 | [-] | 20.7 | 19.4 | 1.08 | 14.8 | 0.0344 | 1.44 | 0.51 | 0.70 | 0.60 | ||
| WATCH | [-] | 15.5 | 14.3 | 1.01 | 14.8 | 0.0344 | 0.562 | 0.55 | 0.80 | 0.68 |
Download Data |
Period Mean (original grids) [Pg] |
Model Period Mean (intersection) [Pg] |
Model Period Mean (complement) [Pg] |
Benchmark Period Mean (intersection) [Pg] |
Benchmark Period Mean (complement) [Pg] |
Bias [kg m-2] |
Bias Score [1] |
Spatial Distribution Score [1] |
Overall Score [1] |
|||
|---|---|---|---|---|---|---|---|---|---|---|---|---|
| Benchmark | [-] | 455. | ||||||||||
| CRUNCEPv7 | [-] | 590. | 564. | 26.5 | 449. | 5.38 | 1.95 | 0.65 | 0.89 | 0.77 | ||
| GSWP3v1 | [-] | 487. | 464. | 23.3 | 449. | 5.38 | 0.776 | 0.64 | 0.86 | 0.75 | ||
| WATCH | [-] | 507. | 484. | 23.4 | 449. | 5.38 | 0.972 | 0.67 | 0.87 | 0.77 |
Download Data |
Period Mean (original grids) [Pg] |
Model Period Mean (intersection) [Pg] |
Model Period Mean (complement) [Pg] |
Benchmark Period Mean (intersection) [Pg] |
Benchmark Period Mean (complement) [Pg] |
Bias [kg m-2] |
Bias Score [1] |
Spatial Distribution Score [1] |
Overall Score [1] |
|||
|---|---|---|---|---|---|---|---|---|---|---|---|---|
| Benchmark | [-] | 0.650 | ||||||||||
| CRUNCEPv7 | [-] | 1.78 | 0.866 | 0.900 | 0.642 | 0.00776 | 0.365 | 0.48 | 0.67 | 0.58 | ||
| GSWP3v1 | [-] | 1.50 | 0.719 | 0.771 | 0.642 | 0.00776 | 0.297 | 0.47 | 0.66 | 0.56 | ||
| WATCH | [-] | 2.09 | 1.14 | 0.921 | 0.642 | 0.00776 | 0.581 | 0.44 | 0.56 | 0.50 |
Download Data |
Period Mean (original grids) [Pg] |
Model Period Mean (intersection) [Pg] |
Model Period Mean (complement) [Pg] |
Benchmark Period Mean (intersection) [Pg] |
Benchmark Period Mean (complement) [Pg] |
Bias [kg m-2] |
Bias Score [1] |
Spatial Distribution Score [1] |
Overall Score [1] |
|||
|---|---|---|---|---|---|---|---|---|---|---|---|---|
| Benchmark | [-] | 39.1 | ||||||||||
| CRUNCEPv7 | [-] | 29.3 | 25.4 | 1.23 | 39.1 | 0.0444 | -2.38 | 0.63 | 0.71 | 0.67 | ||
| GSWP3v1 | [-] | 27.1 | 23.5 | 1.23 | 39.1 | 0.0444 | -2.75 | 0.60 | 0.64 | 0.62 | ||
| WATCH | [-] | 30.1 | 26.3 | 1.40 | 39.1 | 0.0444 | -2.23 | 0.61 | 0.62 | 0.61 |
Download Data |
Period Mean (original grids) [Pg] |
Model Period Mean (intersection) [Pg] |
Model Period Mean (complement) [Pg] |
Benchmark Period Mean (intersection) [Pg] |
Benchmark Period Mean (complement) [Pg] |
Bias [kg m-2] |
Bias Score [1] |
Spatial Distribution Score [1] |
Overall Score [1] |
|||
|---|---|---|---|---|---|---|---|---|---|---|---|---|
| Benchmark | [-] | 44.8 | ||||||||||
| CRUNCEPv7 | [-] | 51.6 | 46.5 | 0.737 | 44.8 | 0.0416 | 1.88 | 0.74 | 0.80 | 0.77 | ||
| GSWP3v1 | [-] | 44.2 | 40.0 | 0.656 | 44.8 | 0.0416 | -0.388 | 0.71 | 0.69 | 0.70 | ||
| WATCH | [-] | 46.8 | 42.1 | 0.630 | 44.8 | 0.0416 | 0.246 | 0.75 | 0.77 | 0.76 |
Download Data |
Period Mean (original grids) [Pg] |
Model Period Mean (intersection) [Pg] |
Model Period Mean (complement) [Pg] |
Benchmark Period Mean (intersection) [Pg] |
Benchmark Period Mean (complement) [Pg] |
Bias [kg m-2] |
Bias Score [1] |
Spatial Distribution Score [1] |
Overall Score [1] |
|||
|---|---|---|---|---|---|---|---|---|---|---|---|---|
| Benchmark | [-] | 17.6 | ||||||||||
| CRUNCEPv7 | [-] | 35.3 | 33.7 | 1.82 | 17.1 | 0.363 | 2.96 | 0.49 | 0.69 | 0.59 | ||
| GSWP3v1 | [-] | 33.6 | 32.1 | 1.70 | 17.1 | 0.363 | 2.65 | 0.49 | 0.74 | 0.62 | ||
| WATCH | [-] | 33.5 | 31.8 | 1.80 | 17.1 | 0.363 | 2.63 | 0.51 | 0.79 | 0.65 |
Download Data |
Period Mean (original grids) [Pg] |
Model Period Mean (intersection) [Pg] |
Model Period Mean (complement) [Pg] |
Benchmark Period Mean (intersection) [Pg] |
Benchmark Period Mean (complement) [Pg] |
Bias [kg m-2] |
Bias Score [1] |
Spatial Distribution Score [1] |
Overall Score [1] |
|||
|---|---|---|---|---|---|---|---|---|---|---|---|---|
| Benchmark | [-] | 39.5 | ||||||||||
| CRUNCEPv7 | [-] | 31.5 | 33.2 | 0.863 | 39.5 | 0.0581 | -0.758 | 0.66 | 0.81 | 0.74 | ||
| GSWP3v1 | [-] | 24.7 | 26.2 | 0.837 | 39.5 | 0.0581 | -1.65 | 0.62 | 0.73 | 0.68 | ||
| WATCH | [-] | 33.4 | 34.8 | 0.941 | 39.5 | 0.0581 | -0.536 | 0.62 | 0.72 | 0.67 |
Download Data |
Period Mean (original grids) [Pg] |
Model Period Mean (intersection) [Pg] |
Model Period Mean (complement) [Pg] |
Benchmark Period Mean (intersection) [Pg] |
Benchmark Period Mean (complement) [Pg] |
Bias [kg m-2] |
Bias Score [1] |
Spatial Distribution Score [1] |
Overall Score [1] |
|||
|---|---|---|---|---|---|---|---|---|---|---|---|---|
| Benchmark | [-] | 122. | ||||||||||
| CRUNCEPv7 | [-] | 128. | 131. | 1.20 | 122. | 0.156 | 0.919 | 0.79 | 0.95 | 0.87 | ||
| GSWP3v1 | [-] | 113. | 115. | 1.16 | 122. | 0.156 | -0.192 | 0.75 | 0.89 | 0.82 | ||
| WATCH | [-] | 128. | 131. | 1.15 | 122. | 0.156 | 0.865 | 0.80 | 0.94 | 0.87 |
Download Data |
Period Mean (original grids) [Pg] |
Model Period Mean (intersection) [Pg] |
Model Period Mean (complement) [Pg] |
Benchmark Period Mean (intersection) [Pg] |
Benchmark Period Mean (complement) [Pg] |
Bias [kg m-2] |
Bias Score [1] |
Spatial Distribution Score [1] |
Overall Score [1] |
|||
|---|---|---|---|---|---|---|---|---|---|---|---|---|
| Benchmark | [-] | 28.1 | ||||||||||
| CRUNCEPv7 | [-] | 35.3 | 34.1 | 0.775 | 28.1 | 0.0452 | 0.930 | 0.54 | 0.78 | 0.66 | ||
| GSWP3v1 | [-] | 24.3 | 23.4 | 0.680 | 28.1 | 0.0452 | -0.416 | 0.59 | 0.85 | 0.72 | ||
| WATCH | [-] | 25.3 | 24.4 | 0.663 | 28.1 | 0.0452 | -0.298 | 0.62 | 0.85 | 0.74 |
Temporally integrated period mean