Mean State
Download Data |
Period Mean (original grids) [Pg] |
Model Period Mean (intersection) [Pg] |
Model Period Mean (complement) [Pg] |
Benchmark Period Mean (intersection) [Pg] |
Benchmark Period Mean (complement) [Pg] |
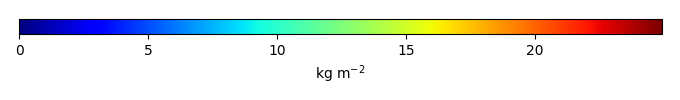
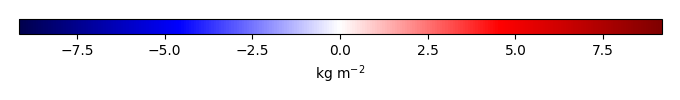
Bias [kg m-2] |
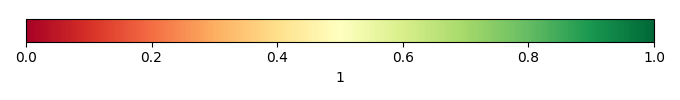
Bias Score [1] |
Spatial Distribution Score [1] |
Overall Score [1] |
|||
|---|---|---|---|---|---|---|---|---|---|---|---|---|
| Benchmark | [-] | 13.7 | ||||||||||
| CRUNCEPv7 | [-] | 8.23 | 4.36 | 3.74 | 13.5 | 0.172 | -1.24 | 0.46 | 0.57 | 0.51 | ||
| GSWP3v1 | [-] | 7.98 | 3.76 | 4.13 | 13.5 | 0.172 | -1.33 | 0.44 | 0.60 | 0.52 | ||
| WATCH | [-] | 8.99 | 4.39 | 4.49 | 13.5 | 0.172 | -1.22 | 0.45 | 0.56 | 0.50 |
Download Data |
Period Mean (original grids) [Pg] |
Model Period Mean (intersection) [Pg] |
Model Period Mean (complement) [Pg] |
Benchmark Period Mean (intersection) [Pg] |
Benchmark Period Mean (complement) [Pg] |
Bias [kg m-2] |
Bias Score [1] |
Spatial Distribution Score [1] |
Overall Score [1] |
|||
|---|---|---|---|---|---|---|---|---|---|---|---|---|
| Benchmark | [-] | 10.3 | ||||||||||
| CRUNCEPv7 | [-] | 10.2 | 9.43 | 0.529 | 9.93 | 0.106 | 0.818 | 0.59 | 0.76 | 0.67 | ||
| GSWP3v1 | [-] | 8.56 | 7.89 | 0.477 | 9.93 | 0.106 | 0.150 | 0.62 | 0.83 | 0.73 | ||
| WATCH | [-] | 9.33 | 8.74 | 0.458 | 9.93 | 0.106 | 0.495 | 0.62 | 0.83 | 0.72 |
Download Data |
Period Mean (original grids) [Pg] |
Model Period Mean (intersection) [Pg] |
Model Period Mean (complement) [Pg] |
Benchmark Period Mean (intersection) [Pg] |
Benchmark Period Mean (complement) [Pg] |
Bias [kg m-2] |
Bias Score [1] |
Spatial Distribution Score [1] |
Overall Score [1] |
|||
|---|---|---|---|---|---|---|---|---|---|---|---|---|
| Benchmark | [-] | 24.2 | ||||||||||
| CRUNCEPv7 | [-] | 37.8 | 11.0 | 26.3 | 25.2 | 0.0842 | -1.68 | 0.46 | 0.48 | 0.47 | ||
| GSWP3v1 | [-] | 32.2 | 11.7 | 20.1 | 25.2 | 0.0842 | -1.68 | 0.49 | 0.58 | 0.54 | ||
| WATCH | [-] | 36.5 | 11.6 | 24.5 | 25.2 | 0.0842 | -1.72 | 0.52 | 0.65 | 0.59 |
Download Data |
Period Mean (original grids) [Pg] |
Model Period Mean (intersection) [Pg] |
Model Period Mean (complement) [Pg] |
Benchmark Period Mean (intersection) [Pg] |
Benchmark Period Mean (complement) [Pg] |
Bias [kg m-2] |
Bias Score [1] |
Spatial Distribution Score [1] |
Overall Score [1] |
|||
|---|---|---|---|---|---|---|---|---|---|---|---|---|
| Benchmark | [-] | 37.5 | ||||||||||
| CRUNCEPv7 | [-] | 49.7 | 46.5 | 2.61 | 35.6 | 1.95 | 8.53 | 0.61 | 0.93 | 0.77 | ||
| GSWP3v1 | [-] | 40.2 | 37.7 | 2.09 | 35.6 | 1.95 | 5.17 | 0.71 | 0.92 | 0.82 | ||
| WATCH | [-] | 39.2 | 36.6 | 2.15 | 35.6 | 1.95 | 4.87 | 0.74 | 0.87 | 0.80 |
Download Data |
Period Mean (original grids) [Pg] |
Model Period Mean (intersection) [Pg] |
Model Period Mean (complement) [Pg] |
Benchmark Period Mean (intersection) [Pg] |
Benchmark Period Mean (complement) [Pg] |
Bias [kg m-2] |
Bias Score [1] |
Spatial Distribution Score [1] |
Overall Score [1] |
|||
|---|---|---|---|---|---|---|---|---|---|---|---|---|
| Benchmark | [-] | 352. | ||||||||||
| CRUNCEPv7 | [-] | 589. | 355. | 233. | 348. | 3.81 | 0.826 | 0.59 | 0.77 | 0.68 | ||
| GSWP3v1 | [-] | 486. | 309. | 178. | 348. | 3.81 | 0.0653 | 0.64 | 0.85 | 0.75 | ||
| WATCH | [-] | 505. | 339. | 166. | 348. | 3.81 | 0.488 | 0.63 | 0.84 | 0.73 |
Download Data |
Period Mean (original grids) [Pg] |
Model Period Mean (intersection) [Pg] |
Model Period Mean (complement) [Pg] |
Benchmark Period Mean (intersection) [Pg] |
Benchmark Period Mean (complement) [Pg] |
Bias [kg m-2] |
Bias Score [1] |
Spatial Distribution Score [1] |
Overall Score [1] |
|||
|---|---|---|---|---|---|---|---|---|---|---|---|---|
| Benchmark | [-] | 0.216 | ||||||||||
| CRUNCEPv7 | [-] | 1.86 | 0.0260 | 1.82 | 0.215 | 0.000273 | -0.400 | 0.39 | 0.053 | 0.22 | ||
| GSWP3v1 | [-] | 1.56 | 0.0205 | 1.52 | 0.215 | 0.000273 | -0.411 | 0.39 | 0.044 | 0.22 | ||
| WATCH | [-] | 2.11 | 0.0302 | 2.06 | 0.215 | 0.000273 | -0.390 | 0.40 | 0.069 | 0.23 |
Download Data |
Period Mean (original grids) [Pg] |
Model Period Mean (intersection) [Pg] |
Model Period Mean (complement) [Pg] |
Benchmark Period Mean (intersection) [Pg] |
Benchmark Period Mean (complement) [Pg] |
Bias [kg m-2] |
Bias Score [1] |
Spatial Distribution Score [1] |
Overall Score [1] |
|||
|---|---|---|---|---|---|---|---|---|---|---|---|---|
| Benchmark | [-] | 34.3 | ||||||||||
| CRUNCEPv7 | [-] | 29.2 | 26.3 | 0.282 | 34.3 | 0.0601 | -0.644 | 0.61 | 0.90 | 0.75 | ||
| GSWP3v1 | [-] | 27.1 | 24.4 | 0.292 | 34.3 | 0.0601 | -0.826 | 0.65 | 0.93 | 0.79 | ||
| WATCH | [-] | 30.1 | 27.4 | 0.283 | 34.3 | 0.0601 | -0.551 | 0.67 | 0.94 | 0.80 |
Download Data |
Period Mean (original grids) [Pg] |
Model Period Mean (intersection) [Pg] |
Model Period Mean (complement) [Pg] |
Benchmark Period Mean (intersection) [Pg] |
Benchmark Period Mean (complement) [Pg] |
Bias [kg m-2] |
Bias Score [1] |
Spatial Distribution Score [1] |
Overall Score [1] |
|||
|---|---|---|---|---|---|---|---|---|---|---|---|---|
| Benchmark | [-] | 30.6 | ||||||||||
| CRUNCEPv7 | [-] | 51.2 | 46.4 | 0.565 | 30.5 | 0.0685 | 6.46 | 0.59 | 0.87 | 0.73 | ||
| GSWP3v1 | [-] | 44.0 | 40.0 | 0.500 | 30.5 | 0.0685 | 4.24 | 0.69 | 0.93 | 0.81 | ||
| WATCH | [-] | 46.6 | 42.1 | 0.473 | 30.5 | 0.0685 | 4.87 | 0.64 | 0.90 | 0.77 |
Download Data |
Period Mean (original grids) [Pg] |
Model Period Mean (intersection) [Pg] |
Model Period Mean (complement) [Pg] |
Benchmark Period Mean (intersection) [Pg] |
Benchmark Period Mean (complement) [Pg] |
Bias [kg m-2] |
Bias Score [1] |
Spatial Distribution Score [1] |
Overall Score [1] |
|||
|---|---|---|---|---|---|---|---|---|---|---|---|---|
| Benchmark | [-] | 57.3 | ||||||||||
| CRUNCEPv7 | [-] | 35.1 | 34.4 | 0.874 | 55.7 | 0.502 | -1.92 | 0.61 | 0.88 | 0.74 | ||
| GSWP3v1 | [-] | 33.4 | 32.8 | 0.777 | 55.7 | 0.502 | -2.18 | 0.63 | 0.91 | 0.77 | ||
| WATCH | [-] | 33.4 | 32.8 | 0.782 | 55.7 | 0.502 | -2.18 | 0.64 | 0.91 | 0.78 |
Download Data |
Period Mean (original grids) [Pg] |
Model Period Mean (intersection) [Pg] |
Model Period Mean (complement) [Pg] |
Benchmark Period Mean (intersection) [Pg] |
Benchmark Period Mean (complement) [Pg] |
Bias [kg m-2] |
Bias Score [1] |
Spatial Distribution Score [1] |
Overall Score [1] |
|||
|---|---|---|---|---|---|---|---|---|---|---|---|---|
| Benchmark | [-] | 38.4 | ||||||||||
| CRUNCEPv7 | [-] | 31.4 | 33.8 | 0.257 | 38.3 | 0.0792 | -0.394 | 0.62 | 0.87 | 0.75 | ||
| GSWP3v1 | [-] | 24.7 | 26.8 | 0.255 | 38.3 | 0.0792 | -1.09 | 0.63 | 0.92 | 0.77 | ||
| WATCH | [-] | 33.2 | 35.3 | 0.279 | 38.3 | 0.0792 | -0.227 | 0.67 | 0.92 | 0.79 |
Download Data |
Period Mean (original grids) [Pg] |
Model Period Mean (intersection) [Pg] |
Model Period Mean (complement) [Pg] |
Benchmark Period Mean (intersection) [Pg] |
Benchmark Period Mean (complement) [Pg] |
Bias [kg m-2] |
Bias Score [1] |
Spatial Distribution Score [1] |
Overall Score [1] |
|||
|---|---|---|---|---|---|---|---|---|---|---|---|---|
| Benchmark | [-] | 95.5 | ||||||||||
| CRUNCEPv7 | [-] | 128. | 132. | 0.703 | 95.3 | 0.198 | 2.66 | 0.60 | 0.79 | 0.70 | ||
| GSWP3v1 | [-] | 113. | 116. | 0.647 | 95.3 | 0.198 | 1.60 | 0.67 | 0.88 | 0.77 | ||
| WATCH | [-] | 128. | 131. | 0.597 | 95.3 | 0.198 | 2.57 | 0.61 | 0.82 | 0.72 |
Download Data |
Period Mean (original grids) [Pg] |
Model Period Mean (intersection) [Pg] |
Model Period Mean (complement) [Pg] |
Benchmark Period Mean (intersection) [Pg] |
Benchmark Period Mean (complement) [Pg] |
Bias [kg m-2] |
Bias Score [1] |
Spatial Distribution Score [1] |
Overall Score [1] |
|||
|---|---|---|---|---|---|---|---|---|---|---|---|---|
| Benchmark | [-] | 0.794 | ||||||||||
| CRUNCEPv7 | [-] | 35.4 | 2.94 | 32.0 | 1.09 | 0.00 | 2.46 | 0.44 | 0.36 | 0.40 | ||
| GSWP3v1 | [-] | 24.3 | 0.999 | 23.0 | 1.09 | 0.00 | 0.156 | 0.51 | 0.69 | 0.60 | ||
| WATCH | [-] | 25.1 | 2.22 | 22.6 | 1.09 | 0.00 | 1.58 | 0.54 | 0.54 | 0.54 |
Temporally integrated period mean