Mean State
Download Data |
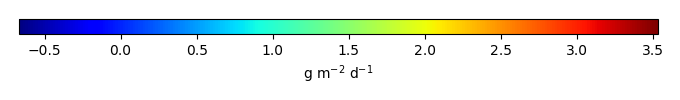
Period Mean (original grids) [g m-2 d-1] |
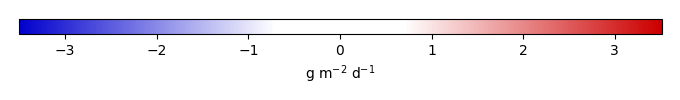
Bias [g m-2 d-1] |
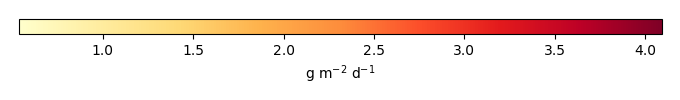
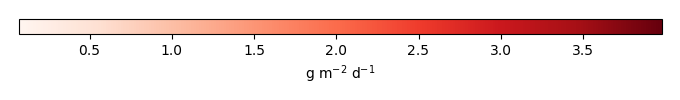
RMSE [g m-2 d-1] |
Phase Shift [months] |
Bias Score [1] |
RMSE Score [1] |
Seasonal Cycle Score [1] |
Interannual Variability Score [1] |
Overall Score [1] |
|||
|---|---|---|---|---|---|---|---|---|---|---|---|---|
| Benchmark | [-] | -0.106 | ||||||||||
| CLM4 | [-] | 0.0549 | 0.160 | 0.842 | 0.508 | 0.593 | 0.256 | 0.914 | 0.666 | 0.537 | ||
| CLM4.5 | [-] | 0.0940 | 0.200 | 0.891 | 2.52 | 0.536 | 0.206 | 0.816 | 0.844 | 0.522 | ||
| CLM5 | [-] | 0.168 | 0.274 | 0.830 | 2.99 | 0.507 | 0.349 | 0.117 | 0.463 | 0.357 |
Download Data |
Period Mean (original grids) [g m-2 d-1] |
Bias [g m-2 d-1] |
RMSE [g m-2 d-1] |
Phase Shift [months] |
Bias Score [1] |
RMSE Score [1] |
Seasonal Cycle Score [1] |
Interannual Variability Score [1] |
Overall Score [1] |
|||
|---|---|---|---|---|---|---|---|---|---|---|---|---|
| Benchmark | [-] | 0.443 | ||||||||||
| CLM4 | [-] | 0.00245 | -0.441 | 1.09 | 0.00 | 0.647 | 0.372 | 1.00 | 0.372 | 0.553 | ||
| CLM4.5 | [-] | 0.0205 | -0.423 | 0.856 | 0.00 | 0.659 | 0.447 | 1.00 | 0.857 | 0.682 | ||
| CLM5 | [-] | 0.0474 | -0.396 | 0.915 | 0.00 | 0.676 | 0.408 | 1.00 | 0.729 | 0.644 |
Download Data |
Period Mean (original grids) [g m-2 d-1] |
Bias [g m-2 d-1] |
RMSE [g m-2 d-1] |
Phase Shift [months] |
Bias Score [1] |
RMSE Score [1] |
Seasonal Cycle Score [1] |
Interannual Variability Score [1] |
Overall Score [1] |
|||
|---|---|---|---|---|---|---|---|---|---|---|---|---|
| Benchmark | [-] | -1.15 | ||||||||||
| CLM4 | [-] | 0.216 | 1.36 | 1.92 | 1.02 | 0.368 | 0.380 | 0.933 | 0.461 | 0.504 | ||
| CLM4.5 | [-] | 0.341 | 1.49 | 2.07 | 4.08 | 0.336 | 0.361 | 0.244 | 0.412 | 0.343 | ||
| CLM5 | [-] | 0.264 | 1.41 | 2.04 | 6.05 | 0.356 | 0.350 | 7.41e-05 | 0.448 | 0.301 |
Download Data |
Period Mean (original grids) [g m-2 d-1] |
Bias [g m-2 d-1] |
RMSE [g m-2 d-1] |
Phase Shift [months] |
Bias Score [1] |
RMSE Score [1] |
Seasonal Cycle Score [1] |
Interannual Variability Score [1] |
Overall Score [1] |
|||
|---|---|---|---|---|---|---|---|---|---|---|---|---|
| Benchmark | [-] | 0.546 | ||||||||||
| CLM4 | [-] | 0.0627 | -0.484 | 0.821 | 0.508 | 0.571 | 0.475 | 0.958 | 0.814 | 0.659 | ||
| CLM4.5 | [-] | 0.0688 | -0.478 | 0.777 | 0.00 | 0.573 | 0.469 | 1.00 | 0.866 | 0.675 | ||
| CLM5 | [-] | 0.107 | -0.439 | 0.776 | 0.508 | 0.600 | 0.449 | 0.958 | 0.794 | 0.650 |
Download Data |
Period Mean (original grids) [g m-2 d-1] |
Bias [g m-2 d-1] |
RMSE [g m-2 d-1] |
Phase Shift [months] |
Bias Score [1] |
RMSE Score [1] |
Seasonal Cycle Score [1] |
Interannual Variability Score [1] |
Overall Score [1] |
|||
|---|---|---|---|---|---|---|---|---|---|---|---|---|
| Benchmark | [-] | 0.988 | ||||||||||
| CLM4 | [-] | 0.0852 | -0.903 | 1.47 | 1.49 | 0.493 | 0.421 | 0.838 | 0.797 | 0.594 | ||
| CLM4.5 | [-] | 0.157 | -0.831 | 1.63 | 1.49 | 0.521 | 0.347 | 0.838 | 0.751 | 0.561 | ||
| CLM5 | [-] | 0.194 | -0.794 | 1.31 | 1.49 | 0.537 | 0.447 | 0.838 | 0.563 | 0.567 |
Download Data |
Period Mean (original grids) [g m-2 d-1] |
Bias [g m-2 d-1] |
RMSE [g m-2 d-1] |
Phase Shift [months] |
Bias Score [1] |
RMSE Score [1] |
Seasonal Cycle Score [1] |
Interannual Variability Score [1] |
Overall Score [1] |
|||
|---|---|---|---|---|---|---|---|---|---|---|---|---|
| Benchmark | [-] | 0.812 | ||||||||||
| CLM4 | [-] | 0.0454 | -0.767 | 1.77 | 0.860 | 0.516 | 0.411 | 0.922 | 0.589 | 0.570 | ||
| CLM4.5 | [-] | 0.0782 | -0.734 | 1.66 | 0.645 | 0.527 | 0.455 | 0.951 | 0.685 | 0.614 | ||
| CLM5 | [-] | 0.264 | -0.548 | 1.62 | 0.684 | 0.580 | 0.466 | 0.948 | 0.738 | 0.640 |
Download Data |
Period Mean (original grids) [g m-2 d-1] |
Bias [g m-2 d-1] |
RMSE [g m-2 d-1] |
Phase Shift [months] |
Bias Score [1] |
RMSE Score [1] |
Seasonal Cycle Score [1] |
Interannual Variability Score [1] |
Overall Score [1] |
|||
|---|---|---|---|---|---|---|---|---|---|---|---|---|
| Benchmark | [-] | 0.648 | ||||||||||
| CLM4 | [-] | 0.0675 | -0.580 | 1.67 | 0.957 | 0.505 | 0.426 | 0.927 | 0.632 | 0.583 | ||
| CLM4.5 | [-] | 0.0979 | -0.550 | 1.59 | 0.820 | 0.516 | 0.462 | 0.964 | 0.713 | 0.623 | ||
| CLM5 | [-] | 0.234 | -0.414 | 1.51 | 0.907 | 0.562 | 0.470 | 0.947 | 0.719 | 0.634 |
Download Data |
Period Mean (original grids) [g m-2 d-1] |
Bias [g m-2 d-1] |
RMSE [g m-2 d-1] |
Phase Shift [months] |
Bias Score [1] |
RMSE Score [1] |
Seasonal Cycle Score [1] |
Interannual Variability Score [1] |
Overall Score [1] |
|||
|---|---|---|---|---|---|---|---|---|---|---|---|---|
| Benchmark | [-] | 0.587 | ||||||||||
| CLM4 | [-] | 0.0175 | -0.570 | 1.07 | 1.02 | 0.542 | 0.378 | 0.933 | 0.396 | 0.525 | ||
| CLM4.5 | [-] | -0.0102 | -0.597 | 0.976 | 1.02 | 0.526 | 0.417 | 0.933 | 0.611 | 0.581 | ||
| CLM5 | [-] | 0.0515 | -0.536 | 1.02 | 2.03 | 0.562 | 0.381 | 0.749 | 0.828 | 0.580 |
Download Data |
Period Mean (original grids) [g m-2 d-1] |
Bias [g m-2 d-1] |
RMSE [g m-2 d-1] |
Phase Shift [months] |
Bias Score [1] |
RMSE Score [1] |
Seasonal Cycle Score [1] |
Interannual Variability Score [1] |
Overall Score [1] |
|||
|---|---|---|---|---|---|---|---|---|---|---|---|---|
| Benchmark | [-] | 0.841 | ||||||||||
| CLM4 | [-] | 0.130 | -0.711 | 2.15 | 0.922 | 0.487 | 0.431 | 0.973 | 0.693 | 0.603 | ||
| CLM4.5 | [-] | 0.146 | -0.694 | 1.99 | 0.922 | 0.490 | 0.451 | 0.974 | 0.725 | 0.618 | ||
| CLM5 | [-] | 0.314 | -0.527 | 1.89 | 1.16 | 0.528 | 0.458 | 0.926 | 0.651 | 0.604 |
Download Data |
Period Mean (original grids) [g m-2 d-1] |
Bias [g m-2 d-1] |
RMSE [g m-2 d-1] |
Phase Shift [months] |
Bias Score [1] |
RMSE Score [1] |
Seasonal Cycle Score [1] |
Interannual Variability Score [1] |
Overall Score [1] |
|||
|---|---|---|---|---|---|---|---|---|---|---|---|---|
| Benchmark | [-] | -0.0705 | ||||||||||
| CLM4 | [-] | 0.0486 | 0.119 | 1.03 | 1.30 | -0.0205 | -0.336 | 0.544 | -0.222 | -0.0742 | ||
| CLM4.5 | [-] | 0.104 | 0.175 | 1.21 | 0.794 | -0.179 | -0.400 | 0.675 | -0.336 | -0.128 | ||
| CLM5 | [-] | 0.110 | 0.181 | 0.831 | 0.504 | -0.210 | -0.227 | 0.604 | 0.109 | 0.00987 |
Download Data |
Period Mean (original grids) [g m-2 d-1] |
Bias [g m-2 d-1] |
RMSE [g m-2 d-1] |
Phase Shift [months] |
Bias Score [1] |
RMSE Score [1] |
Seasonal Cycle Score [1] |
Interannual Variability Score [1] |
Overall Score [1] |
|||
|---|---|---|---|---|---|---|---|---|---|---|---|---|
| Benchmark | [-] | 0.656 | ||||||||||
| CLM4 | [-] | 0.0626 | -0.593 | 1.33 | 0.847 | 0.254 | 0.380 | 0.896 | 0.559 | 0.494 | ||
| CLM4.5 | [-] | 0.0443 | -0.612 | 1.31 | 0.847 | 0.244 | 0.401 | 0.890 | 0.565 | 0.500 | ||
| CLM5 | [-] | 0.150 | -0.506 | 1.47 | 0.678 | 0.272 | 0.410 | 0.891 | 0.658 | 0.528 |
Download Data |
Period Mean (original grids) [g m-2 d-1] |
Bias [g m-2 d-1] |
RMSE [g m-2 d-1] |
Phase Shift [months] |
Bias Score [1] |
RMSE Score [1] |
Seasonal Cycle Score [1] |
Interannual Variability Score [1] |
Overall Score [1] |
|||
|---|---|---|---|---|---|---|---|---|---|---|---|---|
| Benchmark | [-] | 1.07 | ||||||||||
| CLM4 | [-] | 0.222 | -0.852 | 1.50 | 4.08 | 0.453 | 0.318 | 0.244 | 0.501 | 0.367 | ||
| CLM4.5 | [-] | 0.303 | -0.772 | 1.37 | 2.03 | 0.488 | 0.346 | 0.749 | 0.562 | 0.498 | ||
| CLM5 | [-] | 0.208 | -0.866 | 1.41 | 4.08 | 0.447 | 0.369 | 0.244 | 0.438 | 0.373 |
Temporally integrated period mean