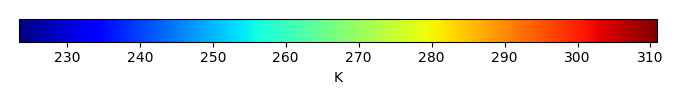
Mean State
Download Data |
Period Mean (original grids) [K] |
Model Period Mean (intersection) [K] |
Model Period Mean (complement) [K] |
Benchmark Period Mean (intersection) [K] |
Benchmark Period Mean (complement) [K] |
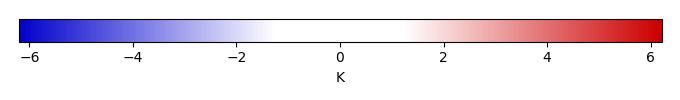
Bias [K] |
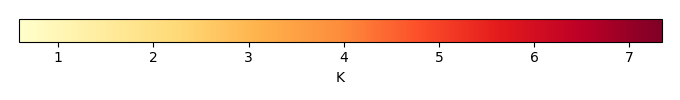
RMSE [K] |
Phase Shift [months] |
Bias Score [1] |
RMSE Score [1] |
Seasonal Cycle Score [1] |
Spatial Distribution Score [1] |
Interannual Variability Score [1] |
Overall Score [1] |
|||
|---|---|---|---|---|---|---|---|---|---|---|---|---|---|---|---|---|---|
| Benchmark | [-] | 304. | |||||||||||||||
| CLM4 | [-] | 305. | 305. | 304. | 304. | 304. | 1.52 | 1.88 | 0.459 | 0.345 | 0.615 | 0.935 | 0.991 | 0.796 | 0.716 | ||
| CLM4.5 | [-] | 305. | 305. | 304. | 304. | 304. | 1.68 | 2.01 | 0.366 | 0.311 | 0.642 | 0.952 | 0.998 | 0.806 | 0.725 | ||
| CLM5 | [-] | 305. | 305. | 304. | 304. | 304. | 1.75 | 2.06 | 0.325 | 0.300 | 0.649 | 0.958 | 0.999 | 0.801 | 0.726 |
Download Data |
Period Mean (original grids) [K] |
Model Period Mean (intersection) [K] |
Model Period Mean (complement) [K] |
Benchmark Period Mean (intersection) [K] |
Benchmark Period Mean (complement) [K] |
Bias [K] |
RMSE [K] |
Phase Shift [months] |
Bias Score [1] |
RMSE Score [1] |
Seasonal Cycle Score [1] |
Spatial Distribution Score [1] |
Interannual Variability Score [1] |
Overall Score [1] |
|||
|---|---|---|---|---|---|---|---|---|---|---|---|---|---|---|---|---|---|
| Benchmark | [-] | 307. | |||||||||||||||
| CLM4 | [-] | 309. | 309. | 305. | 307. | 305. | 1.94 | 2.18 | 0.193 | 0.499 | 0.754 | 0.984 | 0.997 | 0.888 | 0.813 | ||
| CLM4.5 | [-] | 309. | 309. | 305. | 307. | 305. | 1.90 | 2.14 | 0.180 | 0.505 | 0.763 | 0.985 | 0.997 | 0.882 | 0.816 | ||
| CLM5 | [-] | 309. | 309. | 305. | 307. | 305. | 1.99 | 2.21 | 0.171 | 0.491 | 0.768 | 0.986 | 0.997 | 0.882 | 0.815 |
Download Data |
Period Mean (original grids) [K] |
Model Period Mean (intersection) [K] |
Model Period Mean (complement) [K] |
Benchmark Period Mean (intersection) [K] |
Benchmark Period Mean (complement) [K] |
Bias [K] |
RMSE [K] |
Phase Shift [months] |
Bias Score [1] |
RMSE Score [1] |
Seasonal Cycle Score [1] |
Spatial Distribution Score [1] |
Interannual Variability Score [1] |
Overall Score [1] |
|||
|---|---|---|---|---|---|---|---|---|---|---|---|---|---|---|---|---|---|
| Benchmark | [-] | 301. | |||||||||||||||
| CLM4 | [-] | 303. | 303. | 300. | 301. | 302. | 1.74 | 2.08 | 0.353 | 0.443 | 0.713 | 0.957 | 0.997 | 0.837 | 0.777 | ||
| CLM4.5 | [-] | 303. | 303. | 300. | 301. | 302. | 1.70 | 2.02 | 0.331 | 0.451 | 0.726 | 0.960 | 0.998 | 0.832 | 0.782 | ||
| CLM5 | [-] | 303. | 303. | 300. | 301. | 302. | 1.80 | 2.10 | 0.302 | 0.436 | 0.738 | 0.963 | 0.998 | 0.831 | 0.784 |
Download Data |
Period Mean (original grids) [K] |
Model Period Mean (intersection) [K] |
Model Period Mean (complement) [K] |
Benchmark Period Mean (intersection) [K] |
Benchmark Period Mean (complement) [K] |
Bias [K] |
RMSE [K] |
Phase Shift [months] |
Bias Score [1] |
RMSE Score [1] |
Seasonal Cycle Score [1] |
Spatial Distribution Score [1] |
Interannual Variability Score [1] |
Overall Score [1] |
|||
|---|---|---|---|---|---|---|---|---|---|---|---|---|---|---|---|---|---|
| Benchmark | [-] | 266. | |||||||||||||||
| CLM4 | [-] | 266. | 266. | 269. | 266. | 269. | 0.173 | 1.90 | 0.0369 | 0.949 | 0.898 | 0.998 | 1.00 | 0.902 | 0.941 | ||
| CLM4.5 | [-] | 266. | 266. | 269. | 266. | 269. | 0.286 | 1.84 | 0.0370 | 0.947 | 0.904 | 0.998 | 0.998 | 0.903 | 0.942 | ||
| CLM5 | [-] | 266. | 266. | 270. | 266. | 269. | 0.589 | 1.77 | 0.0318 | 0.941 | 0.912 | 0.998 | 0.999 | 0.901 | 0.944 |
Download Data |
Period Mean (original grids) [K] |
Model Period Mean (intersection) [K] |
Model Period Mean (complement) [K] |
Benchmark Period Mean (intersection) [K] |
Benchmark Period Mean (complement) [K] |
Bias [K] |
RMSE [K] |
Phase Shift [months] |
Bias Score [1] |
RMSE Score [1] |
Seasonal Cycle Score [1] |
Spatial Distribution Score [1] |
Interannual Variability Score [1] |
Overall Score [1] |
|||
|---|---|---|---|---|---|---|---|---|---|---|---|---|---|---|---|---|---|
| Benchmark | [-] | 304. | |||||||||||||||
| CLM4 | [-] | 305. | 305. | 303. | 304. | 303. | 0.751 | 1.39 | 1.12 | 0.260 | 0.504 | 0.832 | 0.938 | 0.831 | 0.645 | ||
| CLM4.5 | [-] | 305. | 305. | 304. | 304. | 303. | 1.19 | 1.73 | 1.04 | 0.181 | 0.511 | 0.844 | 0.911 | 0.808 | 0.627 | ||
| CLM5 | [-] | 305. | 305. | 304. | 304. | 303. | 1.33 | 1.84 | 1.04 | 0.163 | 0.510 | 0.845 | 0.900 | 0.811 | 0.623 |
Download Data |
Period Mean (original grids) [K] |
Model Period Mean (intersection) [K] |
Model Period Mean (complement) [K] |
Benchmark Period Mean (intersection) [K] |
Benchmark Period Mean (complement) [K] |
Bias [K] |
RMSE [K] |
Phase Shift [months] |
Bias Score [1] |
RMSE Score [1] |
Seasonal Cycle Score [1] |
Spatial Distribution Score [1] |
Interannual Variability Score [1] |
Overall Score [1] |
|||
|---|---|---|---|---|---|---|---|---|---|---|---|---|---|---|---|---|---|
| Benchmark | [-] | 276. | |||||||||||||||
| CLM4 | [-] | 276. | 276. | 277. | 276. | 278. | 0.268 | 1.23 | 0.00650 | 0.959 | 0.935 | 1.00 | 1.00 | 0.968 | 0.966 | ||
| CLM4.5 | [-] | 276. | 276. | 277. | 276. | 278. | 0.0688 | 1.22 | 0.00686 | 0.961 | 0.934 | 1.00 | 1.00 | 0.971 | 0.966 | ||
| CLM5 | [-] | 276. | 276. | 278. | 276. | 278. | 0.272 | 1.09 | 0.00657 | 0.962 | 0.943 | 1.00 | 1.00 | 0.971 | 0.970 |
Download Data |
Period Mean (original grids) [K] |
Model Period Mean (intersection) [K] |
Model Period Mean (complement) [K] |
Benchmark Period Mean (intersection) [K] |
Benchmark Period Mean (complement) [K] |
Bias [K] |
RMSE [K] |
Phase Shift [months] |
Bias Score [1] |
RMSE Score [1] |
Seasonal Cycle Score [1] |
Spatial Distribution Score [1] |
Interannual Variability Score [1] |
Overall Score [1] |
|||
|---|---|---|---|---|---|---|---|---|---|---|---|---|---|---|---|---|---|
| Benchmark | [-] | 286. | |||||||||||||||
| CLM4 | [-] | 287. | 286. | 291. | 286. | 289. | 0.954 | 1.64 | 0.0595 | 0.868 | 0.925 | 0.995 | 1.00 | 0.934 | 0.941 | ||
| CLM4.5 | [-] | 287. | 286. | 291. | 286. | 289. | 0.859 | 1.63 | 0.0572 | 0.872 | 0.923 | 0.996 | 1.00 | 0.935 | 0.941 | ||
| CLM5 | [-] | 287. | 286. | 291. | 286. | 289. | 0.949 | 1.62 | 0.0587 | 0.869 | 0.927 | 0.996 | 1.00 | 0.942 | 0.943 |
Download Data |
Period Mean (original grids) [K] |
Model Period Mean (intersection) [K] |
Model Period Mean (complement) [K] |
Benchmark Period Mean (intersection) [K] |
Benchmark Period Mean (complement) [K] |
Bias [K] |
RMSE [K] |
Phase Shift [months] |
Bias Score [1] |
RMSE Score [1] |
Seasonal Cycle Score [1] |
Spatial Distribution Score [1] |
Interannual Variability Score [1] |
Overall Score [1] |
|||
|---|---|---|---|---|---|---|---|---|---|---|---|---|---|---|---|---|---|
| Benchmark | [-] | 302. | |||||||||||||||
| CLM4 | [-] | 304. | 304. | 304. | 302. | 304. | 1.25 | 1.89 | 0.199 | 0.611 | 0.798 | 0.980 | 0.999 | 0.899 | 0.848 | ||
| CLM4.5 | [-] | 304. | 304. | 304. | 302. | 304. | 1.29 | 1.89 | 0.192 | 0.607 | 0.809 | 0.981 | 0.999 | 0.910 | 0.853 | ||
| CLM5 | [-] | 304. | 304. | 304. | 302. | 304. | 1.34 | 1.91 | 0.200 | 0.600 | 0.817 | 0.980 | 1.00 | 0.917 | 0.855 |
Download Data |
Period Mean (original grids) [K] |
Model Period Mean (intersection) [K] |
Model Period Mean (complement) [K] |
Benchmark Period Mean (intersection) [K] |
Benchmark Period Mean (complement) [K] |
Bias [K] |
RMSE [K] |
Phase Shift [months] |
Bias Score [1] |
RMSE Score [1] |
Seasonal Cycle Score [1] |
Spatial Distribution Score [1] |
Interannual Variability Score [1] |
Overall Score [1] |
|||
|---|---|---|---|---|---|---|---|---|---|---|---|---|---|---|---|---|---|
| Benchmark | [-] | 268. | |||||||||||||||
| CLM4 | [-] | 267. | 267. | 269. | 268. | 268. | -0.538 | 1.73 | 0.00954 | 0.953 | 0.906 | 0.999 | 1.00 | 0.917 | 0.947 | ||
| CLM4.5 | [-] | 267. | 267. | 269. | 268. | 268. | -0.508 | 1.64 | 0.0150 | 0.955 | 0.911 | 0.999 | 1.00 | 0.915 | 0.948 | ||
| CLM5 | [-] | 267. | 267. | 269. | 268. | 268. | -0.198 | 1.44 | 0.0151 | 0.965 | 0.919 | 0.999 | 1.00 | 0.912 | 0.952 |
Download Data |
Period Mean (original grids) [K] |
Model Period Mean (intersection) [K] |
Model Period Mean (complement) [K] |
Benchmark Period Mean (intersection) [K] |
Benchmark Period Mean (complement) [K] |
Bias [K] |
RMSE [K] |
Phase Shift [months] |
Bias Score [1] |
RMSE Score [1] |
Seasonal Cycle Score [1] |
Spatial Distribution Score [1] |
Interannual Variability Score [1] |
Overall Score [1] |
|||
|---|---|---|---|---|---|---|---|---|---|---|---|---|---|---|---|---|---|
| Benchmark | [-] | 301. | |||||||||||||||
| CLM4 | [-] | 303. | 303. | 297. | 301. | 299. | 1.75 | 2.00 | 0.125 | 0.674 | 0.872 | 0.991 | 0.997 | 0.891 | 0.883 | ||
| CLM4.5 | [-] | 303. | 303. | 297. | 301. | 299. | 1.71 | 1.96 | 0.125 | 0.679 | 0.874 | 0.991 | 0.998 | 0.897 | 0.885 | ||
| CLM5 | [-] | 303. | 303. | 297. | 301. | 299. | 1.76 | 1.99 | 0.114 | 0.673 | 0.880 | 0.991 | 0.997 | 0.905 | 0.888 |
Download Data |
Period Mean (original grids) [K] |
Model Period Mean (intersection) [K] |
Model Period Mean (complement) [K] |
Benchmark Period Mean (intersection) [K] |
Benchmark Period Mean (complement) [K] |
Bias [K] |
RMSE [K] |
Phase Shift [months] |
Bias Score [1] |
RMSE Score [1] |
Seasonal Cycle Score [1] |
Spatial Distribution Score [1] |
Interannual Variability Score [1] |
Overall Score [1] |
|||
|---|---|---|---|---|---|---|---|---|---|---|---|---|---|---|---|---|---|
| Benchmark | [-] | 286. | |||||||||||||||
| CLM4 | [-] | 286. | 286. | 287. | 286. | 289. | 0.417 | 1.43 | 0.184 | 0.872 | 0.894 | 0.988 | 0.990 | 0.936 | 0.929 | ||
| CLM4.5 | [-] | 286. | 286. | 287. | 286. | 289. | 0.438 | 1.36 | 0.152 | 0.879 | 0.898 | 0.990 | 0.994 | 0.937 | 0.932 | ||
| CLM5 | [-] | 286. | 286. | 287. | 286. | 289. | 0.520 | 1.28 | 0.193 | 0.881 | 0.906 | 0.987 | 0.997 | 0.941 | 0.936 |
Download Data |
Period Mean (original grids) [K] |
Model Period Mean (intersection) [K] |
Model Period Mean (complement) [K] |
Benchmark Period Mean (intersection) [K] |
Benchmark Period Mean (complement) [K] |
Bias [K] |
RMSE [K] |
Phase Shift [months] |
Bias Score [1] |
RMSE Score [1] |
Seasonal Cycle Score [1] |
Spatial Distribution Score [1] |
Interannual Variability Score [1] |
Overall Score [1] |
|||
|---|---|---|---|---|---|---|---|---|---|---|---|---|---|---|---|---|---|
| Benchmark | [-] | 292. | |||||||||||||||
| CLM4 | [-] | 288. | 293. | 250. | 292. | 295. | 1.03 | 1.85 | 0.183 | 0.695 | 0.826 | 0.979 | 0.996 | 0.908 | 0.872 | ||
| CLM4.5 | [-] | 289. | 293. | 251. | 292. | 295. | 1.02 | 1.84 | 0.171 | 0.692 | 0.832 | 0.981 | 0.996 | 0.908 | 0.873 | ||
| CLM5 | [-] | 289. | 293. | 252. | 292. | 295. | 1.15 | 1.82 | 0.166 | 0.687 | 0.840 | 0.981 | 0.997 | 0.910 | 0.876 |
Download Data |
Period Mean (original grids) [K] |
Model Period Mean (intersection) [K] |
Model Period Mean (complement) [K] |
Benchmark Period Mean (intersection) [K] |
Benchmark Period Mean (complement) [K] |
Bias [K] |
RMSE [K] |
Phase Shift [months] |
Bias Score [1] |
RMSE Score [1] |
Seasonal Cycle Score [1] |
Spatial Distribution Score [1] |
Interannual Variability Score [1] |
Overall Score [1] |
|||
|---|---|---|---|---|---|---|---|---|---|---|---|---|---|---|---|---|---|
| Benchmark | [-] | 303. | |||||||||||||||
| CLM4 | [-] | 304. | 304. | 301. | 303. | 303. | 1.71 | 2.11 | 0.110 | 0.735 | 0.890 | 0.991 | 0.998 | 0.912 | 0.903 | ||
| CLM4.5 | [-] | 304. | 304. | 301. | 303. | 303. | 1.65 | 2.05 | 0.112 | 0.742 | 0.891 | 0.991 | 0.998 | 0.912 | 0.904 | ||
| CLM5 | [-] | 304. | 304. | 301. | 303. | 303. | 1.71 | 2.09 | 0.115 | 0.736 | 0.892 | 0.991 | 0.998 | 0.913 | 0.904 |
Download Data |
Period Mean (original grids) [K] |
Model Period Mean (intersection) [K] |
Model Period Mean (complement) [K] |
Benchmark Period Mean (intersection) [K] |
Benchmark Period Mean (complement) [K] |
Bias [K] |
RMSE [K] |
Phase Shift [months] |
Bias Score [1] |
RMSE Score [1] |
Seasonal Cycle Score [1] |
Spatial Distribution Score [1] |
Interannual Variability Score [1] |
Overall Score [1] |
|||
|---|---|---|---|---|---|---|---|---|---|---|---|---|---|---|---|---|---|
| Benchmark | [-] | 268. | |||||||||||||||
| CLM4 | [-] | 268. | 268. | 267. | 268. | 270. | 0.0371 | 1.81 | 0.0273 | 0.939 | 0.885 | 0.998 | 0.999 | 0.914 | 0.937 | ||
| CLM4.5 | [-] | 268. | 268. | 267. | 268. | 270. | 0.0152 | 1.72 | 0.0164 | 0.942 | 0.890 | 0.999 | 0.999 | 0.914 | 0.939 | ||
| CLM5 | [-] | 269. | 269. | 268. | 268. | 270. | 0.359 | 1.57 | 0.0160 | 0.940 | 0.903 | 0.999 | 0.999 | 0.912 | 0.943 |
Download Data |
Period Mean (original grids) [K] |
Model Period Mean (intersection) [K] |
Model Period Mean (complement) [K] |
Benchmark Period Mean (intersection) [K] |
Benchmark Period Mean (complement) [K] |
Bias [K] |
RMSE [K] |
Phase Shift [months] |
Bias Score [1] |
RMSE Score [1] |
Seasonal Cycle Score [1] |
Spatial Distribution Score [1] |
Interannual Variability Score [1] |
Overall Score [1] |
|||
|---|---|---|---|---|---|---|---|---|---|---|---|---|---|---|---|---|---|
| Benchmark | [-] | 302. | |||||||||||||||
| CLM4 | [-] | 303. | 303. | 303. | 302. | 303. | 1.30 | 2.03 | 0.286 | 0.542 | 0.739 | 0.973 | 0.986 | 0.906 | 0.814 | ||
| CLM4.5 | [-] | 303. | 303. | 303. | 302. | 303. | 1.29 | 2.01 | 0.283 | 0.545 | 0.739 | 0.973 | 0.987 | 0.908 | 0.815 | ||
| CLM5 | [-] | 303. | 303. | 303. | 302. | 303. | 1.39 | 2.06 | 0.284 | 0.533 | 0.747 | 0.973 | 0.988 | 0.908 | 0.816 |
Download Data |
Period Mean (original grids) [K] |
Model Period Mean (intersection) [K] |
Model Period Mean (complement) [K] |
Benchmark Period Mean (intersection) [K] |
Benchmark Period Mean (complement) [K] |
Bias [K] |
RMSE [K] |
Phase Shift [months] |
Bias Score [1] |
RMSE Score [1] |
Seasonal Cycle Score [1] |
Spatial Distribution Score [1] |
Interannual Variability Score [1] |
Overall Score [1] |
|||
|---|---|---|---|---|---|---|---|---|---|---|---|---|---|---|---|---|---|
| Benchmark | [-] | 292. | |||||||||||||||
| CLM4 | [-] | 293. | 293. | 299. | 292. | 297. | 1.00 | 1.27 | 0.103 | 0.881 | 0.937 | 0.993 | 0.999 | 0.968 | 0.952 | ||
| CLM4.5 | [-] | 293. | 293. | 299. | 292. | 297. | 0.869 | 1.22 | 0.0862 | 0.890 | 0.933 | 0.994 | 0.998 | 0.964 | 0.952 | ||
| CLM5 | [-] | 293. | 293. | 299. | 292. | 297. | 0.973 | 1.27 | 0.0812 | 0.882 | 0.935 | 0.995 | 0.997 | 0.964 | 0.951 |
Download Data |
Period Mean (original grids) [K] |
Model Period Mean (intersection) [K] |
Model Period Mean (complement) [K] |
Benchmark Period Mean (intersection) [K] |
Benchmark Period Mean (complement) [K] |
Bias [K] |
RMSE [K] |
Phase Shift [months] |
Bias Score [1] |
RMSE Score [1] |
Seasonal Cycle Score [1] |
Spatial Distribution Score [1] |
Interannual Variability Score [1] |
Overall Score [1] |
|||
|---|---|---|---|---|---|---|---|---|---|---|---|---|---|---|---|---|---|
| Benchmark | [-] | 279. | |||||||||||||||
| CLM4 | [-] | 280. | 280. | 281. | 279. | 282. | 0.620 | 1.33 | 0.0410 | 0.922 | 0.919 | 0.997 | 0.997 | 0.959 | 0.952 | ||
| CLM4.5 | [-] | 280. | 280. | 281. | 279. | 282. | 0.464 | 1.22 | 0.0343 | 0.931 | 0.922 | 0.998 | 0.997 | 0.958 | 0.955 | ||
| CLM5 | [-] | 280. | 280. | 281. | 279. | 282. | 0.601 | 1.19 | 0.0353 | 0.928 | 0.928 | 0.998 | 0.999 | 0.959 | 0.956 |
Download Data |
Period Mean (original grids) [K] |
Model Period Mean (intersection) [K] |
Model Period Mean (complement) [K] |
Benchmark Period Mean (intersection) [K] |
Benchmark Period Mean (complement) [K] |
Bias [K] |
RMSE [K] |
Phase Shift [months] |
Bias Score [1] |
RMSE Score [1] |
Seasonal Cycle Score [1] |
Spatial Distribution Score [1] |
Interannual Variability Score [1] |
Overall Score [1] |
|||
|---|---|---|---|---|---|---|---|---|---|---|---|---|---|---|---|---|---|
| Benchmark | [-] | 291. | |||||||||||||||
| CLM4 | [-] | 292. | 292. | 292. | 291. | 292. | 1.22 | 1.73 | 0.0457 | 0.846 | 0.909 | 0.997 | 0.999 | 0.933 | 0.932 | ||
| CLM4.5 | [-] | 292. | 292. | 292. | 291. | 292. | 1.06 | 1.70 | 0.0461 | 0.855 | 0.901 | 0.997 | 0.999 | 0.928 | 0.930 | ||
| CLM5 | [-] | 292. | 292. | 293. | 291. | 292. | 1.18 | 1.71 | 0.0437 | 0.849 | 0.908 | 0.997 | 0.999 | 0.942 | 0.934 |
Download Data |
Period Mean (original grids) [K] |
Model Period Mean (intersection) [K] |
Model Period Mean (complement) [K] |
Benchmark Period Mean (intersection) [K] |
Benchmark Period Mean (complement) [K] |
Bias [K] |
RMSE [K] |
Phase Shift [months] |
Bias Score [1] |
RMSE Score [1] |
Seasonal Cycle Score [1] |
Spatial Distribution Score [1] |
Interannual Variability Score [1] |
Overall Score [1] |
|||
|---|---|---|---|---|---|---|---|---|---|---|---|---|---|---|---|---|---|
| Benchmark | [-] | 304. | |||||||||||||||
| CLM4 | [-] | 305. | 305. | 304. | 304. | 304. | 1.32 | 1.70 | 0.416 | 0.310 | 0.608 | 0.944 | 1.00 | 0.907 | 0.730 | ||
| CLM4.5 | [-] | 306. | 306. | 304. | 304. | 304. | 1.65 | 1.96 | 0.410 | 0.244 | 0.639 | 0.945 | 1.00 | 0.903 | 0.728 | ||
| CLM5 | [-] | 306. | 306. | 304. | 304. | 304. | 1.72 | 2.01 | 0.388 | 0.233 | 0.648 | 0.948 | 1.00 | 0.903 | 0.730 |
Download Data |
Period Mean (original grids) [K] |
Model Period Mean (intersection) [K] |
Model Period Mean (complement) [K] |
Benchmark Period Mean (intersection) [K] |
Benchmark Period Mean (complement) [K] |
Bias [K] |
RMSE [K] |
Phase Shift [months] |
Bias Score [1] |
RMSE Score [1] |
Seasonal Cycle Score [1] |
Spatial Distribution Score [1] |
Interannual Variability Score [1] |
Overall Score [1] |
|||
|---|---|---|---|---|---|---|---|---|---|---|---|---|---|---|---|---|---|
| Benchmark | [-] | 301. | |||||||||||||||
| CLM4 | [-] | 303. | 303. | 300. | 301. | 297. | 1.63 | 1.81 | 0.319 | 0.498 | 0.763 | 0.961 | 0.999 | 0.921 | 0.817 | ||
| CLM4.5 | [-] | 303. | 303. | 300. | 301. | 297. | 1.64 | 1.80 | 0.290 | 0.497 | 0.773 | 0.965 | 0.999 | 0.926 | 0.822 | ||
| CLM5 | [-] | 303. | 303. | 300. | 301. | 297. | 1.72 | 1.88 | 0.284 | 0.481 | 0.782 | 0.964 | 0.999 | 0.926 | 0.822 |
Download Data |
Period Mean (original grids) [K] |
Model Period Mean (intersection) [K] |
Model Period Mean (complement) [K] |
Benchmark Period Mean (intersection) [K] |
Benchmark Period Mean (complement) [K] |
Bias [K] |
RMSE [K] |
Phase Shift [months] |
Bias Score [1] |
RMSE Score [1] |
Seasonal Cycle Score [1] |
Spatial Distribution Score [1] |
Interannual Variability Score [1] |
Overall Score [1] |
|||
|---|---|---|---|---|---|---|---|---|---|---|---|---|---|---|---|---|---|
| Benchmark | [-] | 290. | |||||||||||||||
| CLM4 | [-] | 292. | 292. | 293. | 290. | 289. | 1.63 | 2.42 | 0.301 | 0.555 | 0.749 | 0.960 | 0.995 | 0.911 | 0.820 | ||
| CLM4.5 | [-] | 292. | 292. | 293. | 290. | 289. | 1.53 | 2.38 | 0.290 | 0.564 | 0.748 | 0.961 | 0.994 | 0.910 | 0.821 | ||
| CLM5 | [-] | 292. | 292. | 293. | 290. | 289. | 1.69 | 2.38 | 0.285 | 0.555 | 0.763 | 0.963 | 0.995 | 0.916 | 0.826 |
Temporally integrated period mean