Mean State
Download Data |
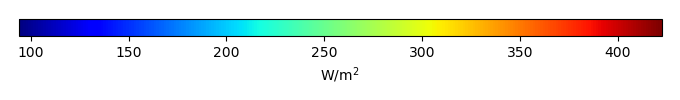
Period Mean (original grids) [W/m2] |
Model Period Mean (intersection) [W/m2] |
Model Period Mean (complement) [W/m2] |
Benchmark Period Mean (intersection) [W/m2] |
Benchmark Period Mean (complement) [W/m2] |
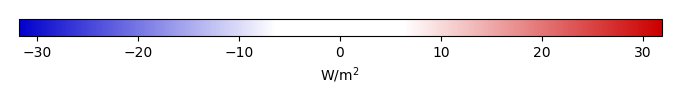
Bias [W/m2] |
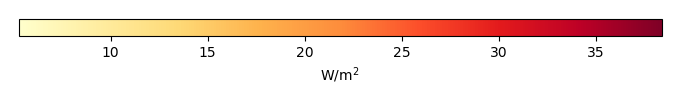
RMSE [W/m2] |
Phase Shift [months] |
Bias Score [1] |
RMSE Score [1] |
Seasonal Cycle Score [1] |
Spatial Distribution Score [1] |
Interannual Variability Score [1] |
Overall Score [1] |
|||
|---|---|---|---|---|---|---|---|---|---|---|---|---|---|---|---|---|---|
| Benchmark | [-] | 401. | |||||||||||||||
| CLM4.5SP | [-] | 397. | 398. | 400. | 415. | -1.37 | 9.58 | 1.81 | 0.505 | 0.389 | 0.734 | 0.914 | 0.650 | 0.597 | |||
| CLM4SP | [-] | 397. | 398. | 400. | 415. | -1.37 | 9.58 | 1.81 | 0.505 | 0.389 | 0.734 | 0.914 | 0.650 | 0.597 | |||
| CLM5SP | [-] | 397. | 398. | 400. | 415. | -1.37 | 9.58 | 1.81 | 0.505 | 0.389 | 0.734 | 0.914 | 0.650 | 0.597 |
Download Data |
Period Mean (original grids) [W/m2] |
Model Period Mean (intersection) [W/m2] |
Model Period Mean (complement) [W/m2] |
Benchmark Period Mean (intersection) [W/m2] |
Benchmark Period Mean (complement) [W/m2] |
Bias [W/m2] |
RMSE [W/m2] |
Phase Shift [months] |
Bias Score [1] |
RMSE Score [1] |
Seasonal Cycle Score [1] |
Spatial Distribution Score [1] |
Interannual Variability Score [1] |
Overall Score [1] |
|||
|---|---|---|---|---|---|---|---|---|---|---|---|---|---|---|---|---|---|
| Benchmark | [-] | 391. | |||||||||||||||
| CLM4.5SP | [-] | 386. | 386. | 391. | 404. | -4.87 | 12.4 | 0.491 | 0.729 | 0.661 | 0.950 | 0.915 | 0.715 | 0.772 | |||
| CLM4SP | [-] | 386. | 386. | 391. | 404. | -4.87 | 12.4 | 0.491 | 0.729 | 0.661 | 0.950 | 0.915 | 0.715 | 0.772 | |||
| CLM5SP | [-] | 386. | 386. | 391. | 404. | -4.87 | 12.4 | 0.491 | 0.729 | 0.661 | 0.950 | 0.915 | 0.715 | 0.772 |
Download Data |
Period Mean (original grids) [W/m2] |
Model Period Mean (intersection) [W/m2] |
Model Period Mean (complement) [W/m2] |
Benchmark Period Mean (intersection) [W/m2] |
Benchmark Period Mean (complement) [W/m2] |
Bias [W/m2] |
RMSE [W/m2] |
Phase Shift [months] |
Bias Score [1] |
RMSE Score [1] |
Seasonal Cycle Score [1] |
Spatial Distribution Score [1] |
Interannual Variability Score [1] |
Overall Score [1] |
|||
|---|---|---|---|---|---|---|---|---|---|---|---|---|---|---|---|---|---|
| Benchmark | [-] | 367. | |||||||||||||||
| CLM4.5SP | [-] | 361. | 361. | 366. | 384. | -2.96 | 12.2 | 0.935 | 0.713 | 0.624 | 0.879 | 0.992 | 0.747 | 0.763 | |||
| CLM4SP | [-] | 361. | 361. | 366. | 384. | -2.96 | 12.2 | 0.935 | 0.713 | 0.624 | 0.879 | 0.992 | 0.747 | 0.763 | |||
| CLM5SP | [-] | 361. | 361. | 366. | 384. | -2.96 | 12.2 | 0.935 | 0.713 | 0.624 | 0.879 | 0.992 | 0.747 | 0.763 |
Download Data |
Period Mean (original grids) [W/m2] |
Model Period Mean (intersection) [W/m2] |
Model Period Mean (complement) [W/m2] |
Benchmark Period Mean (intersection) [W/m2] |
Benchmark Period Mean (complement) [W/m2] |
Bias [W/m2] |
RMSE [W/m2] |
Phase Shift [months] |
Bias Score [1] |
RMSE Score [1] |
Seasonal Cycle Score [1] |
Spatial Distribution Score [1] |
Interannual Variability Score [1] |
Overall Score [1] |
|||
|---|---|---|---|---|---|---|---|---|---|---|---|---|---|---|---|---|---|
| Benchmark | [-] | 243. | |||||||||||||||
| CLM4.5SP | [-] | 237. | 237. | 242. | 256. | -2.60 | 13.7 | 0.123 | 0.923 | 0.802 | 0.992 | 0.992 | 0.888 | 0.900 | |||
| CLM4SP | [-] | 237. | 237. | 242. | 256. | -2.60 | 13.7 | 0.123 | 0.923 | 0.802 | 0.992 | 0.992 | 0.888 | 0.900 | |||
| CLM5SP | [-] | 237. | 237. | 242. | 256. | -2.60 | 13.7 | 0.123 | 0.923 | 0.802 | 0.992 | 0.992 | 0.888 | 0.900 |
Download Data |
Period Mean (original grids) [W/m2] |
Model Period Mean (intersection) [W/m2] |
Model Period Mean (complement) [W/m2] |
Benchmark Period Mean (intersection) [W/m2] |
Benchmark Period Mean (complement) [W/m2] |
Bias [W/m2] |
RMSE [W/m2] |
Phase Shift [months] |
Bias Score [1] |
RMSE Score [1] |
Seasonal Cycle Score [1] |
Spatial Distribution Score [1] |
Interannual Variability Score [1] |
Overall Score [1] |
|||
|---|---|---|---|---|---|---|---|---|---|---|---|---|---|---|---|---|---|
| Benchmark | [-] | 411. | |||||||||||||||
| CLM4.5SP | [-] | 411. | 411. | 409. | 416. | 3.75 | 11.6 | 1.88 | 0.366 | 0.371 | 0.709 | 0.567 | 0.747 | 0.522 | |||
| CLM4SP | [-] | 411. | 411. | 409. | 416. | 3.75 | 11.6 | 1.88 | 0.366 | 0.371 | 0.709 | 0.567 | 0.747 | 0.522 | |||
| CLM5SP | [-] | 411. | 411. | 409. | 416. | 3.75 | 11.6 | 1.88 | 0.366 | 0.371 | 0.709 | 0.567 | 0.747 | 0.522 |
Download Data |
Period Mean (original grids) [W/m2] |
Model Period Mean (intersection) [W/m2] |
Model Period Mean (complement) [W/m2] |
Benchmark Period Mean (intersection) [W/m2] |
Benchmark Period Mean (complement) [W/m2] |
Bias [W/m2] |
RMSE [W/m2] |
Phase Shift [months] |
Bias Score [1] |
RMSE Score [1] |
Seasonal Cycle Score [1] |
Spatial Distribution Score [1] |
Interannual Variability Score [1] |
Overall Score [1] |
|||
|---|---|---|---|---|---|---|---|---|---|---|---|---|---|---|---|---|---|
| Benchmark | [-] | 268. | |||||||||||||||
| CLM4.5SP | [-] | 265. | 264. | 267. | 280. | -2.61 | 10.9 | 0.0463 | 0.917 | 0.852 | 0.997 | 0.974 | 0.859 | 0.908 | |||
| CLM4SP | [-] | 265. | 264. | 267. | 280. | -2.61 | 10.9 | 0.0463 | 0.917 | 0.852 | 0.997 | 0.974 | 0.859 | 0.908 | |||
| CLM5SP | [-] | 265. | 264. | 267. | 280. | -2.61 | 10.9 | 0.0463 | 0.917 | 0.852 | 0.997 | 0.974 | 0.859 | 0.908 |
Download Data |
Period Mean (original grids) [W/m2] |
Model Period Mean (intersection) [W/m2] |
Model Period Mean (complement) [W/m2] |
Benchmark Period Mean (intersection) [W/m2] |
Benchmark Period Mean (complement) [W/m2] |
Bias [W/m2] |
RMSE [W/m2] |
Phase Shift [months] |
Bias Score [1] |
RMSE Score [1] |
Seasonal Cycle Score [1] |
Spatial Distribution Score [1] |
Interannual Variability Score [1] |
Overall Score [1] |
|||
|---|---|---|---|---|---|---|---|---|---|---|---|---|---|---|---|---|---|
| Benchmark | [-] | 297. | |||||||||||||||
| CLM4.5SP | [-] | 293. | 292. | 296. | 341. | -0.587 | 14.2 | 0.144 | 0.843 | 0.810 | 0.990 | 0.987 | 0.795 | 0.872 | |||
| CLM4SP | [-] | 293. | 292. | 296. | 341. | -0.587 | 14.2 | 0.144 | 0.843 | 0.810 | 0.990 | 0.987 | 0.795 | 0.872 | |||
| CLM5SP | [-] | 293. | 292. | 296. | 341. | -0.587 | 14.2 | 0.144 | 0.843 | 0.810 | 0.990 | 0.987 | 0.795 | 0.872 |
Download Data |
Period Mean (original grids) [W/m2] |
Model Period Mean (intersection) [W/m2] |
Model Period Mean (complement) [W/m2] |
Benchmark Period Mean (intersection) [W/m2] |
Benchmark Period Mean (complement) [W/m2] |
Bias [W/m2] |
RMSE [W/m2] |
Phase Shift [months] |
Bias Score [1] |
RMSE Score [1] |
Seasonal Cycle Score [1] |
Spatial Distribution Score [1] |
Interannual Variability Score [1] |
Overall Score [1] |
|||
|---|---|---|---|---|---|---|---|---|---|---|---|---|---|---|---|---|---|
| Benchmark | [-] | 387. | |||||||||||||||
| CLM4.5SP | [-] | 374. | 375. | 385. | 415. | -5.63 | 15.4 | 0.408 | 0.718 | 0.713 | 0.963 | 0.998 | 0.799 | 0.817 | |||
| CLM4SP | [-] | 374. | 375. | 385. | 415. | -5.63 | 15.4 | 0.408 | 0.718 | 0.713 | 0.963 | 0.998 | 0.799 | 0.817 | |||
| CLM5SP | [-] | 374. | 375. | 385. | 415. | -5.63 | 15.4 | 0.408 | 0.718 | 0.713 | 0.963 | 0.998 | 0.799 | 0.817 |
Download Data |
Period Mean (original grids) [W/m2] |
Model Period Mean (intersection) [W/m2] |
Model Period Mean (complement) [W/m2] |
Benchmark Period Mean (intersection) [W/m2] |
Benchmark Period Mean (complement) [W/m2] |
Bias [W/m2] |
RMSE [W/m2] |
Phase Shift [months] |
Bias Score [1] |
RMSE Score [1] |
Seasonal Cycle Score [1] |
Spatial Distribution Score [1] |
Interannual Variability Score [1] |
Overall Score [1] |
|||
|---|---|---|---|---|---|---|---|---|---|---|---|---|---|---|---|---|---|
| Benchmark | [-] | 249. | |||||||||||||||
| CLM4.5SP | [-] | 243. | 244. | 248. | 253. | -4.14 | 13.6 | 0.0505 | 0.917 | 0.797 | 0.997 | 0.977 | 0.914 | 0.900 | |||
| CLM4SP | [-] | 243. | 244. | 248. | 253. | -4.14 | 13.6 | 0.0505 | 0.917 | 0.797 | 0.997 | 0.977 | 0.914 | 0.900 | |||
| CLM5SP | [-] | 243. | 244. | 248. | 253. | -4.14 | 13.6 | 0.0505 | 0.917 | 0.797 | 0.997 | 0.977 | 0.914 | 0.900 |
Download Data |
Period Mean (original grids) [W/m2] |
Model Period Mean (intersection) [W/m2] |
Model Period Mean (complement) [W/m2] |
Benchmark Period Mean (intersection) [W/m2] |
Benchmark Period Mean (complement) [W/m2] |
Bias [W/m2] |
RMSE [W/m2] |
Phase Shift [months] |
Bias Score [1] |
RMSE Score [1] |
Seasonal Cycle Score [1] |
Spatial Distribution Score [1] |
Interannual Variability Score [1] |
Overall Score [1] |
|||
|---|---|---|---|---|---|---|---|---|---|---|---|---|---|---|---|---|---|
| Benchmark | [-] | 353. | |||||||||||||||
| CLM4.5SP | [-] | 351. | 351. | 352. | 359. | -0.968 | 9.75 | 0.299 | 0.865 | 0.762 | 0.980 | 0.992 | 0.867 | 0.871 | |||
| CLM4SP | [-] | 351. | 351. | 352. | 359. | -0.968 | 9.75 | 0.299 | 0.865 | 0.762 | 0.980 | 0.992 | 0.867 | 0.871 | |||
| CLM5SP | [-] | 351. | 351. | 352. | 359. | -0.968 | 9.75 | 0.299 | 0.865 | 0.762 | 0.980 | 0.992 | 0.867 | 0.871 |
Download Data |
Period Mean (original grids) [W/m2] |
Model Period Mean (intersection) [W/m2] |
Model Period Mean (complement) [W/m2] |
Benchmark Period Mean (intersection) [W/m2] |
Benchmark Period Mean (complement) [W/m2] |
Bias [W/m2] |
RMSE [W/m2] |
Phase Shift [months] |
Bias Score [1] |
RMSE Score [1] |
Seasonal Cycle Score [1] |
Spatial Distribution Score [1] |
Interannual Variability Score [1] |
Overall Score [1] |
|||
|---|---|---|---|---|---|---|---|---|---|---|---|---|---|---|---|---|---|
| Benchmark | [-] | 314. | |||||||||||||||
| CLM4.5SP | [-] | 306. | 306. | 312. | 329. | -3.25 | 11.6 | 0.223 | 0.807 | 0.752 | 0.982 | 0.997 | 0.696 | 0.831 | |||
| CLM4SP | [-] | 306. | 306. | 312. | 329. | -3.25 | 11.6 | 0.223 | 0.807 | 0.752 | 0.982 | 0.997 | 0.696 | 0.831 | |||
| CLM5SP | [-] | 306. | 306. | 312. | 329. | -3.25 | 11.6 | 0.223 | 0.807 | 0.752 | 0.982 | 0.997 | 0.696 | 0.831 |
Download Data |
Period Mean (original grids) [W/m2] |
Model Period Mean (intersection) [W/m2] |
Model Period Mean (complement) [W/m2] |
Benchmark Period Mean (intersection) [W/m2] |
Benchmark Period Mean (complement) [W/m2] |
Bias [W/m2] |
RMSE [W/m2] |
Phase Shift [months] |
Bias Score [1] |
RMSE Score [1] |
Seasonal Cycle Score [1] |
Spatial Distribution Score [1] |
Interannual Variability Score [1] |
Overall Score [1] |
|||
|---|---|---|---|---|---|---|---|---|---|---|---|---|---|---|---|---|---|
| Benchmark | [-] | 345. | |||||||||||||||
| CLM4.5SP | [-] | 309. | 309. | 315. | 360. | -2.77 | 13.1 | 0.509 | 0.757 | 0.685 | 0.941 | 0.999 | 0.796 | 0.811 | |||
| CLM4SP | [-] | 309. | 309. | 315. | 360. | -2.77 | 13.1 | 0.509 | 0.757 | 0.685 | 0.941 | 0.999 | 0.796 | 0.811 | |||
| CLM5SP | [-] | 310. | 310. | 315. | 360. | -2.77 | 13.1 | 0.509 | 0.757 | 0.685 | 0.941 | 0.999 | 0.796 | 0.811 |
Download Data |
Period Mean (original grids) [W/m2] |
Model Period Mean (intersection) [W/m2] |
Model Period Mean (complement) [W/m2] |
Benchmark Period Mean (intersection) [W/m2] |
Benchmark Period Mean (complement) [W/m2] |
Bias [W/m2] |
RMSE [W/m2] |
Phase Shift [months] |
Bias Score [1] |
RMSE Score [1] |
Seasonal Cycle Score [1] |
Spatial Distribution Score [1] |
Interannual Variability Score [1] |
Overall Score [1] |
|||
|---|---|---|---|---|---|---|---|---|---|---|---|---|---|---|---|---|---|
| Benchmark | [-] | 350. | |||||||||||||||
| CLM4.5SP | [-] | 344. | 344. | 349. | 373. | -3.78 | 14.4 | 0.431 | 0.818 | 0.734 | 0.963 | 0.989 | 0.789 | 0.838 | |||
| CLM4SP | [-] | 344. | 344. | 349. | 373. | -3.78 | 14.4 | 0.431 | 0.818 | 0.734 | 0.963 | 0.989 | 0.789 | 0.838 | |||
| CLM5SP | [-] | 344. | 344. | 349. | 373. | -3.78 | 14.4 | 0.431 | 0.818 | 0.734 | 0.963 | 0.989 | 0.789 | 0.838 |
Download Data |
Period Mean (original grids) [W/m2] |
Model Period Mean (intersection) [W/m2] |
Model Period Mean (complement) [W/m2] |
Benchmark Period Mean (intersection) [W/m2] |
Benchmark Period Mean (complement) [W/m2] |
Bias [W/m2] |
RMSE [W/m2] |
Phase Shift [months] |
Bias Score [1] |
RMSE Score [1] |
Seasonal Cycle Score [1] |
Spatial Distribution Score [1] |
Interannual Variability Score [1] |
Overall Score [1] |
|||
|---|---|---|---|---|---|---|---|---|---|---|---|---|---|---|---|---|---|
| Benchmark | [-] | 248. | |||||||||||||||
| CLM4.5SP | [-] | 243. | 243. | 247. | 258. | -4.19 | 13.4 | 0.126 | 0.901 | 0.793 | 0.992 | 1.00 | 0.895 | 0.896 | |||
| CLM4SP | [-] | 243. | 243. | 247. | 258. | -4.19 | 13.4 | 0.126 | 0.901 | 0.793 | 0.992 | 1.00 | 0.895 | 0.896 | |||
| CLM5SP | [-] | 243. | 243. | 247. | 258. | -4.19 | 13.4 | 0.126 | 0.901 | 0.793 | 0.992 | 1.00 | 0.895 | 0.896 |
Download Data |
Period Mean (original grids) [W/m2] |
Model Period Mean (intersection) [W/m2] |
Model Period Mean (complement) [W/m2] |
Benchmark Period Mean (intersection) [W/m2] |
Benchmark Period Mean (complement) [W/m2] |
Bias [W/m2] |
RMSE [W/m2] |
Phase Shift [months] |
Bias Score [1] |
RMSE Score [1] |
Seasonal Cycle Score [1] |
Spatial Distribution Score [1] |
Interannual Variability Score [1] |
Overall Score [1] |
|||
|---|---|---|---|---|---|---|---|---|---|---|---|---|---|---|---|---|---|
| Benchmark | [-] | 376. | |||||||||||||||
| CLM4.5SP | [-] | 363. | 363. | 371. | 402. | -1.23 | 14.5 | 0.704 | 0.640 | 0.676 | 0.911 | 0.994 | 0.783 | 0.780 | |||
| CLM4SP | [-] | 363. | 363. | 371. | 402. | -1.23 | 14.5 | 0.704 | 0.640 | 0.676 | 0.911 | 0.994 | 0.783 | 0.780 | |||
| CLM5SP | [-] | 363. | 363. | 371. | 402. | -1.23 | 14.5 | 0.704 | 0.640 | 0.676 | 0.911 | 0.994 | 0.783 | 0.780 |
Download Data |
Period Mean (original grids) [W/m2] |
Model Period Mean (intersection) [W/m2] |
Model Period Mean (complement) [W/m2] |
Benchmark Period Mean (intersection) [W/m2] |
Benchmark Period Mean (complement) [W/m2] |
Bias [W/m2] |
RMSE [W/m2] |
Phase Shift [months] |
Bias Score [1] |
RMSE Score [1] |
Seasonal Cycle Score [1] |
Spatial Distribution Score [1] |
Interannual Variability Score [1] |
Overall Score [1] |
|||
|---|---|---|---|---|---|---|---|---|---|---|---|---|---|---|---|---|---|
| Benchmark | [-] | 335. | |||||||||||||||
| CLM4.5SP | [-] | 328. | 328. | 333. | 372. | -2.37 | 9.63 | 0.122 | 0.919 | 0.831 | 0.992 | 1.00 | 0.814 | 0.898 | |||
| CLM4SP | [-] | 328. | 328. | 333. | 372. | -2.37 | 9.63 | 0.122 | 0.919 | 0.831 | 0.992 | 1.00 | 0.814 | 0.898 | |||
| CLM5SP | [-] | 328. | 328. | 333. | 372. | -2.37 | 9.63 | 0.122 | 0.919 | 0.831 | 0.992 | 1.00 | 0.814 | 0.898 |
Download Data |
Period Mean (original grids) [W/m2] |
Model Period Mean (intersection) [W/m2] |
Model Period Mean (complement) [W/m2] |
Benchmark Period Mean (intersection) [W/m2] |
Benchmark Period Mean (complement) [W/m2] |
Bias [W/m2] |
RMSE [W/m2] |
Phase Shift [months] |
Bias Score [1] |
RMSE Score [1] |
Seasonal Cycle Score [1] |
Spatial Distribution Score [1] |
Interannual Variability Score [1] |
Overall Score [1] |
|||
|---|---|---|---|---|---|---|---|---|---|---|---|---|---|---|---|---|---|
| Benchmark | [-] | 278. | |||||||||||||||
| CLM4.5SP | [-] | 275. | 275. | 277. | 303. | -0.971 | 9.62 | 0.0673 | 0.909 | 0.823 | 0.995 | 0.995 | 0.864 | 0.901 | |||
| CLM4SP | [-] | 275. | 275. | 277. | 303. | -0.971 | 9.62 | 0.0673 | 0.909 | 0.823 | 0.995 | 0.995 | 0.864 | 0.901 | |||
| CLM5SP | [-] | 275. | 275. | 277. | 303. | -0.971 | 9.62 | 0.0673 | 0.909 | 0.823 | 0.995 | 0.995 | 0.864 | 0.901 |
Download Data |
Period Mean (original grids) [W/m2] |
Model Period Mean (intersection) [W/m2] |
Model Period Mean (complement) [W/m2] |
Benchmark Period Mean (intersection) [W/m2] |
Benchmark Period Mean (complement) [W/m2] |
Bias [W/m2] |
RMSE [W/m2] |
Phase Shift [months] |
Bias Score [1] |
RMSE Score [1] |
Seasonal Cycle Score [1] |
Spatial Distribution Score [1] |
Interannual Variability Score [1] |
Overall Score [1] |
|||
|---|---|---|---|---|---|---|---|---|---|---|---|---|---|---|---|---|---|
| Benchmark | [-] | 298. | |||||||||||||||
| CLM4.5SP | [-] | 293. | 294. | 298. | 325. | -3.00 | 12.5 | 0.124 | 0.828 | 0.763 | 0.992 | 0.992 | 0.738 | 0.846 | |||
| CLM4SP | [-] | 293. | 294. | 298. | 325. | -3.00 | 12.5 | 0.124 | 0.828 | 0.763 | 0.992 | 0.992 | 0.738 | 0.846 | |||
| CLM5SP | [-] | 293. | 294. | 298. | 325. | -3.00 | 12.5 | 0.124 | 0.828 | 0.763 | 0.992 | 0.992 | 0.738 | 0.846 |
Download Data |
Period Mean (original grids) [W/m2] |
Model Period Mean (intersection) [W/m2] |
Model Period Mean (complement) [W/m2] |
Benchmark Period Mean (intersection) [W/m2] |
Benchmark Period Mean (complement) [W/m2] |
Bias [W/m2] |
RMSE [W/m2] |
Phase Shift [months] |
Bias Score [1] |
RMSE Score [1] |
Seasonal Cycle Score [1] |
Spatial Distribution Score [1] |
Interannual Variability Score [1] |
Overall Score [1] |
|||
|---|---|---|---|---|---|---|---|---|---|---|---|---|---|---|---|---|---|
| Benchmark | [-] | 410. | |||||||||||||||
| CLM4.5SP | [-] | 406. | 406. | 410. | 415. | -2.98 | 10.8 | 1.26 | 0.546 | 0.467 | 0.837 | 0.978 | 0.774 | 0.678 | |||
| CLM4SP | [-] | 406. | 406. | 410. | 415. | -2.98 | 10.8 | 1.26 | 0.546 | 0.467 | 0.837 | 0.978 | 0.774 | 0.678 | |||
| CLM5SP | [-] | 406. | 406. | 410. | 415. | -2.98 | 10.8 | 1.26 | 0.546 | 0.467 | 0.837 | 0.978 | 0.774 | 0.678 |
Download Data |
Period Mean (original grids) [W/m2] |
Model Period Mean (intersection) [W/m2] |
Model Period Mean (complement) [W/m2] |
Benchmark Period Mean (intersection) [W/m2] |
Benchmark Period Mean (complement) [W/m2] |
Bias [W/m2] |
RMSE [W/m2] |
Phase Shift [months] |
Bias Score [1] |
RMSE Score [1] |
Seasonal Cycle Score [1] |
Spatial Distribution Score [1] |
Interannual Variability Score [1] |
Overall Score [1] |
|||
|---|---|---|---|---|---|---|---|---|---|---|---|---|---|---|---|---|---|
| Benchmark | [-] | 379. | |||||||||||||||
| CLM4.5SP | [-] | 377. | 376. | 380. | 374. | -2.98 | 11.2 | 0.680 | 0.765 | 0.650 | 0.935 | 0.994 | 0.845 | 0.807 | |||
| CLM4SP | [-] | 377. | 376. | 380. | 374. | -2.98 | 11.2 | 0.680 | 0.765 | 0.650 | 0.935 | 0.994 | 0.845 | 0.807 | |||
| CLM5SP | [-] | 377. | 376. | 380. | 374. | -2.98 | 11.2 | 0.680 | 0.765 | 0.650 | 0.935 | 0.994 | 0.845 | 0.807 |
Download Data |
Period Mean (original grids) [W/m2] |
Model Period Mean (intersection) [W/m2] |
Model Period Mean (complement) [W/m2] |
Benchmark Period Mean (intersection) [W/m2] |
Benchmark Period Mean (complement) [W/m2] |
Bias [W/m2] |
RMSE [W/m2] |
Phase Shift [months] |
Bias Score [1] |
RMSE Score [1] |
Seasonal Cycle Score [1] |
Spatial Distribution Score [1] |
Interannual Variability Score [1] |
Overall Score [1] |
|||
|---|---|---|---|---|---|---|---|---|---|---|---|---|---|---|---|---|---|
| Benchmark | [-] | 303. | |||||||||||||||
| CLM4.5SP | [-] | 301. | 301. | 298. | 346. | 6.58 | 22.1 | 0.556 | 0.480 | 0.531 | 0.953 | 0.929 | 0.746 | 0.695 | |||
| CLM4SP | [-] | 301. | 301. | 298. | 346. | 6.58 | 22.1 | 0.556 | 0.480 | 0.531 | 0.953 | 0.929 | 0.746 | 0.695 | |||
| CLM5SP | [-] | 301. | 301. | 298. | 346. | 6.58 | 22.1 | 0.556 | 0.480 | 0.531 | 0.953 | 0.929 | 0.746 | 0.695 |
Temporally integrated period mean