Mean State
Download Data |
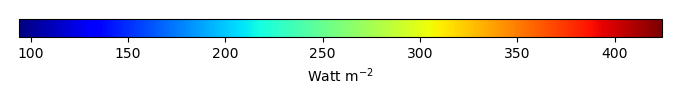
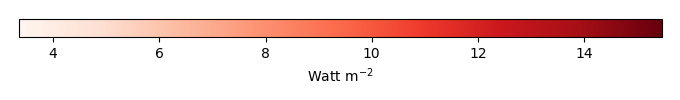
Period Mean (original grids) [Watt m-2] |
Model Period Mean (intersection) [Watt m-2] |
Model Period Mean (complement) [Watt m-2] |
Benchmark Period Mean (intersection) [Watt m-2] |
Benchmark Period Mean (complement) [Watt m-2] |
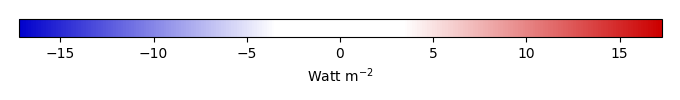
Bias [Watt m-2] |
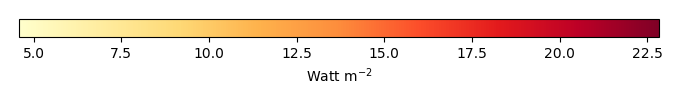
RMSE [Watt m-2] |
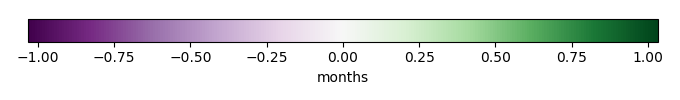
Phase Shift [months] |
Bias Score [1] |
RMSE Score [1] |
Seasonal Cycle Score [1] |
Spatial Distribution Score [1] |
Interannual Variability Score [1] |
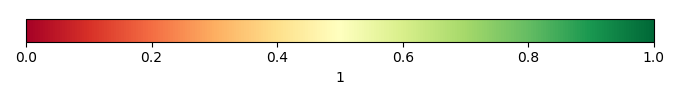
Overall Score [1] |
|||
|---|---|---|---|---|---|---|---|---|---|---|---|---|---|---|---|---|---|
| Benchmark | [-] | 397. | |||||||||||||||
| CLM4.5SP | [-] | 395. | 395. | 396. | 408. | -0.219 | 6.93 | 0.212 | 0.821 | 0.497 | 0.974 | 0.999 | 0.754 | 0.757 | |||
| CLM4SP | [-] | 395. | 395. | 396. | 408. | -0.219 | 6.93 | 0.212 | 0.821 | 0.497 | 0.974 | 0.999 | 0.754 | 0.757 | |||
| CLM5SP | [-] | 395. | 395. | 396. | 408. | -0.219 | 6.93 | 0.212 | 0.821 | 0.497 | 0.974 | 0.999 | 0.754 | 0.757 |
Download Data |
Period Mean (original grids) [Watt m-2] |
Model Period Mean (intersection) [Watt m-2] |
Model Period Mean (complement) [Watt m-2] |
Benchmark Period Mean (intersection) [Watt m-2] |
Benchmark Period Mean (complement) [Watt m-2] |
Bias [Watt m-2] |
RMSE [Watt m-2] |
Phase Shift [months] |
Bias Score [1] |
RMSE Score [1] |
Seasonal Cycle Score [1] |
Spatial Distribution Score [1] |
Interannual Variability Score [1] |
Overall Score [1] |
|||
|---|---|---|---|---|---|---|---|---|---|---|---|---|---|---|---|---|---|
| Benchmark | [-] | 384. | |||||||||||||||
| CLM4.5SP | [-] | 384. | 384. | 384. | 397. | -0.0965 | 9.48 | 0.181 | 0.904 | 0.688 | 0.985 | 0.999 | 0.910 | 0.862 | |||
| CLM4SP | [-] | 384. | 384. | 384. | 397. | -0.0965 | 9.48 | 0.181 | 0.904 | 0.688 | 0.985 | 0.999 | 0.910 | 0.862 | |||
| CLM5SP | [-] | 384. | 384. | 384. | 397. | -0.0965 | 9.48 | 0.181 | 0.904 | 0.688 | 0.985 | 0.999 | 0.910 | 0.862 |
Download Data |
Period Mean (original grids) [Watt m-2] |
Model Period Mean (intersection) [Watt m-2] |
Model Period Mean (complement) [Watt m-2] |
Benchmark Period Mean (intersection) [Watt m-2] |
Benchmark Period Mean (complement) [Watt m-2] |
Bias [Watt m-2] |
RMSE [Watt m-2] |
Phase Shift [months] |
Bias Score [1] |
RMSE Score [1] |
Seasonal Cycle Score [1] |
Spatial Distribution Score [1] |
Interannual Variability Score [1] |
Overall Score [1] |
|||
|---|---|---|---|---|---|---|---|---|---|---|---|---|---|---|---|---|---|
| Benchmark | [-] | 362. | |||||||||||||||
| CLM4.5SP | [-] | 359. | 359. | 361. | 382. | 0.0495 | 8.96 | 0.237 | 0.879 | 0.702 | 0.971 | 1.00 | 0.852 | 0.851 | |||
| CLM4SP | [-] | 359. | 359. | 361. | 382. | 0.0495 | 8.96 | 0.237 | 0.879 | 0.702 | 0.971 | 1.00 | 0.852 | 0.851 | |||
| CLM5SP | [-] | 359. | 359. | 361. | 382. | 0.0495 | 8.96 | 0.237 | 0.879 | 0.702 | 0.971 | 1.00 | 0.852 | 0.851 |
Download Data |
Period Mean (original grids) [Watt m-2] |
Model Period Mean (intersection) [Watt m-2] |
Model Period Mean (complement) [Watt m-2] |
Benchmark Period Mean (intersection) [Watt m-2] |
Benchmark Period Mean (complement) [Watt m-2] |
Bias [Watt m-2] |
RMSE [Watt m-2] |
Phase Shift [months] |
Bias Score [1] |
RMSE Score [1] |
Seasonal Cycle Score [1] |
Spatial Distribution Score [1] |
Interannual Variability Score [1] |
Overall Score [1] |
|||
|---|---|---|---|---|---|---|---|---|---|---|---|---|---|---|---|---|---|
| Benchmark | [-] | 239. | |||||||||||||||
| CLM4.5SP | [-] | 236. | 236. | 238. | 251. | 0.254 | 9.46 | 0.0140 | 0.964 | 0.834 | 0.999 | 1.00 | 0.887 | 0.920 | |||
| CLM4SP | [-] | 236. | 236. | 238. | 251. | 0.254 | 9.46 | 0.0140 | 0.964 | 0.834 | 0.999 | 1.00 | 0.887 | 0.920 | |||
| CLM5SP | [-] | 236. | 236. | 238. | 251. | 0.254 | 9.46 | 0.0140 | 0.964 | 0.834 | 0.999 | 1.00 | 0.887 | 0.920 |
Download Data |
Period Mean (original grids) [Watt m-2] |
Model Period Mean (intersection) [Watt m-2] |
Model Period Mean (complement) [Watt m-2] |
Benchmark Period Mean (intersection) [Watt m-2] |
Benchmark Period Mean (complement) [Watt m-2] |
Bias [Watt m-2] |
RMSE [Watt m-2] |
Phase Shift [months] |
Bias Score [1] |
RMSE Score [1] |
Seasonal Cycle Score [1] |
Spatial Distribution Score [1] |
Interannual Variability Score [1] |
Overall Score [1] |
|||
|---|---|---|---|---|---|---|---|---|---|---|---|---|---|---|---|---|---|
| Benchmark | [-] | 411. | |||||||||||||||
| CLM4.5SP | [-] | 408. | 408. | 410. | 415. | 0.0344 | 5.44 | 0.531 | 0.668 | 0.397 | 0.922 | 0.993 | 0.736 | 0.686 | |||
| CLM4SP | [-] | 408. | 408. | 410. | 415. | 0.0344 | 5.44 | 0.531 | 0.668 | 0.397 | 0.922 | 0.993 | 0.736 | 0.686 | |||
| CLM5SP | [-] | 408. | 408. | 410. | 415. | 0.0344 | 5.44 | 0.531 | 0.668 | 0.397 | 0.922 | 0.993 | 0.736 | 0.686 |
Download Data |
Period Mean (original grids) [Watt m-2] |
Model Period Mean (intersection) [Watt m-2] |
Model Period Mean (complement) [Watt m-2] |
Benchmark Period Mean (intersection) [Watt m-2] |
Benchmark Period Mean (complement) [Watt m-2] |
Bias [Watt m-2] |
RMSE [Watt m-2] |
Phase Shift [months] |
Bias Score [1] |
RMSE Score [1] |
Seasonal Cycle Score [1] |
Spatial Distribution Score [1] |
Interannual Variability Score [1] |
Overall Score [1] |
|||
|---|---|---|---|---|---|---|---|---|---|---|---|---|---|---|---|---|---|
| Benchmark | [-] | 264. | |||||||||||||||
| CLM4.5SP | [-] | 264. | 263. | 264. | 277. | 0.0194 | 8.45 | 0.00704 | 0.975 | 0.861 | 1.00 | 1.00 | 0.811 | 0.918 | |||
| CLM4SP | [-] | 264. | 263. | 264. | 277. | 0.0194 | 8.45 | 0.00704 | 0.975 | 0.861 | 1.00 | 1.00 | 0.811 | 0.918 | |||
| CLM5SP | [-] | 264. | 263. | 264. | 277. | 0.0194 | 8.45 | 0.00704 | 0.975 | 0.861 | 1.00 | 1.00 | 0.811 | 0.918 |
Download Data |
Period Mean (original grids) [Watt m-2] |
Model Period Mean (intersection) [Watt m-2] |
Model Period Mean (complement) [Watt m-2] |
Benchmark Period Mean (intersection) [Watt m-2] |
Benchmark Period Mean (complement) [Watt m-2] |
Bias [Watt m-2] |
RMSE [Watt m-2] |
Phase Shift [months] |
Bias Score [1] |
RMSE Score [1] |
Seasonal Cycle Score [1] |
Spatial Distribution Score [1] |
Interannual Variability Score [1] |
Overall Score [1] |
|||
|---|---|---|---|---|---|---|---|---|---|---|---|---|---|---|---|---|---|
| Benchmark | [-] | 294. | |||||||||||||||
| CLM4.5SP | [-] | 291. | 291. | 293. | 336. | 0.277 | 9.99 | 0.0242 | 0.939 | 0.825 | 0.998 | 1.00 | 0.784 | 0.895 | |||
| CLM4SP | [-] | 291. | 291. | 293. | 336. | 0.277 | 9.99 | 0.0242 | 0.939 | 0.825 | 0.998 | 1.00 | 0.784 | 0.895 | |||
| CLM5SP | [-] | 291. | 291. | 293. | 336. | 0.277 | 9.99 | 0.0242 | 0.939 | 0.825 | 0.998 | 1.00 | 0.784 | 0.895 |
Download Data |
Period Mean (original grids) [Watt m-2] |
Model Period Mean (intersection) [Watt m-2] |
Model Period Mean (complement) [Watt m-2] |
Benchmark Period Mean (intersection) [Watt m-2] |
Benchmark Period Mean (complement) [Watt m-2] |
Bias [Watt m-2] |
RMSE [Watt m-2] |
Phase Shift [months] |
Bias Score [1] |
RMSE Score [1] |
Seasonal Cycle Score [1] |
Spatial Distribution Score [1] |
Interannual Variability Score [1] |
Overall Score [1] |
|||
|---|---|---|---|---|---|---|---|---|---|---|---|---|---|---|---|---|---|
| Benchmark | [-] | 379. | |||||||||||||||
| CLM4.5SP | [-] | 371. | 372. | 377. | 410. | -0.454 | 9.29 | 0.100 | 0.882 | 0.746 | 0.991 | 1.00 | 0.877 | 0.874 | |||
| CLM4SP | [-] | 371. | 372. | 377. | 410. | -0.454 | 9.29 | 0.100 | 0.882 | 0.746 | 0.991 | 1.00 | 0.877 | 0.874 | |||
| CLM5SP | [-] | 371. | 372. | 377. | 410. | -0.454 | 9.29 | 0.100 | 0.882 | 0.746 | 0.991 | 1.00 | 0.877 | 0.874 |
Download Data |
Period Mean (original grids) [Watt m-2] |
Model Period Mean (intersection) [Watt m-2] |
Model Period Mean (complement) [Watt m-2] |
Benchmark Period Mean (intersection) [Watt m-2] |
Benchmark Period Mean (complement) [Watt m-2] |
Bias [Watt m-2] |
RMSE [Watt m-2] |
Phase Shift [months] |
Bias Score [1] |
RMSE Score [1] |
Seasonal Cycle Score [1] |
Spatial Distribution Score [1] |
Interannual Variability Score [1] |
Overall Score [1] |
|||
|---|---|---|---|---|---|---|---|---|---|---|---|---|---|---|---|---|---|
| Benchmark | [-] | 244. | |||||||||||||||
| CLM4.5SP | [-] | 243. | 243. | 244. | 248. | 0.0310 | 8.41 | 0.00100 | 0.978 | 0.842 | 1.00 | 1.00 | 0.883 | 0.924 | |||
| CLM4SP | [-] | 243. | 243. | 244. | 248. | 0.0310 | 8.41 | 0.00100 | 0.978 | 0.842 | 1.00 | 1.00 | 0.883 | 0.924 | |||
| CLM5SP | [-] | 243. | 243. | 244. | 248. | 0.0310 | 8.41 | 0.00100 | 0.978 | 0.842 | 1.00 | 1.00 | 0.883 | 0.924 |
Download Data |
Period Mean (original grids) [Watt m-2] |
Model Period Mean (intersection) [Watt m-2] |
Model Period Mean (complement) [Watt m-2] |
Benchmark Period Mean (intersection) [Watt m-2] |
Benchmark Period Mean (complement) [Watt m-2] |
Bias [Watt m-2] |
RMSE [Watt m-2] |
Phase Shift [months] |
Bias Score [1] |
RMSE Score [1] |
Seasonal Cycle Score [1] |
Spatial Distribution Score [1] |
Interannual Variability Score [1] |
Overall Score [1] |
|||
|---|---|---|---|---|---|---|---|---|---|---|---|---|---|---|---|---|---|
| Benchmark | [-] | 351. | |||||||||||||||
| CLM4.5SP | [-] | 350. | 350. | 350. | 359. | 0.0571 | 7.85 | 0.104 | 0.931 | 0.779 | 0.993 | 1.00 | 0.909 | 0.899 | |||
| CLM4SP | [-] | 350. | 350. | 350. | 359. | 0.0571 | 7.85 | 0.104 | 0.931 | 0.779 | 0.993 | 1.00 | 0.909 | 0.899 | |||
| CLM5SP | [-] | 350. | 350. | 350. | 359. | 0.0571 | 7.85 | 0.104 | 0.931 | 0.779 | 0.993 | 1.00 | 0.909 | 0.899 |
Download Data |
Period Mean (original grids) [Watt m-2] |
Model Period Mean (intersection) [Watt m-2] |
Model Period Mean (complement) [Watt m-2] |
Benchmark Period Mean (intersection) [Watt m-2] |
Benchmark Period Mean (complement) [Watt m-2] |
Bias [Watt m-2] |
RMSE [Watt m-2] |
Phase Shift [months] |
Bias Score [1] |
RMSE Score [1] |
Seasonal Cycle Score [1] |
Spatial Distribution Score [1] |
Interannual Variability Score [1] |
Overall Score [1] |
|||
|---|---|---|---|---|---|---|---|---|---|---|---|---|---|---|---|---|---|
| Benchmark | [-] | 308. | |||||||||||||||
| CLM4.5SP | [-] | 304. | 304. | 307. | 324. | 0.0546 | 8.06 | 0.0712 | 0.930 | 0.782 | 0.995 | 1.00 | 0.739 | 0.871 | |||
| CLM4SP | [-] | 304. | 304. | 307. | 324. | 0.0546 | 8.06 | 0.0712 | 0.930 | 0.782 | 0.995 | 1.00 | 0.739 | 0.871 | |||
| CLM5SP | [-] | 304. | 304. | 307. | 324. | 0.0546 | 8.06 | 0.0712 | 0.930 | 0.782 | 0.995 | 1.00 | 0.739 | 0.871 |
Download Data |
Period Mean (original grids) [Watt m-2] |
Model Period Mean (intersection) [Watt m-2] |
Model Period Mean (complement) [Watt m-2] |
Benchmark Period Mean (intersection) [Watt m-2] |
Benchmark Period Mean (complement) [Watt m-2] |
Bias [Watt m-2] |
RMSE [Watt m-2] |
Phase Shift [months] |
Bias Score [1] |
RMSE Score [1] |
Seasonal Cycle Score [1] |
Spatial Distribution Score [1] |
Interannual Variability Score [1] |
Overall Score [1] |
|||
|---|---|---|---|---|---|---|---|---|---|---|---|---|---|---|---|---|---|
| Benchmark | [-] | 344. | |||||||||||||||
| CLM4.5SP | [-] | 308. | 308. | 311. | 360. | -0.0963 | 9.16 | 0.113 | 0.894 | 0.716 | 0.987 | 1.00 | 0.838 | 0.858 | |||
| CLM4SP | [-] | 308. | 308. | 311. | 360. | -0.0963 | 9.16 | 0.113 | 0.894 | 0.716 | 0.987 | 1.00 | 0.838 | 0.858 | |||
| CLM5SP | [-] | 308. | 308. | 311. | 360. | -0.0963 | 9.16 | 0.113 | 0.894 | 0.716 | 0.987 | 1.00 | 0.838 | 0.858 |
Download Data |
Period Mean (original grids) [Watt m-2] |
Model Period Mean (intersection) [Watt m-2] |
Model Period Mean (complement) [Watt m-2] |
Benchmark Period Mean (intersection) [Watt m-2] |
Benchmark Period Mean (complement) [Watt m-2] |
Bias [Watt m-2] |
RMSE [Watt m-2] |
Phase Shift [months] |
Bias Score [1] |
RMSE Score [1] |
Seasonal Cycle Score [1] |
Spatial Distribution Score [1] |
Interannual Variability Score [1] |
Overall Score [1] |
|||
|---|---|---|---|---|---|---|---|---|---|---|---|---|---|---|---|---|---|
| Benchmark | [-] | 343. | |||||||||||||||
| CLM4.5SP | [-] | 342. | 342. | 343. | 360. | 0.000187 | 11.3 | 0.0949 | 0.917 | 0.723 | 0.990 | 1.00 | 0.894 | 0.874 | |||
| CLM4SP | [-] | 342. | 342. | 343. | 360. | 0.000187 | 11.3 | 0.0949 | 0.917 | 0.723 | 0.990 | 1.00 | 0.894 | 0.874 | |||
| CLM5SP | [-] | 342. | 342. | 343. | 360. | 0.000187 | 11.3 | 0.0949 | 0.917 | 0.723 | 0.990 | 1.00 | 0.894 | 0.874 |
Download Data |
Period Mean (original grids) [Watt m-2] |
Model Period Mean (intersection) [Watt m-2] |
Model Period Mean (complement) [Watt m-2] |
Benchmark Period Mean (intersection) [Watt m-2] |
Benchmark Period Mean (complement) [Watt m-2] |
Bias [Watt m-2] |
RMSE [Watt m-2] |
Phase Shift [months] |
Bias Score [1] |
RMSE Score [1] |
Seasonal Cycle Score [1] |
Spatial Distribution Score [1] |
Interannual Variability Score [1] |
Overall Score [1] |
|||
|---|---|---|---|---|---|---|---|---|---|---|---|---|---|---|---|---|---|
| Benchmark | [-] | 244. | |||||||||||||||
| CLM4.5SP | [-] | 243. | 243. | 243. | 253. | -0.0103 | 8.60 | 0.0247 | 0.965 | 0.833 | 0.998 | 1.00 | 0.881 | 0.919 | |||
| CLM4SP | [-] | 243. | 243. | 243. | 253. | -0.0103 | 8.60 | 0.0247 | 0.965 | 0.833 | 0.998 | 1.00 | 0.881 | 0.919 | |||
| CLM5SP | [-] | 243. | 243. | 243. | 253. | -0.0103 | 8.60 | 0.0247 | 0.965 | 0.833 | 0.998 | 1.00 | 0.881 | 0.919 |
Download Data |
Period Mean (original grids) [Watt m-2] |
Model Period Mean (intersection) [Watt m-2] |
Model Period Mean (complement) [Watt m-2] |
Benchmark Period Mean (intersection) [Watt m-2] |
Benchmark Period Mean (complement) [Watt m-2] |
Bias [Watt m-2] |
RMSE [Watt m-2] |
Phase Shift [months] |
Bias Score [1] |
RMSE Score [1] |
Seasonal Cycle Score [1] |
Spatial Distribution Score [1] |
Interannual Variability Score [1] |
Overall Score [1] |
|||
|---|---|---|---|---|---|---|---|---|---|---|---|---|---|---|---|---|---|
| Benchmark | [-] | 374. | |||||||||||||||
| CLM4.5SP | [-] | 362. | 362. | 369. | 398. | 0.0604 | 9.12 | 0.254 | 0.816 | 0.684 | 0.968 | 1.00 | 0.867 | 0.837 | |||
| CLM4SP | [-] | 362. | 362. | 369. | 398. | 0.0604 | 9.12 | 0.254 | 0.816 | 0.684 | 0.968 | 1.00 | 0.867 | 0.837 | |||
| CLM5SP | [-] | 362. | 362. | 369. | 398. | 0.0604 | 9.12 | 0.254 | 0.816 | 0.684 | 0.968 | 1.00 | 0.867 | 0.837 |
Download Data |
Period Mean (original grids) [Watt m-2] |
Model Period Mean (intersection) [Watt m-2] |
Model Period Mean (complement) [Watt m-2] |
Benchmark Period Mean (intersection) [Watt m-2] |
Benchmark Period Mean (complement) [Watt m-2] |
Bias [Watt m-2] |
RMSE [Watt m-2] |
Phase Shift [months] |
Bias Score [1] |
RMSE Score [1] |
Seasonal Cycle Score [1] |
Spatial Distribution Score [1] |
Interannual Variability Score [1] |
Overall Score [1] |
|||
|---|---|---|---|---|---|---|---|---|---|---|---|---|---|---|---|---|---|
| Benchmark | [-] | 332. | |||||||||||||||
| CLM4.5SP | [-] | 328. | 328. | 331. | 370. | -0.0972 | 7.51 | 0.0275 | 0.951 | 0.841 | 0.998 | 1.00 | 0.841 | 0.912 | |||
| CLM4SP | [-] | 328. | 328. | 331. | 370. | -0.0972 | 7.51 | 0.0275 | 0.951 | 0.841 | 0.998 | 1.00 | 0.841 | 0.912 | |||
| CLM5SP | [-] | 328. | 328. | 331. | 370. | -0.0972 | 7.51 | 0.0275 | 0.951 | 0.841 | 0.998 | 1.00 | 0.841 | 0.912 |
Download Data |
Period Mean (original grids) [Watt m-2] |
Model Period Mean (intersection) [Watt m-2] |
Model Period Mean (complement) [Watt m-2] |
Benchmark Period Mean (intersection) [Watt m-2] |
Benchmark Period Mean (complement) [Watt m-2] |
Bias [Watt m-2] |
RMSE [Watt m-2] |
Phase Shift [months] |
Bias Score [1] |
RMSE Score [1] |
Seasonal Cycle Score [1] |
Spatial Distribution Score [1] |
Interannual Variability Score [1] |
Overall Score [1] |
|||
|---|---|---|---|---|---|---|---|---|---|---|---|---|---|---|---|---|---|
| Benchmark | [-] | 277. | |||||||||||||||
| CLM4.5SP | [-] | 274. | 275. | 276. | 298. | -0.0815 | 7.66 | 0.0260 | 0.950 | 0.841 | 0.998 | 1.00 | 0.828 | 0.910 | |||
| CLM4SP | [-] | 274. | 275. | 276. | 298. | -0.0815 | 7.66 | 0.0260 | 0.950 | 0.841 | 0.998 | 1.00 | 0.828 | 0.910 | |||
| CLM5SP | [-] | 274. | 275. | 276. | 298. | -0.0815 | 7.66 | 0.0260 | 0.950 | 0.841 | 0.998 | 1.00 | 0.828 | 0.910 |
Download Data |
Period Mean (original grids) [Watt m-2] |
Model Period Mean (intersection) [Watt m-2] |
Model Period Mean (complement) [Watt m-2] |
Benchmark Period Mean (intersection) [Watt m-2] |
Benchmark Period Mean (complement) [Watt m-2] |
Bias [Watt m-2] |
RMSE [Watt m-2] |
Phase Shift [months] |
Bias Score [1] |
RMSE Score [1] |
Seasonal Cycle Score [1] |
Spatial Distribution Score [1] |
Interannual Variability Score [1] |
Overall Score [1] |
|||
|---|---|---|---|---|---|---|---|---|---|---|---|---|---|---|---|---|---|
| Benchmark | [-] | 296. | |||||||||||||||
| CLM4.5SP | [-] | 293. | 294. | 295. | 324. | -0.178 | 9.51 | 0.0536 | 0.911 | 0.770 | 0.996 | 1.00 | 0.791 | 0.873 | |||
| CLM4SP | [-] | 293. | 294. | 295. | 324. | -0.178 | 9.51 | 0.0536 | 0.911 | 0.770 | 0.996 | 1.00 | 0.791 | 0.873 | |||
| CLM5SP | [-] | 293. | 294. | 295. | 324. | -0.178 | 9.51 | 0.0536 | 0.911 | 0.770 | 0.996 | 1.00 | 0.791 | 0.873 |
Download Data |
Period Mean (original grids) [Watt m-2] |
Model Period Mean (intersection) [Watt m-2] |
Model Period Mean (complement) [Watt m-2] |
Benchmark Period Mean (intersection) [Watt m-2] |
Benchmark Period Mean (complement) [Watt m-2] |
Bias [Watt m-2] |
RMSE [Watt m-2] |
Phase Shift [months] |
Bias Score [1] |
RMSE Score [1] |
Seasonal Cycle Score [1] |
Spatial Distribution Score [1] |
Interannual Variability Score [1] |
Overall Score [1] |
|||
|---|---|---|---|---|---|---|---|---|---|---|---|---|---|---|---|---|---|
| Benchmark | [-] | 406. | |||||||||||||||
| CLM4.5SP | [-] | 405. | 405. | 405. | 410. | -0.270 | 6.26 | 0.342 | 0.796 | 0.499 | 0.953 | 1.00 | 0.824 | 0.762 | |||
| CLM4SP | [-] | 405. | 405. | 405. | 410. | -0.270 | 6.26 | 0.342 | 0.796 | 0.499 | 0.953 | 1.00 | 0.824 | 0.762 | |||
| CLM5SP | [-] | 405. | 405. | 405. | 410. | -0.270 | 6.26 | 0.342 | 0.796 | 0.499 | 0.953 | 1.00 | 0.824 | 0.762 |
Download Data |
Period Mean (original grids) [Watt m-2] |
Model Period Mean (intersection) [Watt m-2] |
Model Period Mean (complement) [Watt m-2] |
Benchmark Period Mean (intersection) [Watt m-2] |
Benchmark Period Mean (complement) [Watt m-2] |
Bias [Watt m-2] |
RMSE [Watt m-2] |
Phase Shift [months] |
Bias Score [1] |
RMSE Score [1] |
Seasonal Cycle Score [1] |
Spatial Distribution Score [1] |
Interannual Variability Score [1] |
Overall Score [1] |
|||
|---|---|---|---|---|---|---|---|---|---|---|---|---|---|---|---|---|---|
| Benchmark | [-] | 376. | |||||||||||||||
| CLM4.5SP | [-] | 376. | 375. | 376. | 374. | -0.175 | 9.06 | 0.144 | 0.889 | 0.661 | 0.985 | 1.00 | 0.837 | 0.839 | |||
| CLM4SP | [-] | 376. | 375. | 376. | 374. | -0.175 | 9.06 | 0.144 | 0.889 | 0.661 | 0.985 | 1.00 | 0.837 | 0.839 | |||
| CLM5SP | [-] | 376. | 375. | 376. | 374. | -0.175 | 9.06 | 0.144 | 0.889 | 0.661 | 0.985 | 1.00 | 0.837 | 0.839 |
Download Data |
Period Mean (original grids) [Watt m-2] |
Model Period Mean (intersection) [Watt m-2] |
Model Period Mean (complement) [Watt m-2] |
Benchmark Period Mean (intersection) [Watt m-2] |
Benchmark Period Mean (complement) [Watt m-2] |
Bias [Watt m-2] |
RMSE [Watt m-2] |
Phase Shift [months] |
Bias Score [1] |
RMSE Score [1] |
Seasonal Cycle Score [1] |
Spatial Distribution Score [1] |
Interannual Variability Score [1] |
Overall Score [1] |
|||
|---|---|---|---|---|---|---|---|---|---|---|---|---|---|---|---|---|---|
| Benchmark | [-] | 307. | |||||||||||||||
| CLM4.5SP | [-] | 301. | 301. | 303. | 340. | 1.13 | 13.5 | 0.185 | 0.721 | 0.579 | 0.981 | 0.998 | 0.747 | 0.768 | |||
| CLM4SP | [-] | 301. | 301. | 303. | 340. | 1.13 | 13.5 | 0.185 | 0.721 | 0.579 | 0.981 | 0.998 | 0.747 | 0.768 | |||
| CLM5SP | [-] | 301. | 301. | 303. | 340. | 1.13 | 13.5 | 0.185 | 0.721 | 0.579 | 0.981 | 0.998 | 0.747 | 0.768 |
Temporally integrated period mean