Mean State
Download Data |
Period Mean (original grids) [Pg] |
Model Period Mean (intersection) [Pg] |
Model Period Mean (complement) [Pg] |
Benchmark Period Mean (intersection) [Pg] |
Benchmark Period Mean (complement) [Pg] |
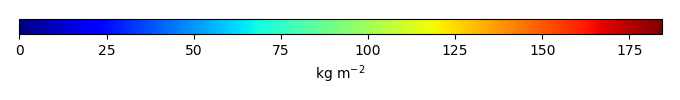
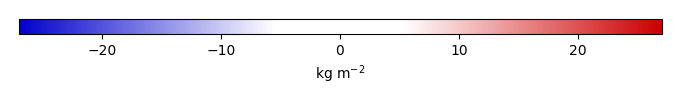
Bias [kg m-2] |
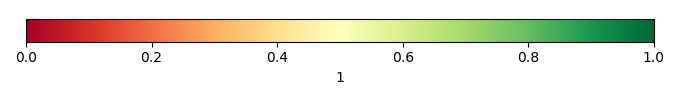
Bias Score [1] |
Spatial Distribution Score [1] |
Overall Score [1] |
|||
|---|---|---|---|---|---|---|---|---|---|---|---|---|
| Benchmark | [-] | 34.1 | ||||||||||
| CRUNCEPv7 | [-] | 41.4 | 42.1 | 0.279 | 33.8 | 0.315 | 2.30 | 0.62 | 0.80 | 0.71 | ||
| GSWP3v1 | [-] | 30.5 | 30.9 | 0.269 | 33.8 | 0.315 | -0.226 | 0.73 | 0.95 | 0.84 | ||
| WATCH | [-] | 25.6 | 26.2 | 0.188 | 33.8 | 0.315 | -1.35 | 0.74 | 0.86 | 0.80 |
Download Data |
Period Mean (original grids) [Pg] |
Model Period Mean (intersection) [Pg] |
Model Period Mean (complement) [Pg] |
Benchmark Period Mean (intersection) [Pg] |
Benchmark Period Mean (complement) [Pg] |
Bias [kg m-2] |
Bias Score [1] |
Spatial Distribution Score [1] |
Overall Score [1] |
|||
|---|---|---|---|---|---|---|---|---|---|---|---|---|
| Benchmark | [-] | 44.8 | ||||||||||
| CRUNCEPv7 | [-] | 17.5 | 16.5 | 0.0170 | 44.4 | 0.478 | -4.09 | 0.51 | 0.85 | 0.68 | ||
| GSWP3v1 | [-] | 15.3 | 14.4 | 0.0241 | 44.4 | 0.478 | -4.37 | 0.50 | 0.78 | 0.64 | ||
| WATCH | [-] | 17.4 | 16.5 | 0.0314 | 44.4 | 0.478 | -4.07 | 0.53 | 0.82 | 0.67 |
Download Data |
Period Mean (original grids) [Pg] |
Model Period Mean (intersection) [Pg] |
Model Period Mean (complement) [Pg] |
Benchmark Period Mean (intersection) [Pg] |
Benchmark Period Mean (complement) [Pg] |
Bias [kg m-2] |
Bias Score [1] |
Spatial Distribution Score [1] |
Overall Score [1] |
|||
|---|---|---|---|---|---|---|---|---|---|---|---|---|
| Benchmark | [-] | 60.1 | ||||||||||
| CRUNCEPv7 | [-] | 40.1 | 38.8 | 0.989 | 59.3 | 0.762 | -1.70 | 0.59 | 0.79 | 0.69 | ||
| GSWP3v1 | [-] | 28.7 | 27.8 | 0.749 | 59.3 | 0.762 | -2.94 | 0.55 | 0.84 | 0.69 | ||
| WATCH | [-] | 32.4 | 31.6 | 0.679 | 59.3 | 0.762 | -2.57 | 0.59 | 0.88 | 0.74 |
Download Data |
Period Mean (original grids) [Pg] |
Model Period Mean (intersection) [Pg] |
Model Period Mean (complement) [Pg] |
Benchmark Period Mean (intersection) [Pg] |
Benchmark Period Mean (complement) [Pg] |
Bias [kg m-2] |
Bias Score [1] |
Spatial Distribution Score [1] |
Overall Score [1] |
|||
|---|---|---|---|---|---|---|---|---|---|---|---|---|
| Benchmark | [-] | 49.3 | ||||||||||
| CRUNCEPv7 | [-] | 248. | 246. | 2.31 | 48.3 | 0.997 | 62.9 | 0.22 | 0.031 | 0.13 | ||
| GSWP3v1 | [-] | 101. | 99.2 | 1.16 | 48.3 | 0.997 | 17.5 | 0.43 | 0.12 | 0.28 | ||
| WATCH | [-] | 127. | 125. | 1.66 | 48.3 | 0.997 | 26.3 | 0.33 | 0.11 | 0.22 |
Download Data |
Period Mean (original grids) [Pg] |
Model Period Mean (intersection) [Pg] |
Model Period Mean (complement) [Pg] |
Benchmark Period Mean (intersection) [Pg] |
Benchmark Period Mean (complement) [Pg] |
Bias [kg m-2] |
Bias Score [1] |
Spatial Distribution Score [1] |
Overall Score [1] |
|||
|---|---|---|---|---|---|---|---|---|---|---|---|---|
| Benchmark | [-] | 55.7 | ||||||||||
| CRUNCEPv7 | [-] | 25.3 | 23.5 | 1.53 | 50.7 | 4.99 | -4.37 | 0.69 | 0.30 | 0.50 | ||
| GSWP3v1 | [-] | 20.6 | 19.1 | 1.31 | 50.7 | 4.99 | -6.12 | 0.65 | 0.27 | 0.46 | ||
| WATCH | [-] | 18.4 | 17.1 | 1.18 | 50.7 | 4.99 | -7.06 | 0.62 | 0.22 | 0.42 |
Download Data |
Period Mean (original grids) [Pg] |
Model Period Mean (intersection) [Pg] |
Model Period Mean (complement) [Pg] |
Benchmark Period Mean (intersection) [Pg] |
Benchmark Period Mean (complement) [Pg] |
Bias [kg m-2] |
Bias Score [1] |
Spatial Distribution Score [1] |
Overall Score [1] |
|||
|---|---|---|---|---|---|---|---|---|---|---|---|---|
| Benchmark | [-] | 131. | ||||||||||
| CRUNCEPv7 | [-] | 294. | 288. | 0.706 | 130. | 0.462 | 17.5 | 0.49 | 0.33 | 0.41 | ||
| GSWP3v1 | [-] | 133. | 130. | 0.561 | 130. | 0.462 | 0.0856 | 0.64 | 0.88 | 0.76 | ||
| WATCH | [-] | 137. | 133. | 0.501 | 130. | 0.462 | 0.439 | 0.64 | 0.89 | 0.76 |
Download Data |
Period Mean (original grids) [Pg] |
Model Period Mean (intersection) [Pg] |
Model Period Mean (complement) [Pg] |
Benchmark Period Mean (intersection) [Pg] |
Benchmark Period Mean (complement) [Pg] |
Bias [kg m-2] |
Bias Score [1] |
Spatial Distribution Score [1] |
Overall Score [1] |
|||
|---|---|---|---|---|---|---|---|---|---|---|---|---|
| Benchmark | [-] | 153. | ||||||||||
| CRUNCEPv7 | [-] | 122. | 125. | 0.725 | 151. | 2.09 | -0.996 | 0.65 | 0.56 | 0.61 | ||
| GSWP3v1 | [-] | 91.8 | 93.6 | 0.579 | 151. | 2.09 | -2.83 | 0.62 | 0.90 | 0.76 | ||
| WATCH | [-] | 115. | 117. | 0.571 | 151. | 2.09 | -1.59 | 0.61 | 0.71 | 0.66 |
Download Data |
Period Mean (original grids) [Pg] |
Model Period Mean (intersection) [Pg] |
Model Period Mean (complement) [Pg] |
Benchmark Period Mean (intersection) [Pg] |
Benchmark Period Mean (complement) [Pg] |
Bias [kg m-2] |
Bias Score [1] |
Spatial Distribution Score [1] |
Overall Score [1] |
|||
|---|---|---|---|---|---|---|---|---|---|---|---|---|
| Benchmark | [-] | 58.4 | ||||||||||
| CRUNCEPv7 | [-] | 37.4 | 35.7 | 0.948 | 56.8 | 1.57 | -1.91 | 0.63 | 0.77 | 0.70 | ||
| GSWP3v1 | [-] | 33.0 | 31.1 | 0.855 | 56.8 | 1.57 | -2.67 | 0.66 | 0.86 | 0.76 | ||
| WATCH | [-] | 31.0 | 29.6 | 0.759 | 56.8 | 1.57 | -2.95 | 0.66 | 0.93 | 0.80 |
Download Data |
Period Mean (original grids) [Pg] |
Model Period Mean (intersection) [Pg] |
Model Period Mean (complement) [Pg] |
Benchmark Period Mean (intersection) [Pg] |
Benchmark Period Mean (complement) [Pg] |
Bias [kg m-2] |
Bias Score [1] |
Spatial Distribution Score [1] |
Overall Score [1] |
|||
|---|---|---|---|---|---|---|---|---|---|---|---|---|
| Benchmark | [-] | 59.4 | ||||||||||
| CRUNCEPv7 | [-] | 254. | 256. | 1.05 | 58.9 | 0.523 | 56.8 | 0.34 | 0.055 | 0.20 | ||
| GSWP3v1 | [-] | 119. | 120. | 0.656 | 58.9 | 0.523 | 18.1 | 0.45 | 0.23 | 0.34 | ||
| WATCH | [-] | 84.2 | 84.4 | 0.890 | 58.9 | 0.523 | 8.25 | 0.49 | 0.40 | 0.45 |
Download Data |
Period Mean (original grids) [Pg] |
Model Period Mean (intersection) [Pg] |
Model Period Mean (complement) [Pg] |
Benchmark Period Mean (intersection) [Pg] |
Benchmark Period Mean (complement) [Pg] |
Bias [kg m-2] |
Bias Score [1] |
Spatial Distribution Score [1] |
Overall Score [1] |
|||
|---|---|---|---|---|---|---|---|---|---|---|---|---|
| Benchmark | [-] | 58.9 | ||||||||||
| CRUNCEPv7 | [-] | 30.2 | 28.1 | 1.77 | 57.4 | 1.53 | -2.42 | 0.53 | 0.38 | 0.45 | ||
| GSWP3v1 | [-] | 27.6 | 25.8 | 1.60 | 57.4 | 1.53 | -2.75 | 0.54 | 0.47 | 0.51 | ||
| WATCH | [-] | 25.8 | 24.4 | 1.31 | 57.4 | 1.53 | -3.03 | 0.55 | 0.56 | 0.55 |
Download Data |
Period Mean (original grids) [Pg] |
Model Period Mean (intersection) [Pg] |
Model Period Mean (complement) [Pg] |
Benchmark Period Mean (intersection) [Pg] |
Benchmark Period Mean (complement) [Pg] |
Bias [kg m-2] |
Bias Score [1] |
Spatial Distribution Score [1] |
Overall Score [1] |
|||
|---|---|---|---|---|---|---|---|---|---|---|---|---|
| Benchmark | [-] | 66.2 | ||||||||||
| CRUNCEPv7 | [-] | 67.9 | 65.8 | 1.17 | 64.6 | 1.58 | 2.15 | 0.70 | 0.95 | 0.82 | ||
| GSWP3v1 | [-] | 44.2 | 42.7 | 0.830 | 64.6 | 1.58 | -2.44 | 0.72 | 0.85 | 0.78 | ||
| WATCH | [-] | 33.7 | 32.5 | 0.752 | 64.6 | 1.58 | -4.47 | 0.65 | 0.63 | 0.64 |
Download Data |
Period Mean (original grids) [Pg] |
Model Period Mean (intersection) [Pg] |
Model Period Mean (complement) [Pg] |
Benchmark Period Mean (intersection) [Pg] |
Benchmark Period Mean (complement) [Pg] |
Bias [kg m-2] |
Bias Score [1] |
Spatial Distribution Score [1] |
Overall Score [1] |
|||
|---|---|---|---|---|---|---|---|---|---|---|---|---|
| Benchmark | [-] | 1.38e+03 | ||||||||||
| CRUNCEPv7 | [-] | 1.92e+03 | 1.90e+03 | 22.7 | 1.32e+03 | 56.4 | 5.01 | 0.56 | 0.10 | 0.33 | ||
| GSWP3v1 | [-] | 1.06e+03 | 1.04e+03 | 16.5 | 1.32e+03 | 56.4 | -1.32 | 0.60 | 0.43 | 0.51 | ||
| WATCH | [-] | 1.09e+03 | 1.07e+03 | 17.3 | 1.32e+03 | 56.4 | -1.10 | 0.60 | 0.34 | 0.47 |
Download Data |
Period Mean (original grids) [Pg] |
Model Period Mean (intersection) [Pg] |
Model Period Mean (complement) [Pg] |
Benchmark Period Mean (intersection) [Pg] |
Benchmark Period Mean (complement) [Pg] |
Bias [kg m-2] |
Bias Score [1] |
Spatial Distribution Score [1] |
Overall Score [1] |
|||
|---|---|---|---|---|---|---|---|---|---|---|---|---|
| Benchmark | [-] | 64.3 | ||||||||||
| CRUNCEPv7 | [-] | 18.3 | 18.0 | 0.405 | 63.6 | 0.726 | -2.65 | 0.50 | 0.76 | 0.63 | ||
| GSWP3v1 | [-] | 14.0 | 13.8 | 0.386 | 63.6 | 0.726 | -2.91 | 0.48 | 0.82 | 0.65 | ||
| WATCH | [-] | 15.6 | 15.4 | 0.362 | 63.6 | 0.726 | -2.83 | 0.49 | 0.81 | 0.65 |
Download Data |
Period Mean (original grids) [Pg] |
Model Period Mean (intersection) [Pg] |
Model Period Mean (complement) [Pg] |
Benchmark Period Mean (intersection) [Pg] |
Benchmark Period Mean (complement) [Pg] |
Bias [kg m-2] |
Bias Score [1] |
Spatial Distribution Score [1] |
Overall Score [1] |
|||
|---|---|---|---|---|---|---|---|---|---|---|---|---|
| Benchmark | [-] | 90.9 | ||||||||||
| CRUNCEPv7 | [-] | 326. | 324. | 2.83 | 89.5 | 1.44 | 35.8 | 0.33 | 0.077 | 0.20 | ||
| GSWP3v1 | [-] | 123. | 122. | 1.25 | 89.5 | 1.44 | 5.76 | 0.44 | 0.42 | 0.43 | ||
| WATCH | [-] | 154. | 151. | 2.16 | 89.5 | 1.44 | 10.5 | 0.48 | 0.17 | 0.33 |
Download Data |
Period Mean (original grids) [Pg] |
Model Period Mean (intersection) [Pg] |
Model Period Mean (complement) [Pg] |
Benchmark Period Mean (intersection) [Pg] |
Benchmark Period Mean (complement) [Pg] |
Bias [kg m-2] |
Bias Score [1] |
Spatial Distribution Score [1] |
Overall Score [1] |
|||
|---|---|---|---|---|---|---|---|---|---|---|---|---|
| Benchmark | [-] | 42.5 | ||||||||||
| CRUNCEPv7 | [-] | 21.0 | 19.3 | 1.14 | 40.2 | 2.26 | -3.97 | 0.57 | 0.84 | 0.70 | ||
| GSWP3v1 | [-] | 16.9 | 15.5 | 0.942 | 40.2 | 2.26 | -5.56 | 0.57 | 0.73 | 0.65 | ||
| WATCH | [-] | 15.4 | 14.3 | 0.741 | 40.2 | 2.26 | -6.18 | 0.56 | 0.65 | 0.61 |
Download Data |
Period Mean (original grids) [Pg] |
Model Period Mean (intersection) [Pg] |
Model Period Mean (complement) [Pg] |
Benchmark Period Mean (intersection) [Pg] |
Benchmark Period Mean (complement) [Pg] |
Bias [kg m-2] |
Bias Score [1] |
Spatial Distribution Score [1] |
Overall Score [1] |
|||
|---|---|---|---|---|---|---|---|---|---|---|---|---|
| Benchmark | [-] | 45.4 | ||||||||||
| CRUNCEPv7 | [-] | 42.8 | 41.7 | 0.382 | 44.5 | 0.888 | -0.108 | 0.75 | 0.84 | 0.79 | ||
| GSWP3v1 | [-] | 32.2 | 31.2 | 0.308 | 44.5 | 0.888 | -2.77 | 0.72 | 0.77 | 0.75 | ||
| WATCH | [-] | 31.5 | 30.6 | 0.255 | 44.5 | 0.888 | -2.98 | 0.72 | 0.71 | 0.72 |
Download Data |
Period Mean (original grids) [Pg] |
Model Period Mean (intersection) [Pg] |
Model Period Mean (complement) [Pg] |
Benchmark Period Mean (intersection) [Pg] |
Benchmark Period Mean (complement) [Pg] |
Bias [kg m-2] |
Bias Score [1] |
Spatial Distribution Score [1] |
Overall Score [1] |
|||
|---|---|---|---|---|---|---|---|---|---|---|---|---|
| Benchmark | [-] | 88.1 | ||||||||||
| CRUNCEPv7 | [-] | 145. | 143. | 0.333 | 86.3 | 1.76 | 11.0 | 0.58 | 0.47 | 0.53 | ||
| GSWP3v1 | [-] | 75.2 | 75.3 | 0.272 | 86.3 | 1.76 | -1.69 | 0.63 | 0.87 | 0.75 | ||
| WATCH | [-] | 68.6 | 68.8 | 0.269 | 86.3 | 1.76 | -2.94 | 0.63 | 0.84 | 0.73 |
Download Data |
Period Mean (original grids) [Pg] |
Model Period Mean (intersection) [Pg] |
Model Period Mean (complement) [Pg] |
Benchmark Period Mean (intersection) [Pg] |
Benchmark Period Mean (complement) [Pg] |
Bias [kg m-2] |
Bias Score [1] |
Spatial Distribution Score [1] |
Overall Score [1] |
|||
|---|---|---|---|---|---|---|---|---|---|---|---|---|
| Benchmark | [-] | 34.9 | ||||||||||
| CRUNCEPv7 | [-] | 12.9 | 13.5 | 0.124 | 34.7 | 0.216 | -5.04 | 0.55 | 0.83 | 0.69 | ||
| GSWP3v1 | [-] | 11.5 | 12.1 | 0.0886 | 34.7 | 0.216 | -5.41 | 0.54 | 0.87 | 0.71 | ||
| WATCH | [-] | 12.5 | 13.1 | 0.0918 | 34.7 | 0.216 | -5.19 | 0.54 | 0.86 | 0.70 |
Download Data |
Period Mean (original grids) [Pg] |
Model Period Mean (intersection) [Pg] |
Model Period Mean (complement) [Pg] |
Benchmark Period Mean (intersection) [Pg] |
Benchmark Period Mean (complement) [Pg] |
Bias [kg m-2] |
Bias Score [1] |
Spatial Distribution Score [1] |
Overall Score [1] |
|||
|---|---|---|---|---|---|---|---|---|---|---|---|---|
| Benchmark | [-] | 101. | ||||||||||
| CRUNCEPv7 | [-] | 86.4 | 85.4 | 0.425 | 100. | 0.811 | -1.19 | 0.73 | 0.59 | 0.66 | ||
| GSWP3v1 | [-] | 68.5 | 67.8 | 0.372 | 100. | 0.811 | -3.35 | 0.69 | 0.46 | 0.58 | ||
| WATCH | [-] | 69.1 | 68.4 | 0.317 | 100. | 0.811 | -3.30 | 0.71 | 0.33 | 0.52 |
Download Data |
Period Mean (original grids) [Pg] |
Model Period Mean (intersection) [Pg] |
Model Period Mean (complement) [Pg] |
Benchmark Period Mean (intersection) [Pg] |
Benchmark Period Mean (complement) [Pg] |
Bias [kg m-2] |
Bias Score [1] |
Spatial Distribution Score [1] |
Overall Score [1] |
|||
|---|---|---|---|---|---|---|---|---|---|---|---|---|
| Benchmark | [-] | 60.7 | ||||||||||
| CRUNCEPv7 | [-] | 62.6 | 63.0 | 0.653 | 60.4 | 0.300 | 1.03 | 0.65 | 0.91 | 0.78 | ||
| GSWP3v1 | [-] | 47.2 | 47.5 | 0.479 | 60.4 | 0.300 | -1.44 | 0.67 | 0.84 | 0.75 | ||
| WATCH | [-] | 48.4 | 48.9 | 0.413 | 60.4 | 0.300 | -1.30 | 0.69 | 0.80 | 0.75 |
Download Data |
Period Mean (original grids) [Pg] |
Model Period Mean (intersection) [Pg] |
Model Period Mean (complement) [Pg] |
Benchmark Period Mean (intersection) [Pg] |
Benchmark Period Mean (complement) [Pg] |
Bias [kg m-2] |
Bias Score [1] |
Spatial Distribution Score [1] |
Overall Score [1] |
|||
|---|---|---|---|---|---|---|---|---|---|---|---|---|
| Benchmark | [-] | 29.6 | ||||||||||
| CRUNCEPv7 | [-] | 17.7 | 16.8 | 0.278 | 28.2 | 1.46 | -2.29 | 0.56 | 0.73 | 0.64 | ||
| GSWP3v1 | [-] | 15.7 | 14.8 | 0.272 | 28.2 | 1.46 | -3.23 | 0.57 | 0.49 | 0.53 | ||
| WATCH | [-] | 15.3 | 14.5 | 0.227 | 28.2 | 1.46 | -3.44 | 0.56 | 0.51 | 0.54 |
Temporally integrated period mean