Mean State
Download Data |
Period Mean (original grids) [Pg] |
Model Period Mean (intersection) [Pg] |
Model Period Mean (complement) [Pg] |
Benchmark Period Mean (intersection) [Pg] |
Benchmark Period Mean (complement) [Pg] |
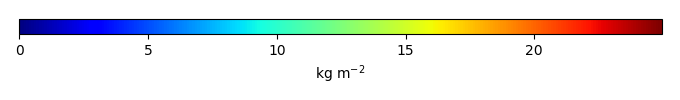
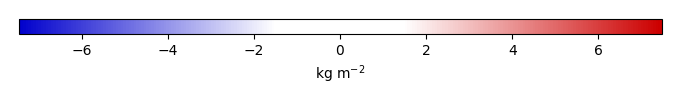
Bias [kg m-2] |
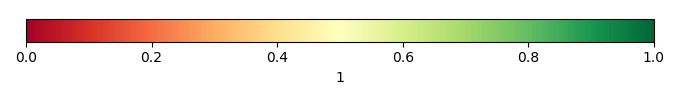
Bias Score [1] |
Spatial Distribution Score [1] |
Overall Score [1] |
|||
|---|---|---|---|---|---|---|---|---|---|---|---|---|
| Benchmark | [-] | 32.8 | ||||||||||
| CRUNCEPv7 | [-] | 42.9 | 43.3 | 0.233 | 32.8 | 0.0526 | 2.86 | 0.650 | 0.863 | 0.757 | ||
| GSWP3v1 | [-] | 38.5 | 38.7 | 0.241 | 32.8 | 0.0526 | 1.73 | 0.717 | 0.926 | 0.822 | ||
| WATCH | [-] | 38.8 | 39.5 | 0.235 | 32.8 | 0.0526 | 1.91 | 0.731 | 0.940 | 0.836 |
Download Data |
Period Mean (original grids) [Pg] |
Model Period Mean (intersection) [Pg] |
Model Period Mean (complement) [Pg] |
Benchmark Period Mean (intersection) [Pg] |
Benchmark Period Mean (complement) [Pg] |
Bias [kg m-2] |
Bias Score [1] |
Spatial Distribution Score [1] |
Overall Score [1] |
|||
|---|---|---|---|---|---|---|---|---|---|---|---|---|
| Benchmark | [-] | 8.35 | ||||||||||
| CRUNCEPv7 | [-] | 3.54 | 2.95 | 0.191 | 8.34 | 0.0114 | -0.934 | 0.497 | 0.662 | 0.580 | ||
| GSWP3v1 | [-] | 3.24 | 2.69 | 0.201 | 8.34 | 0.0114 | -0.977 | 0.477 | 0.622 | 0.550 | ||
| WATCH | [-] | 6.17 | 5.28 | 0.220 | 8.34 | 0.0114 | -0.518 | 0.570 | 0.879 | 0.724 |
Download Data |
Period Mean (original grids) [Pg] |
Model Period Mean (intersection) [Pg] |
Model Period Mean (complement) [Pg] |
Benchmark Period Mean (intersection) [Pg] |
Benchmark Period Mean (complement) [Pg] |
Bias [kg m-2] |
Bias Score [1] |
Spatial Distribution Score [1] |
Overall Score [1] |
|||
|---|---|---|---|---|---|---|---|---|---|---|---|---|
| Benchmark | [-] | 10.6 | ||||||||||
| CRUNCEPv7 | [-] | 17.1 | 16.4 | 0.388 | 10.6 | 0.0246 | 0.803 | 0.514 | 0.515 | 0.514 | ||
| GSWP3v1 | [-] | 12.3 | 11.7 | 0.363 | 10.6 | 0.0246 | 0.299 | 0.500 | 0.561 | 0.530 | ||
| WATCH | [-] | 20.7 | 20.0 | 0.385 | 10.6 | 0.0246 | 1.21 | 0.452 | 0.450 | 0.451 |
Download Data |
Period Mean (original grids) [Pg] |
Model Period Mean (intersection) [Pg] |
Model Period Mean (complement) [Pg] |
Benchmark Period Mean (intersection) [Pg] |
Benchmark Period Mean (complement) [Pg] |
Bias [kg m-2] |
Bias Score [1] |
Spatial Distribution Score [1] |
Overall Score [1] |
|||
|---|---|---|---|---|---|---|---|---|---|---|---|---|
| Benchmark | [-] | 4.69 | ||||||||||
| CRUNCEPv7 | [-] | 5.06 | 5.01 | 0.0720 | 4.67 | 0.0241 | 0.237 | 0.599 | 0.858 | 0.728 | ||
| GSWP3v1 | [-] | 4.17 | 4.12 | 0.0636 | 4.67 | 0.0241 | -0.0436 | 0.581 | 0.798 | 0.689 | ||
| WATCH | [-] | 5.34 | 5.30 | 0.0697 | 4.67 | 0.0241 | 0.336 | 0.645 | 0.828 | 0.736 |
Download Data |
Period Mean (original grids) [Pg] |
Model Period Mean (intersection) [Pg] |
Model Period Mean (complement) [Pg] |
Benchmark Period Mean (intersection) [Pg] |
Benchmark Period Mean (complement) [Pg] |
Bias [kg m-2] |
Bias Score [1] |
Spatial Distribution Score [1] |
Overall Score [1] |
|||
|---|---|---|---|---|---|---|---|---|---|---|---|---|
| Benchmark | [-] | 27.8 | ||||||||||
| CRUNCEPv7 | [-] | 49.4 | 47.3 | 1.89 | 26.8 | 0.921 | 11.4 | 0.466 | 0.913 | 0.690 | ||
| GSWP3v1 | [-] | 39.9 | 38.2 | 1.51 | 26.8 | 0.921 | 7.87 | 0.607 | 0.919 | 0.763 | ||
| WATCH | [-] | 38.9 | 37.1 | 1.55 | 26.8 | 0.921 | 7.57 | 0.633 | 0.880 | 0.757 |
Download Data |
Period Mean (original grids) [Pg] |
Model Period Mean (intersection) [Pg] |
Model Period Mean (complement) [Pg] |
Benchmark Period Mean (intersection) [Pg] |
Benchmark Period Mean (complement) [Pg] |
Bias [kg m-2] |
Bias Score [1] |
Spatial Distribution Score [1] |
Overall Score [1] |
|||
|---|---|---|---|---|---|---|---|---|---|---|---|---|
| Benchmark | [-] | 43.5 | ||||||||||
| CRUNCEPv7 | [-] | 73.2 | 71.7 | 0.369 | 43.5 | 0.0288 | 3.33 | 0.501 | 0.547 | 0.524 | ||
| GSWP3v1 | [-] | 52.5 | 51.4 | 0.326 | 43.5 | 0.0288 | 1.03 | 0.493 | 0.626 | 0.560 | ||
| WATCH | [-] | 49.8 | 48.8 | 0.265 | 43.5 | 0.0288 | 0.704 | 0.667 | 0.931 | 0.799 |
Download Data |
Period Mean (original grids) [Pg] |
Model Period Mean (intersection) [Pg] |
Model Period Mean (complement) [Pg] |
Benchmark Period Mean (intersection) [Pg] |
Benchmark Period Mean (complement) [Pg] |
Bias [kg m-2] |
Bias Score [1] |
Spatial Distribution Score [1] |
Overall Score [1] |
|||
|---|---|---|---|---|---|---|---|---|---|---|---|---|
| Benchmark | [-] | 32.0 | ||||||||||
| CRUNCEPv7 | [-] | 36.1 | 36.1 | 0.765 | 31.9 | 0.0804 | 0.598 | 0.504 | 0.751 | 0.628 | ||
| GSWP3v1 | [-] | 31.6 | 31.8 | 0.632 | 31.9 | 0.0804 | 0.262 | 0.606 | 0.861 | 0.734 | ||
| WATCH | [-] | 33.2 | 33.1 | 0.669 | 31.9 | 0.0804 | 0.336 | 0.647 | 0.894 | 0.771 |
Download Data |
Period Mean (original grids) [Pg] |
Model Period Mean (intersection) [Pg] |
Model Period Mean (complement) [Pg] |
Benchmark Period Mean (intersection) [Pg] |
Benchmark Period Mean (complement) [Pg] |
Bias [kg m-2] |
Bias Score [1] |
Spatial Distribution Score [1] |
Overall Score [1] |
|||
|---|---|---|---|---|---|---|---|---|---|---|---|---|
| Benchmark | [-] | 21.1 | ||||||||||
| CRUNCEPv7 | [-] | 25.4 | 24.1 | 0.687 | 20.9 | 0.146 | 1.53 | 0.535 | 0.742 | 0.638 | ||
| GSWP3v1 | [-] | 24.8 | 23.3 | 0.610 | 20.9 | 0.146 | 1.28 | 0.600 | 0.820 | 0.710 | ||
| WATCH | [-] | 25.5 | 24.3 | 0.604 | 20.9 | 0.146 | 1.42 | 0.596 | 0.834 | 0.715 |
Download Data |
Period Mean (original grids) [Pg] |
Model Period Mean (intersection) [Pg] |
Model Period Mean (complement) [Pg] |
Benchmark Period Mean (intersection) [Pg] |
Benchmark Period Mean (complement) [Pg] |
Bias [kg m-2] |
Bias Score [1] |
Spatial Distribution Score [1] |
Overall Score [1] |
|||
|---|---|---|---|---|---|---|---|---|---|---|---|---|
| Benchmark | [-] | 3.81 | ||||||||||
| CRUNCEPv7 | [-] | 8.81 | 9.19 | 0.106 | 3.81 | 0.000319 | 1.63 | 0.458 | 0.675 | 0.566 | ||
| GSWP3v1 | [-] | 6.88 | 7.17 | 0.0941 | 3.81 | 0.000319 | 1.03 | 0.512 | 0.754 | 0.633 | ||
| WATCH | [-] | 5.00 | 5.20 | 0.0595 | 3.81 | 0.000319 | 0.445 | 0.677 | 0.915 | 0.796 |
Download Data |
Period Mean (original grids) [Pg] |
Model Period Mean (intersection) [Pg] |
Model Period Mean (complement) [Pg] |
Benchmark Period Mean (intersection) [Pg] |
Benchmark Period Mean (complement) [Pg] |
Bias [kg m-2] |
Bias Score [1] |
Spatial Distribution Score [1] |
Overall Score [1] |
|||
|---|---|---|---|---|---|---|---|---|---|---|---|---|
| Benchmark | [-] | 9.16 | ||||||||||
| CRUNCEPv7 | [-] | 11.5 | 10.5 | 0.819 | 8.87 | 0.289 | 0.811 | 0.580 | 0.783 | 0.681 | ||
| GSWP3v1 | [-] | 11.0 | 10.0 | 0.829 | 8.87 | 0.289 | 0.760 | 0.605 | 0.812 | 0.708 | ||
| WATCH | [-] | 11.8 | 10.8 | 0.800 | 8.87 | 0.289 | 0.850 | 0.616 | 0.824 | 0.720 |
Download Data |
Period Mean (original grids) [Pg] |
Model Period Mean (intersection) [Pg] |
Model Period Mean (complement) [Pg] |
Benchmark Period Mean (intersection) [Pg] |
Benchmark Period Mean (complement) [Pg] |
Bias [kg m-2] |
Bias Score [1] |
Spatial Distribution Score [1] |
Overall Score [1] |
|||
|---|---|---|---|---|---|---|---|---|---|---|---|---|
| Benchmark | [-] | 12.0 | ||||||||||
| CRUNCEPv7 | [-] | 26.8 | 25.7 | 0.646 | 12.0 | 0.0529 | 3.42 | 0.443 | 0.261 | 0.352 | ||
| GSWP3v1 | [-] | 18.2 | 17.4 | 0.537 | 12.0 | 0.0529 | 1.77 | 0.466 | 0.349 | 0.407 | ||
| WATCH | [-] | 13.3 | 12.6 | 0.451 | 12.0 | 0.0529 | 0.862 | 0.508 | 0.526 | 0.517 |
Download Data |
Period Mean (original grids) [Pg] |
Model Period Mean (intersection) [Pg] |
Model Period Mean (complement) [Pg] |
Benchmark Period Mean (intersection) [Pg] |
Benchmark Period Mean (complement) [Pg] |
Bias [kg m-2] |
Bias Score [1] |
Spatial Distribution Score [1] |
Overall Score [1] |
|||
|---|---|---|---|---|---|---|---|---|---|---|---|---|
| Benchmark | [-] | 368. | ||||||||||
| CRUNCEPv7 | [-] | 589. | 578. | 11.2 | 363. | 4.64 | 2.37 | 0.514 | 0.680 | 0.597 | ||
| GSWP3v1 | [-] | 487. | 477. | 9.77 | 363. | 4.64 | 1.46 | 0.573 | 0.784 | 0.679 | ||
| WATCH | [-] | 505. | 496. | 9.63 | 363. | 4.64 | 1.60 | 0.596 | 0.814 | 0.705 |
Download Data |
Period Mean (original grids) [Pg] |
Model Period Mean (intersection) [Pg] |
Model Period Mean (complement) [Pg] |
Benchmark Period Mean (intersection) [Pg] |
Benchmark Period Mean (complement) [Pg] |
Bias [kg m-2] |
Bias Score [1] |
Spatial Distribution Score [1] |
Overall Score [1] |
|||
|---|---|---|---|---|---|---|---|---|---|---|---|---|
| Benchmark | [-] | 1.24 | ||||||||||
| CRUNCEPv7 | [-] | 1.68 | 1.27 | 0.401 | 1.23 | 0.00783 | 0.0633 | 0.494 | 0.673 | 0.584 | ||
| GSWP3v1 | [-] | 1.55 | 1.22 | 0.341 | 1.23 | 0.00783 | 0.0659 | 0.507 | 0.738 | 0.623 | ||
| WATCH | [-] | 2.27 | 1.81 | 0.433 | 1.23 | 0.00783 | 0.204 | 0.513 | 0.728 | 0.621 |
Download Data |
Period Mean (original grids) [Pg] |
Model Period Mean (intersection) [Pg] |
Model Period Mean (complement) [Pg] |
Benchmark Period Mean (intersection) [Pg] |
Benchmark Period Mean (complement) [Pg] |
Bias [kg m-2] |
Bias Score [1] |
Spatial Distribution Score [1] |
Overall Score [1] |
|||
|---|---|---|---|---|---|---|---|---|---|---|---|---|
| Benchmark | [-] | 5.62 | ||||||||||
| CRUNCEPv7 | [-] | 16.4 | 16.0 | 0.288 | 5.59 | 0.0265 | 1.94 | 0.297 | 0.357 | 0.327 | ||
| GSWP3v1 | [-] | 14.5 | 14.1 | 0.228 | 5.59 | 0.0265 | 1.60 | 0.345 | 0.405 | 0.375 | ||
| WATCH | [-] | 11.4 | 11.0 | 0.209 | 5.59 | 0.0265 | 1.04 | 0.453 | 0.554 | 0.504 |
Download Data |
Period Mean (original grids) [Pg] |
Model Period Mean (intersection) [Pg] |
Model Period Mean (complement) [Pg] |
Benchmark Period Mean (intersection) [Pg] |
Benchmark Period Mean (complement) [Pg] |
Bias [kg m-2] |
Bias Score [1] |
Spatial Distribution Score [1] |
Overall Score [1] |
|||
|---|---|---|---|---|---|---|---|---|---|---|---|---|
| Benchmark | [-] | 8.21 | ||||||||||
| CRUNCEPv7 | [-] | 11.9 | 11.1 | 0.518 | 8.09 | 0.122 | 2.42 | 0.498 | 0.495 | 0.497 | ||
| GSWP3v1 | [-] | 10.2 | 9.46 | 0.474 | 8.09 | 0.122 | 1.74 | 0.539 | 0.599 | 0.569 | ||
| WATCH | [-] | 10.8 | 10.1 | 0.449 | 8.09 | 0.122 | 2.00 | 0.540 | 0.625 | 0.583 |
Download Data |
Period Mean (original grids) [Pg] |
Model Period Mean (intersection) [Pg] |
Model Period Mean (complement) [Pg] |
Benchmark Period Mean (intersection) [Pg] |
Benchmark Period Mean (complement) [Pg] |
Bias [kg m-2] |
Bias Score [1] |
Spatial Distribution Score [1] |
Overall Score [1] |
|||
|---|---|---|---|---|---|---|---|---|---|---|---|---|
| Benchmark | [-] | 14.8 | ||||||||||
| CRUNCEPv7 | [-] | 17.8 | 17.4 | 0.231 | 14.8 | 0.0147 | 1.04 | 0.629 | 0.717 | 0.673 | ||
| GSWP3v1 | [-] | 12.0 | 11.7 | 0.182 | 14.8 | 0.0147 | -0.425 | 0.652 | 0.870 | 0.761 | ||
| WATCH | [-] | 13.9 | 13.6 | 0.173 | 14.8 | 0.0147 | 0.0172 | 0.698 | 0.907 | 0.803 |
Download Data |
Period Mean (original grids) [Pg] |
Model Period Mean (intersection) [Pg] |
Model Period Mean (complement) [Pg] |
Benchmark Period Mean (intersection) [Pg] |
Benchmark Period Mean (complement) [Pg] |
Bias [kg m-2] |
Bias Score [1] |
Spatial Distribution Score [1] |
Overall Score [1] |
|||
|---|---|---|---|---|---|---|---|---|---|---|---|---|
| Benchmark | [-] | 20.1 | ||||||||||
| CRUNCEPv7 | [-] | 56.8 | 56.7 | 0.307 | 19.8 | 0.219 | 7.50 | 0.303 | 0.635 | 0.469 | ||
| GSWP3v1 | [-] | 43.6 | 43.6 | 0.247 | 19.8 | 0.219 | 4.91 | 0.403 | 0.721 | 0.562 | ||
| WATCH | [-] | 38.9 | 38.8 | 0.228 | 19.8 | 0.219 | 3.98 | 0.465 | 0.808 | 0.636 |
Download Data |
Period Mean (original grids) [Pg] |
Model Period Mean (intersection) [Pg] |
Model Period Mean (complement) [Pg] |
Benchmark Period Mean (intersection) [Pg] |
Benchmark Period Mean (complement) [Pg] |
Bias [kg m-2] |
Bias Score [1] |
Spatial Distribution Score [1] |
Overall Score [1] |
|||
|---|---|---|---|---|---|---|---|---|---|---|---|---|
| Benchmark | [-] | 8.04 | ||||||||||
| CRUNCEPv7 | [-] | 3.49 | 3.46 | 0.0449 | 7.99 | 0.0515 | -0.996 | 0.524 | 0.654 | 0.589 | ||
| GSWP3v1 | [-] | 3.04 | 3.04 | 0.0352 | 7.99 | 0.0515 | -1.10 | 0.511 | 0.490 | 0.500 | ||
| WATCH | [-] | 3.35 | 3.34 | 0.0401 | 7.99 | 0.0515 | -1.04 | 0.507 | 0.509 | 0.508 |
Download Data |
Period Mean (original grids) [Pg] |
Model Period Mean (intersection) [Pg] |
Model Period Mean (complement) [Pg] |
Benchmark Period Mean (intersection) [Pg] |
Benchmark Period Mean (complement) [Pg] |
Bias [kg m-2] |
Bias Score [1] |
Spatial Distribution Score [1] |
Overall Score [1] |
|||
|---|---|---|---|---|---|---|---|---|---|---|---|---|
| Benchmark | [-] | 88.9 | ||||||||||
| CRUNCEPv7 | [-] | 152. | 151. | 0.431 | 88.8 | 0.0655 | 7.77 | 0.546 | 0.889 | 0.718 | ||
| GSWP3v1 | [-] | 129. | 128. | 0.373 | 88.8 | 0.0655 | 5.00 | 0.646 | 0.945 | 0.795 | ||
| WATCH | [-] | 144. | 144. | 0.361 | 88.8 | 0.0655 | 6.83 | 0.577 | 0.908 | 0.743 |
Download Data |
Period Mean (original grids) [Pg] |
Model Period Mean (intersection) [Pg] |
Model Period Mean (complement) [Pg] |
Benchmark Period Mean (intersection) [Pg] |
Benchmark Period Mean (complement) [Pg] |
Bias [kg m-2] |
Bias Score [1] |
Spatial Distribution Score [1] |
Overall Score [1] |
|||
|---|---|---|---|---|---|---|---|---|---|---|---|---|
| Benchmark | [-] | 9.09 | ||||||||||
| CRUNCEPv7 | [-] | 21.7 | 21.8 | 0.315 | 9.08 | 0.0128 | 2.16 | 0.415 | 0.388 | 0.402 | ||
| GSWP3v1 | [-] | 21.8 | 21.8 | 0.283 | 9.08 | 0.0128 | 2.13 | 0.323 | 0.298 | 0.311 | ||
| WATCH | [-] | 23.9 | 23.9 | 0.260 | 9.08 | 0.0128 | 2.44 | 0.318 | 0.361 | 0.340 |
Download Data |
Period Mean (original grids) [Pg] |
Model Period Mean (intersection) [Pg] |
Model Period Mean (complement) [Pg] |
Benchmark Period Mean (intersection) [Pg] |
Benchmark Period Mean (complement) [Pg] |
Bias [kg m-2] |
Bias Score [1] |
Spatial Distribution Score [1] |
Overall Score [1] |
|||
|---|---|---|---|---|---|---|---|---|---|---|---|---|
| Benchmark | [-] | 2.45 | ||||||||||
| CRUNCEPv7 | [-] | 5.25 | 5.16 | 0.145 | 2.40 | 0.0496 | 1.70 | 0.371 | 0.295 | 0.333 | ||
| GSWP3v1 | [-] | 6.26 | 6.15 | 0.140 | 2.40 | 0.0496 | 1.92 | 0.352 | 0.318 | 0.335 | ||
| WATCH | [-] | 5.86 | 5.78 | 0.127 | 2.40 | 0.0496 | 1.71 | 0.384 | 0.398 | 0.391 |
Temporally integrated period mean