Mean State
Download Data |
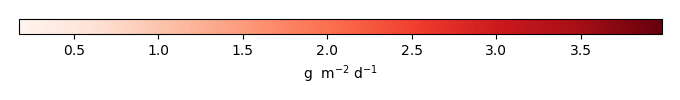
Period Mean (original grids) [g m-2 d-1] |
Bias [g m-2 d-1] |
RMSE [g m-2 d-1] |
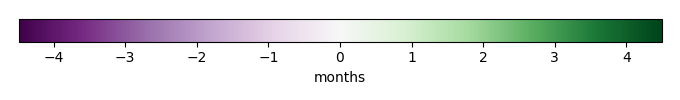
Phase Shift [months] |
Bias Score [1] |
RMSE Score [1] |
Seasonal Cycle Score [1] |
Interannual Variability Score [1] |
Overall Score [1] |
|||
|---|---|---|---|---|---|---|---|---|---|---|---|---|
| Benchmark | [-] | -0.106 | ||||||||||
| CRUNCEPv7 | [-] | 0.103 | 0.208 | 0.901 | 3.51 | 0.557 | 0.342 | 0.188 | 0.433 | 0.372 | ||
| GSWP3v1 | [-] | 0.168 | 0.274 | 0.830 | 2.99 | 0.507 | 0.349 | 0.117 | 0.463 | 0.357 | ||
| WATCH | [-] | 0.148 | 0.154 | 1.03 | 2.01 | 0.992 | -0.0679 | -3.68 | 0.432 | -0.478 |
Download Data |
Period Mean (original grids) [g m-2 d-1] |
Bias [g m-2 d-1] |
RMSE [g m-2 d-1] |
Phase Shift [months] |
Bias Score [1] |
RMSE Score [1] |
Seasonal Cycle Score [1] |
Interannual Variability Score [1] |
Overall Score [1] |
|||
|---|---|---|---|---|---|---|---|---|---|---|---|---|
| Benchmark | [-] | 0.443 | ||||||||||
| CRUNCEPv7 | [-] | 0.000830 | -0.442 | 1.70 | 0.00 | 0.646 | 0.183 | 1.00 | 0.703 | 0.543 | ||
| GSWP3v1 | [-] | 0.0474 | -0.396 | 0.915 | 0.00 | 0.676 | 0.408 | 1.00 | 0.729 | 0.644 | ||
| WATCH | [-] | 0.00991 | nan | nan | nan | nan | nan | nan | nan | nan |
Download Data |
Period Mean (original grids) [g m-2 d-1] |
Bias [g m-2 d-1] |
RMSE [g m-2 d-1] |
Phase Shift [months] |
Bias Score [1] |
RMSE Score [1] |
Seasonal Cycle Score [1] |
Interannual Variability Score [1] |
Overall Score [1] |
|||
|---|---|---|---|---|---|---|---|---|---|---|---|---|
| Benchmark | [-] | -1.15 | ||||||||||
| CRUNCEPv7 | [-] | 0.306 | 1.45 | 2.06 | 2.00 | 0.345 | 0.349 | 0.756 | 0.468 | 0.453 | ||
| GSWP3v1 | [-] | 0.264 | 1.41 | 2.04 | 6.05 | 0.356 | 0.350 | 7.41e-05 | 0.448 | 0.301 | ||
| WATCH | [-] | 0.310 | nan | nan | nan | nan | nan | nan | nan | nan |
Download Data |
Period Mean (original grids) [g m-2 d-1] |
Bias [g m-2 d-1] |
RMSE [g m-2 d-1] |
Phase Shift [months] |
Bias Score [1] |
RMSE Score [1] |
Seasonal Cycle Score [1] |
Interannual Variability Score [1] |
Overall Score [1] |
|||
|---|---|---|---|---|---|---|---|---|---|---|---|---|
| Benchmark | [-] | 0.546 | ||||||||||
| CRUNCEPv7 | [-] | 0.138 | -0.408 | 1.06 | 0.508 | 0.625 | 0.365 | 0.958 | 0.742 | 0.611 | ||
| GSWP3v1 | [-] | 0.107 | -0.439 | 0.776 | 0.508 | 0.600 | 0.449 | 0.958 | 0.794 | 0.650 | ||
| WATCH | [-] | 0.174 | nan | nan | nan | nan | nan | nan | nan | nan |
Download Data |
Period Mean (original grids) [g m-2 d-1] |
Bias [g m-2 d-1] |
RMSE [g m-2 d-1] |
Phase Shift [months] |
Bias Score [1] |
RMSE Score [1] |
Seasonal Cycle Score [1] |
Interannual Variability Score [1] |
Overall Score [1] |
|||
|---|---|---|---|---|---|---|---|---|---|---|---|---|
| Benchmark | [-] | 0.988 | ||||||||||
| CRUNCEPv7 | [-] | 0.161 | -0.827 | 1.35 | 3.02 | 0.523 | 0.439 | 0.454 | 0.644 | 0.500 | ||
| GSWP3v1 | [-] | 0.194 | -0.794 | 1.31 | 1.49 | 0.537 | 0.447 | 0.838 | 0.563 | 0.567 | ||
| WATCH | [-] | 0.131 | -0.697 | 1.64 | 2.52 | 0.117 | 0.591 | 1.01 | 0.710 | 0.603 |
Download Data |
Period Mean (original grids) [g m-2 d-1] |
Bias [g m-2 d-1] |
RMSE [g m-2 d-1] |
Phase Shift [months] |
Bias Score [1] |
RMSE Score [1] |
Seasonal Cycle Score [1] |
Interannual Variability Score [1] |
Overall Score [1] |
|||
|---|---|---|---|---|---|---|---|---|---|---|---|---|
| Benchmark | [-] | 0.812 | ||||||||||
| CRUNCEPv7 | [-] | 0.317 | -0.495 | 1.69 | 0.665 | 0.596 | 0.454 | 0.947 | 0.778 | 0.646 | ||
| GSWP3v1 | [-] | 0.264 | -0.548 | 1.62 | 0.684 | 0.580 | 0.466 | 0.948 | 0.738 | 0.640 | ||
| WATCH | [-] | 0.216 | -0.682 | 1.45 | 0.548 | 0.502 | 0.480 | 0.955 | 0.677 | 0.619 |
Download Data |
Period Mean (original grids) [g m-2 d-1] |
Bias [g m-2 d-1] |
RMSE [g m-2 d-1] |
Phase Shift [months] |
Bias Score [1] |
RMSE Score [1] |
Seasonal Cycle Score [1] |
Interannual Variability Score [1] |
Overall Score [1] |
|||
|---|---|---|---|---|---|---|---|---|---|---|---|---|
| Benchmark | [-] | 0.648 | ||||||||||
| CRUNCEPv7 | [-] | 0.260 | -0.388 | 1.59 | 0.927 | 0.572 | 0.460 | 0.933 | 0.776 | 0.640 | ||
| GSWP3v1 | [-] | 0.234 | -0.414 | 1.51 | 0.907 | 0.562 | 0.470 | 0.947 | 0.719 | 0.634 | ||
| WATCH | [-] | 0.214 | -0.499 | 1.51 | 1.16 | 0.543 | 0.492 | 0.933 | 0.686 | 0.629 |
Download Data |
Period Mean (original grids) [g m-2 d-1] |
Bias [g m-2 d-1] |
RMSE [g m-2 d-1] |
Phase Shift [months] |
Bias Score [1] |
RMSE Score [1] |
Seasonal Cycle Score [1] |
Interannual Variability Score [1] |
Overall Score [1] |
|||
|---|---|---|---|---|---|---|---|---|---|---|---|---|
| Benchmark | [-] | 0.587 | ||||||||||
| CRUNCEPv7 | [-] | 0.0491 | -0.538 | 1.01 | 1.02 | 0.561 | 0.392 | 0.933 | 0.780 | 0.611 | ||
| GSWP3v1 | [-] | 0.0515 | -0.536 | 1.02 | 2.03 | 0.562 | 0.381 | 0.749 | 0.828 | 0.580 | ||
| WATCH | [-] | 0.0601 | -0.407 | 1.02 | 2.03 | 0.523 | 0.231 | 0.749 | 0.735 | 0.494 |
Download Data |
Period Mean (original grids) [g m-2 d-1] |
Bias [g m-2 d-1] |
RMSE [g m-2 d-1] |
Phase Shift [months] |
Bias Score [1] |
RMSE Score [1] |
Seasonal Cycle Score [1] |
Interannual Variability Score [1] |
Overall Score [1] |
|||
|---|---|---|---|---|---|---|---|---|---|---|---|---|
| Benchmark | [-] | 0.841 | ||||||||||
| CRUNCEPv7 | [-] | 0.332 | -0.508 | 1.93 | 1.16 | 0.538 | 0.456 | 0.926 | 0.715 | 0.618 | ||
| GSWP3v1 | [-] | 0.314 | -0.527 | 1.89 | 1.16 | 0.528 | 0.458 | 0.926 | 0.651 | 0.604 | ||
| WATCH | [-] | 0.310 | -0.572 | 1.86 | 0.954 | 0.653 | 0.497 | 0.839 | 0.659 | 0.629 |
Download Data |
Period Mean (original grids) [g m-2 d-1] |
Bias [g m-2 d-1] |
RMSE [g m-2 d-1] |
Phase Shift [months] |
Bias Score [1] |
RMSE Score [1] |
Seasonal Cycle Score [1] |
Interannual Variability Score [1] |
Overall Score [1] |
|||
|---|---|---|---|---|---|---|---|---|---|---|---|---|
| Benchmark | [-] | -0.0705 | ||||||||||
| CRUNCEPv7 | [-] | 0.0753 | 0.146 | 1.07 | 0.576 | -0.0268 | -0.342 | 0.618 | -0.373 | -0.0932 | ||
| GSWP3v1 | [-] | 0.110 | 0.181 | 0.831 | 0.504 | -0.210 | -0.227 | 0.604 | 0.109 | 0.00987 | ||
| WATCH | [-] | 0.141 | 0.358 | 1.03 | 2.89 | -0.207 | -0.0374 | -0.364 | 0.189 | -0.0913 |
Download Data |
Period Mean (original grids) [g m-2 d-1] |
Bias [g m-2 d-1] |
RMSE [g m-2 d-1] |
Phase Shift [months] |
Bias Score [1] |
RMSE Score [1] |
Seasonal Cycle Score [1] |
Interannual Variability Score [1] |
Overall Score [1] |
|||
|---|---|---|---|---|---|---|---|---|---|---|---|---|
| Benchmark | [-] | 0.656 | ||||||||||
| CRUNCEPv7 | [-] | 0.181 | -0.475 | 1.49 | 1.53 | 0.282 | 0.391 | 0.916 | 0.819 | 0.560 | ||
| GSWP3v1 | [-] | 0.150 | -0.506 | 1.47 | 0.678 | 0.272 | 0.410 | 0.891 | 0.658 | 0.528 | ||
| WATCH | [-] | 0.166 | -0.599 | 1.69 | 1.02 | 0.322 | 0.378 | 0.859 | 0.656 | 0.519 |
Download Data |
Period Mean (original grids) [g m-2 d-1] |
Bias [g m-2 d-1] |
RMSE [g m-2 d-1] |
Phase Shift [months] |
Bias Score [1] |
RMSE Score [1] |
Seasonal Cycle Score [1] |
Interannual Variability Score [1] |
Overall Score [1] |
|||
|---|---|---|---|---|---|---|---|---|---|---|---|---|
| Benchmark | [-] | 1.07 | ||||||||||
| CRUNCEPv7 | [-] | 0.230 | -0.844 | 1.35 | 2.03 | 0.456 | 0.373 | 0.749 | 0.434 | 0.477 | ||
| GSWP3v1 | [-] | 0.208 | -0.866 | 1.41 | 4.08 | 0.447 | 0.369 | 0.244 | 0.438 | 0.373 | ||
| WATCH | [-] | 0.243 | -0.927 | 1.31 | 4.08 | 0.379 | 0.360 | 0.244 | 0.459 | 0.360 |
Temporally integrated period mean