Mean State
Download Data |
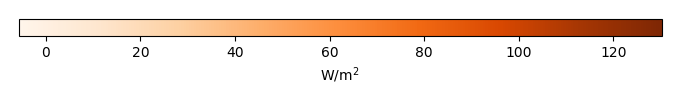
Period Mean (original grids) [W/m2] |
Model Period Mean (intersection) [W/m2] |
Model Period Mean (complement) [W/m2] |
Benchmark Period Mean (intersection) [W/m2] |
Benchmark Period Mean (complement) [W/m2] |
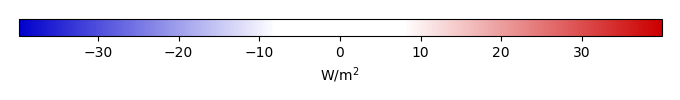
Bias [W/m2] |
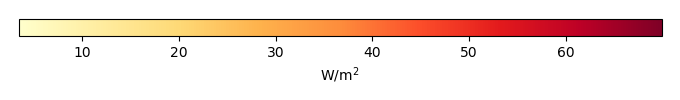
RMSE [W/m2] |
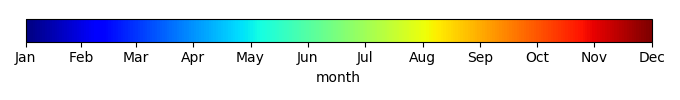
Phase Shift [months] |
Bias Score [1] |
RMSE Score [1] |
Seasonal Cycle Score [1] |
Spatial Distribution Score [1] |
Overall Score [1] |
|||
|---|---|---|---|---|---|---|---|---|---|---|---|---|---|---|---|---|
| Benchmark | [-] | 70.6 | ||||||||||||||
| CRUNCEPv7 | [-] | 83.0 | 83.7 | 73.3 | 70.7 | 18.1 | 12.5 | 23.9 | 2.41 | 0.209 | 0.113 | 0.532 | 0.947 | 0.383 | ||
| GSWP3v1 | [-] | 70.8 | 71.3 | 62.2 | 70.7 | 18.1 | -0.0585 | 16.6 | 1.34 | 0.385 | 0.166 | 0.811 | 0.990 | 0.504 | ||
| WATCH | [-] | 50.5 | 50.9 | 49.8 | 70.4 | 18.0 | -19.8 | 28.4 | 1.61 | 0.113 | 0.195 | 0.734 | 0.721 | 0.392 |
Download Data |
Period Mean (original grids) [W/m2] |
Model Period Mean (intersection) [W/m2] |
Model Period Mean (complement) [W/m2] |
Benchmark Period Mean (intersection) [W/m2] |
Benchmark Period Mean (complement) [W/m2] |
Bias [W/m2] |
RMSE [W/m2] |
Phase Shift [months] |
Bias Score [1] |
RMSE Score [1] |
Seasonal Cycle Score [1] |
Spatial Distribution Score [1] |
Overall Score [1] |
|||
|---|---|---|---|---|---|---|---|---|---|---|---|---|---|---|---|---|
| Benchmark | [-] | 47.3 | ||||||||||||||
| CRUNCEPv7 | [-] | 48.4 | 47.6 | 37.9 | 47.3 | 34.2 | 0.0734 | 21.1 | 1.02 | 0.739 | 0.477 | 0.825 | 0.987 | 0.701 | ||
| GSWP3v1 | [-] | 46.7 | 46.1 | 37.1 | 47.3 | 34.2 | -1.40 | 22.7 | 1.43 | 0.701 | 0.452 | 0.726 | 0.922 | 0.651 | ||
| WATCH | [-] | 40.4 | 40.0 | 35.5 | 46.9 | 34.2 | -7.01 | 29.5 | 1.93 | 0.592 | 0.363 | 0.636 | 0.768 | 0.544 |
Download Data |
Period Mean (original grids) [W/m2] |
Model Period Mean (intersection) [W/m2] |
Model Period Mean (complement) [W/m2] |
Benchmark Period Mean (intersection) [W/m2] |
Benchmark Period Mean (complement) [W/m2] |
Bias [W/m2] |
RMSE [W/m2] |
Phase Shift [months] |
Bias Score [1] |
RMSE Score [1] |
Seasonal Cycle Score [1] |
Spatial Distribution Score [1] |
Overall Score [1] |
|||
|---|---|---|---|---|---|---|---|---|---|---|---|---|---|---|---|---|
| Benchmark | [-] | 52.1 | ||||||||||||||
| CRUNCEPv7 | [-] | 55.2 | 54.8 | 60.8 | 52.2 | 23.6 | 2.70 | 21.3 | 0.967 | 0.606 | 0.453 | 0.874 | 0.942 | 0.666 | ||
| GSWP3v1 | [-] | 48.3 | 48.2 | 51.1 | 52.2 | 23.6 | -4.01 | 21.5 | 1.24 | 0.578 | 0.452 | 0.816 | 0.972 | 0.654 | ||
| WATCH | [-] | 44.1 | 43.8 | 49.8 | 52.3 | 23.8 | -8.28 | 22.6 | 1.68 | 0.538 | 0.436 | 0.721 | 0.946 | 0.616 |
Download Data |
Period Mean (original grids) [W/m2] |
Model Period Mean (intersection) [W/m2] |
Model Period Mean (complement) [W/m2] |
Benchmark Period Mean (intersection) [W/m2] |
Benchmark Period Mean (complement) [W/m2] |
Bias [W/m2] |
RMSE [W/m2] |
Phase Shift [months] |
Bias Score [1] |
RMSE Score [1] |
Seasonal Cycle Score [1] |
Spatial Distribution Score [1] |
Overall Score [1] |
|||
|---|---|---|---|---|---|---|---|---|---|---|---|---|---|---|---|---|
| Benchmark | [-] | 14.9 | ||||||||||||||
| CRUNCEPv7 | [-] | 13.7 | 14.0 | 8.81 | 15.0 | 3.59 | -1.39 | 11.6 | 0.201 | 0.831 | 0.631 | 1.00 | 0.803 | 0.780 | ||
| GSWP3v1 | [-] | 15.5 | 15.7 | 11.3 | 15.0 | 3.59 | 0.460 | 12.0 | 0.219 | 0.857 | 0.612 | 1.00 | 0.698 | 0.757 | ||
| WATCH | [-] | 12.9 | 12.9 | 12.2 | 14.8 | 3.56 | -1.88 | 8.96 | 0.140 | 0.841 | 0.714 | 1.01 | 0.557 | 0.767 |
Download Data |
Period Mean (original grids) [W/m2] |
Model Period Mean (intersection) [W/m2] |
Model Period Mean (complement) [W/m2] |
Benchmark Period Mean (intersection) [W/m2] |
Benchmark Period Mean (complement) [W/m2] |
Bias [W/m2] |
RMSE [W/m2] |
Phase Shift [months] |
Bias Score [1] |
RMSE Score [1] |
Seasonal Cycle Score [1] |
Spatial Distribution Score [1] |
Overall Score [1] |
|||
|---|---|---|---|---|---|---|---|---|---|---|---|---|---|---|---|---|
| Benchmark | [-] | 77.5 | ||||||||||||||
| CRUNCEPv7 | [-] | 127. | 127. | 126. | 80.4 | 34.5 | 45.9 | 48.4 | 2.07 | 0.0312 | 0.109 | 0.684 | 0.597 | 0.306 | ||
| GSWP3v1 | [-] | 95.5 | 94.9 | 98.6 | 80.4 | 34.5 | 15.1 | 25.4 | 2.16 | 0.262 | 0.174 | 0.660 | 0.278 | 0.310 | ||
| WATCH | [-] | 75.6 | 73.0 | 90.1 | 80.3 | 34.5 | -3.06 | 32.3 | 2.20 | 0.0825 | 0.139 | 0.661 | 0.790 | 0.362 |
Download Data |
Period Mean (original grids) [W/m2] |
Model Period Mean (intersection) [W/m2] |
Model Period Mean (complement) [W/m2] |
Benchmark Period Mean (intersection) [W/m2] |
Benchmark Period Mean (complement) [W/m2] |
Bias [W/m2] |
RMSE [W/m2] |
Phase Shift [months] |
Bias Score [1] |
RMSE Score [1] |
Seasonal Cycle Score [1] |
Spatial Distribution Score [1] |
Overall Score [1] |
|||
|---|---|---|---|---|---|---|---|---|---|---|---|---|---|---|---|---|
| Benchmark | [-] | 26.3 | ||||||||||||||
| CRUNCEPv7 | [-] | 29.3 | 29.4 | 24.8 | 26.3 | 3.49 | 3.00 | 12.5 | 0.288 | 0.850 | 0.672 | 0.981 | 0.965 | 0.828 | ||
| GSWP3v1 | [-] | 25.1 | 25.0 | 25.4 | 26.3 | 3.49 | -1.27 | 10.8 | 0.351 | 0.884 | 0.708 | 0.977 | 0.990 | 0.853 | ||
| WATCH | [-] | 21.8 | 21.7 | 23.3 | 26.3 | 3.71 | -4.54 | 9.95 | 0.513 | 0.827 | 0.745 | 0.966 | 0.896 | 0.836 |
Download Data |
Period Mean (original grids) [W/m2] |
Model Period Mean (intersection) [W/m2] |
Model Period Mean (complement) [W/m2] |
Benchmark Period Mean (intersection) [W/m2] |
Benchmark Period Mean (complement) [W/m2] |
Bias [W/m2] |
RMSE [W/m2] |
Phase Shift [months] |
Bias Score [1] |
RMSE Score [1] |
Seasonal Cycle Score [1] |
Spatial Distribution Score [1] |
Overall Score [1] |
|||
|---|---|---|---|---|---|---|---|---|---|---|---|---|---|---|---|---|
| Benchmark | [-] | 28.0 | ||||||||||||||
| CRUNCEPv7 | [-] | 30.3 | 30.5 | 24.6 | 28.1 | 13.0 | 2.94 | 15.3 | 0.566 | 0.750 | 0.547 | 0.969 | 0.969 | 0.756 | ||
| GSWP3v1 | [-] | 26.2 | 26.5 | 20.0 | 28.1 | 13.0 | -1.20 | 14.1 | 0.647 | 0.715 | 0.610 | 0.956 | 0.927 | 0.763 | ||
| WATCH | [-] | 24.1 | 24.2 | 19.7 | 28.0 | 12.8 | -3.40 | 14.6 | 0.754 | 0.660 | 0.621 | 0.940 | 0.815 | 0.731 |
Download Data |
Period Mean (original grids) [W/m2] |
Model Period Mean (intersection) [W/m2] |
Model Period Mean (complement) [W/m2] |
Benchmark Period Mean (intersection) [W/m2] |
Benchmark Period Mean (complement) [W/m2] |
Bias [W/m2] |
RMSE [W/m2] |
Phase Shift [months] |
Bias Score [1] |
RMSE Score [1] |
Seasonal Cycle Score [1] |
Spatial Distribution Score [1] |
Overall Score [1] |
|||
|---|---|---|---|---|---|---|---|---|---|---|---|---|---|---|---|---|
| Benchmark | [-] | 57.0 | ||||||||||||||
| CRUNCEPv7 | [-] | 68.8 | 67.9 | 87.5 | 57.2 | 29.3 | 13.3 | 28.0 | 1.22 | 0.520 | 0.363 | 0.841 | 0.947 | 0.607 | ||
| GSWP3v1 | [-] | 56.9 | 56.1 | 71.3 | 57.2 | 29.3 | 0.854 | 25.7 | 1.75 | 0.570 | 0.355 | 0.733 | 0.960 | 0.595 | ||
| WATCH | [-] | 48.3 | 47.6 | 65.3 | 56.9 | 29.3 | -7.00 | 29.3 | 2.07 | 0.414 | 0.347 | 0.670 | 0.899 | 0.535 |
Download Data |
Period Mean (original grids) [W/m2] |
Model Period Mean (intersection) [W/m2] |
Model Period Mean (complement) [W/m2] |
Benchmark Period Mean (intersection) [W/m2] |
Benchmark Period Mean (complement) [W/m2] |
Bias [W/m2] |
RMSE [W/m2] |
Phase Shift [months] |
Bias Score [1] |
RMSE Score [1] |
Seasonal Cycle Score [1] |
Spatial Distribution Score [1] |
Overall Score [1] |
|||
|---|---|---|---|---|---|---|---|---|---|---|---|---|---|---|---|---|
| Benchmark | [-] | 15.7 | ||||||||||||||
| CRUNCEPv7 | [-] | 15.9 | 16.4 | 6.06 | 15.8 | -6.07 | 0.228 | 12.8 | 0.0919 | 0.890 | 0.595 | 1.01 | 0.882 | 0.795 | ||
| GSWP3v1 | [-] | 16.7 | 17.1 | 9.17 | 15.8 | -6.07 | 1.09 | 14.3 | 0.101 | 0.921 | 0.550 | 1.01 | 0.753 | 0.756 | ||
| WATCH | [-] | 12.6 | 12.9 | 9.41 | 15.7 | -6.08 | -2.93 | 10.4 | 0.191 | 0.837 | 0.676 | 1.00 | 0.557 | 0.749 |
Download Data |
Period Mean (original grids) [W/m2] |
Model Period Mean (intersection) [W/m2] |
Model Period Mean (complement) [W/m2] |
Benchmark Period Mean (intersection) [W/m2] |
Benchmark Period Mean (complement) [W/m2] |
Bias [W/m2] |
RMSE [W/m2] |
Phase Shift [months] |
Bias Score [1] |
RMSE Score [1] |
Seasonal Cycle Score [1] |
Spatial Distribution Score [1] |
Overall Score [1] |
|||
|---|---|---|---|---|---|---|---|---|---|---|---|---|---|---|---|---|
| Benchmark | [-] | 26.8 | ||||||||||||||
| CRUNCEPv7 | [-] | 33.2 | 32.2 | 52.2 | 26.9 | 19.3 | 7.11 | 18.3 | 0.630 | 0.636 | 0.385 | 0.945 | 0.847 | 0.640 | ||
| GSWP3v1 | [-] | 32.6 | 31.6 | 52.1 | 26.9 | 19.3 | 6.35 | 16.8 | 0.693 | 0.667 | 0.412 | 0.935 | 0.916 | 0.669 | ||
| WATCH | [-] | 32.0 | 31.1 | 50.4 | 27.3 | 19.5 | 5.42 | 16.8 | 0.906 | 0.677 | 0.411 | 0.916 | 0.942 | 0.672 |
Download Data |
Period Mean (original grids) [W/m2] |
Model Period Mean (intersection) [W/m2] |
Model Period Mean (complement) [W/m2] |
Benchmark Period Mean (intersection) [W/m2] |
Benchmark Period Mean (complement) [W/m2] |
Bias [W/m2] |
RMSE [W/m2] |
Phase Shift [months] |
Bias Score [1] |
RMSE Score [1] |
Seasonal Cycle Score [1] |
Spatial Distribution Score [1] |
Overall Score [1] |
|||
|---|---|---|---|---|---|---|---|---|---|---|---|---|---|---|---|---|
| Benchmark | [-] | 31.2 | ||||||||||||||
| CRUNCEPv7 | [-] | 38.9 | 38.9 | 38.5 | 31.7 | 9.65 | 7.13 | 19.9 | 0.324 | 0.773 | 0.519 | 0.981 | 0.814 | 0.721 | ||
| GSWP3v1 | [-] | 33.4 | 33.4 | 33.3 | 31.7 | 9.65 | 1.79 | 15.3 | 0.325 | 0.795 | 0.612 | 0.982 | 0.724 | 0.745 | ||
| WATCH | [-] | 25.1 | 24.9 | 29.8 | 31.5 | 9.61 | -6.01 | 15.9 | 0.465 | 0.654 | 0.671 | 0.973 | 0.654 | 0.725 |
Download Data |
Period Mean (original grids) [W/m2] |
Model Period Mean (intersection) [W/m2] |
Model Period Mean (complement) [W/m2] |
Benchmark Period Mean (intersection) [W/m2] |
Benchmark Period Mean (complement) [W/m2] |
Bias [W/m2] |
RMSE [W/m2] |
Phase Shift [months] |
Bias Score [1] |
RMSE Score [1] |
Seasonal Cycle Score [1] |
Spatial Distribution Score [1] |
Overall Score [1] |
|||
|---|---|---|---|---|---|---|---|---|---|---|---|---|---|---|---|---|
| Benchmark | [-] | 39.1 | ||||||||||||||
| CRUNCEPv7 | [-] | 38.6 | 45.8 | 8.48 | 39.4 | 16.4 | 6.99 | 19.5 | 0.843 | 0.518 | 0.384 | 0.849 | 0.937 | 0.615 | ||
| GSWP3v1 | [-] | 33.9 | 40.2 | 7.50 | 39.4 | 16.4 | 1.20 | 16.5 | 0.895 | 0.611 | 0.424 | 0.849 | 0.973 | 0.656 | ||
| WATCH | [-] | 29.6 | 35.0 | 6.97 | 39.4 | 16.5 | -3.82 | 17.5 | 1.06 | 0.503 | 0.433 | 0.812 | 0.928 | 0.622 |
Download Data |
Period Mean (original grids) [W/m2] |
Model Period Mean (intersection) [W/m2] |
Model Period Mean (complement) [W/m2] |
Benchmark Period Mean (intersection) [W/m2] |
Benchmark Period Mean (complement) [W/m2] |
Bias [W/m2] |
RMSE [W/m2] |
Phase Shift [months] |
Bias Score [1] |
RMSE Score [1] |
Seasonal Cycle Score [1] |
Spatial Distribution Score [1] |
Overall Score [1] |
|||
|---|---|---|---|---|---|---|---|---|---|---|---|---|---|---|---|---|
| Benchmark | [-] | 8.45 | ||||||||||||||
| CRUNCEPv7 | [-] | 7.94 | 14.3 | 2.14 | 8.47 | 5.81 | 6.22 | 13.5 | 1.06 | 0.545 | 0.238 | 0.928 | 0.933 | 0.576 | ||
| GSWP3v1 | [-] | 8.46 | 14.3 | 3.21 | 8.47 | 5.81 | 6.13 | 13.3 | 1.12 | 0.549 | 0.258 | 0.927 | 0.932 | 0.585 | ||
| WATCH | [-] | 7.72 | 13.5 | 2.48 | 8.46 | 5.81 | 5.37 | 13.2 | 1.20 | 0.577 | 0.275 | 0.908 | 0.904 | 0.588 |
Download Data |
Period Mean (original grids) [W/m2] |
Model Period Mean (intersection) [W/m2] |
Model Period Mean (complement) [W/m2] |
Benchmark Period Mean (intersection) [W/m2] |
Benchmark Period Mean (complement) [W/m2] |
Bias [W/m2] |
RMSE [W/m2] |
Phase Shift [months] |
Bias Score [1] |
RMSE Score [1] |
Seasonal Cycle Score [1] |
Spatial Distribution Score [1] |
Overall Score [1] |
|||
|---|---|---|---|---|---|---|---|---|---|---|---|---|---|---|---|---|
| Benchmark | [-] | 14.0 | ||||||||||||||
| CRUNCEPv7 | [-] | 13.8 | 14.2 | 5.57 | 14.0 | 1.27 | -0.298 | 12.0 | 0.243 | 0.804 | 0.565 | 0.995 | 0.926 | 0.771 | ||
| GSWP3v1 | [-] | 15.9 | 16.3 | 7.53 | 14.0 | 1.27 | 1.78 | 12.9 | 0.293 | 0.850 | 0.544 | 0.988 | 0.887 | 0.763 | ||
| WATCH | [-] | 13.9 | 14.2 | 8.33 | 14.0 | 1.25 | -0.00689 | 9.94 | 0.363 | 0.832 | 0.651 | 0.983 | 0.763 | 0.776 |
Download Data |
Period Mean (original grids) [W/m2] |
Model Period Mean (intersection) [W/m2] |
Model Period Mean (complement) [W/m2] |
Benchmark Period Mean (intersection) [W/m2] |
Benchmark Period Mean (complement) [W/m2] |
Bias [W/m2] |
RMSE [W/m2] |
Phase Shift [months] |
Bias Score [1] |
RMSE Score [1] |
Seasonal Cycle Score [1] |
Spatial Distribution Score [1] |
Overall Score [1] |
|||
|---|---|---|---|---|---|---|---|---|---|---|---|---|---|---|---|---|
| Benchmark | [-] | 50.4 | ||||||||||||||
| CRUNCEPv7 | [-] | 62.0 | 60.9 | 73.8 | 50.9 | 20.2 | 13.9 | 27.3 | 0.907 | 0.416 | 0.299 | 0.885 | 0.863 | 0.552 | ||
| GSWP3v1 | [-] | 57.0 | 56.5 | 63.8 | 50.9 | 20.2 | 8.13 | 21.5 | 0.909 | 0.499 | 0.361 | 0.887 | 0.961 | 0.614 | ||
| WATCH | [-] | 48.9 | 48.2 | 57.1 | 50.8 | 20.1 | 0.186 | 21.2 | 1.04 | 0.413 | 0.383 | 0.856 | 0.948 | 0.597 |
Download Data |
Period Mean (original grids) [W/m2] |
Model Period Mean (intersection) [W/m2] |
Model Period Mean (complement) [W/m2] |
Benchmark Period Mean (intersection) [W/m2] |
Benchmark Period Mean (complement) [W/m2] |
Bias [W/m2] |
RMSE [W/m2] |
Phase Shift [months] |
Bias Score [1] |
RMSE Score [1] |
Seasonal Cycle Score [1] |
Spatial Distribution Score [1] |
Overall Score [1] |
|||
|---|---|---|---|---|---|---|---|---|---|---|---|---|---|---|---|---|
| Benchmark | [-] | 49.7 | ||||||||||||||
| CRUNCEPv7 | [-] | 56.4 | 56.4 | 65.6 | 49.8 | 19.0 | 7.17 | 19.9 | 0.578 | 0.801 | 0.614 | 0.959 | 0.980 | 0.793 | ||
| GSWP3v1 | [-] | 50.0 | 49.8 | 59.9 | 49.8 | 19.0 | 0.529 | 15.5 | 0.470 | 0.831 | 0.703 | 0.963 | 0.847 | 0.809 | ||
| WATCH | [-] | 45.8 | 45.7 | 53.1 | 49.8 | 19.0 | -3.81 | 15.2 | 0.496 | 0.779 | 0.719 | 0.963 | 0.778 | 0.791 |
Download Data |
Period Mean (original grids) [W/m2] |
Model Period Mean (intersection) [W/m2] |
Model Period Mean (complement) [W/m2] |
Benchmark Period Mean (intersection) [W/m2] |
Benchmark Period Mean (complement) [W/m2] |
Bias [W/m2] |
RMSE [W/m2] |
Phase Shift [months] |
Bias Score [1] |
RMSE Score [1] |
Seasonal Cycle Score [1] |
Spatial Distribution Score [1] |
Overall Score [1] |
|||
|---|---|---|---|---|---|---|---|---|---|---|---|---|---|---|---|---|
| Benchmark | [-] | 25.2 | ||||||||||||||
| CRUNCEPv7 | [-] | 34.5 | 34.6 | 35.3 | 25.4 | 10.7 | 9.12 | 18.1 | 0.323 | 0.713 | 0.552 | 0.979 | 0.975 | 0.754 | ||
| GSWP3v1 | [-] | 30.4 | 30.4 | 34.3 | 25.4 | 10.7 | 4.98 | 13.7 | 0.267 | 0.814 | 0.625 | 0.984 | 0.921 | 0.794 | ||
| WATCH | [-] | 26.5 | 26.5 | 32.7 | 25.4 | 11.1 | 1.22 | 9.89 | 0.277 | 0.848 | 0.721 | 0.982 | 0.866 | 0.828 |
Download Data |
Period Mean (original grids) [W/m2] |
Model Period Mean (intersection) [W/m2] |
Model Period Mean (complement) [W/m2] |
Benchmark Period Mean (intersection) [W/m2] |
Benchmark Period Mean (complement) [W/m2] |
Bias [W/m2] |
RMSE [W/m2] |
Phase Shift [months] |
Bias Score [1] |
RMSE Score [1] |
Seasonal Cycle Score [1] |
Spatial Distribution Score [1] |
Overall Score [1] |
|||
|---|---|---|---|---|---|---|---|---|---|---|---|---|---|---|---|---|
| Benchmark | [-] | 27.2 | ||||||||||||||
| CRUNCEPv7 | [-] | 25.7 | 26.1 | 37.1 | 27.2 | 14.3 | -0.950 | 12.9 | 0.710 | 0.741 | 0.543 | 0.940 | 0.979 | 0.749 | ||
| GSWP3v1 | [-] | 25.9 | 26.4 | 31.7 | 27.2 | 14.3 | -0.645 | 13.1 | 0.668 | 0.729 | 0.542 | 0.946 | 0.978 | 0.748 | ||
| WATCH | [-] | 26.7 | 27.0 | 34.5 | 27.3 | 14.4 | -0.149 | 13.2 | 0.717 | 0.723 | 0.545 | 0.940 | 0.955 | 0.742 |
Download Data |
Period Mean (original grids) [W/m2] |
Model Period Mean (intersection) [W/m2] |
Model Period Mean (complement) [W/m2] |
Benchmark Period Mean (intersection) [W/m2] |
Benchmark Period Mean (complement) [W/m2] |
Bias [W/m2] |
RMSE [W/m2] |
Phase Shift [months] |
Bias Score [1] |
RMSE Score [1] |
Seasonal Cycle Score [1] |
Spatial Distribution Score [1] |
Overall Score [1] |
|||
|---|---|---|---|---|---|---|---|---|---|---|---|---|---|---|---|---|
| Benchmark | [-] | 90.0 | ||||||||||||||
| CRUNCEPv7 | [-] | 114. | 114. | 112. | 90.2 | 27.7 | 23.7 | 30.3 | 2.08 | 0.0925 | 0.121 | 0.688 | 0.965 | 0.397 | ||
| GSWP3v1 | [-] | 91.4 | 91.5 | 87.6 | 90.2 | 27.7 | 1.06 | 14.5 | 1.90 | 0.445 | 0.203 | 0.727 | 0.920 | 0.499 | ||
| WATCH | [-] | 78.2 | 78.1 | 81.5 | 90.1 | 27.9 | -12.1 | 19.7 | 2.11 | 0.190 | 0.196 | 0.693 | 0.989 | 0.453 |
Download Data |
Period Mean (original grids) [W/m2] |
Model Period Mean (intersection) [W/m2] |
Model Period Mean (complement) [W/m2] |
Benchmark Period Mean (intersection) [W/m2] |
Benchmark Period Mean (complement) [W/m2] |
Bias [W/m2] |
RMSE [W/m2] |
Phase Shift [months] |
Bias Score [1] |
RMSE Score [1] |
Seasonal Cycle Score [1] |
Spatial Distribution Score [1] |
Overall Score [1] |
|||
|---|---|---|---|---|---|---|---|---|---|---|---|---|---|---|---|---|
| Benchmark | [-] | 69.7 | ||||||||||||||
| CRUNCEPv7 | [-] | 74.2 | 73.7 | 82.3 | 69.8 | 17.5 | 4.18 | 24.7 | 0.843 | 0.520 | 0.429 | 0.911 | 0.835 | 0.625 | ||
| GSWP3v1 | [-] | 65.2 | 64.8 | 69.8 | 69.8 | 17.5 | -4.76 | 20.5 | 0.946 | 0.636 | 0.469 | 0.905 | 0.990 | 0.694 | ||
| WATCH | [-] | 62.1 | 61.8 | 64.7 | 69.9 | 17.5 | -8.06 | 19.6 | 1.08 | 0.600 | 0.516 | 0.868 | 0.989 | 0.698 |
Download Data |
Period Mean (original grids) [W/m2] |
Model Period Mean (intersection) [W/m2] |
Model Period Mean (complement) [W/m2] |
Benchmark Period Mean (intersection) [W/m2] |
Benchmark Period Mean (complement) [W/m2] |
Bias [W/m2] |
RMSE [W/m2] |
Phase Shift [months] |
Bias Score [1] |
RMSE Score [1] |
Seasonal Cycle Score [1] |
Spatial Distribution Score [1] |
Overall Score [1] |
|||
|---|---|---|---|---|---|---|---|---|---|---|---|---|---|---|---|---|
| Benchmark | [-] | 22.7 | ||||||||||||||
| CRUNCEPv7 | [-] | 25.0 | 25.2 | 17.3 | 23.0 | 8.02 | 3.14 | 15.7 | 0.807 | 0.466 | 0.371 | 0.936 | 0.892 | 0.607 | ||
| GSWP3v1 | [-] | 27.6 | 27.9 | 17.3 | 23.0 | 8.02 | 4.79 | 15.2 | 0.929 | 0.510 | 0.376 | 0.917 | 0.948 | 0.625 | ||
| WATCH | [-] | 21.1 | 21.2 | 14.9 | 23.0 | 7.98 | -1.61 | 14.3 | 0.842 | 0.480 | 0.409 | 0.924 | 0.920 | 0.629 |
Temporally integrated period mean