Mean State
Download Data |
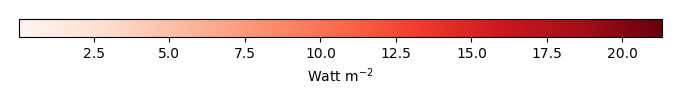
Period Mean (original grids) [Watt m-2] |
Model Period Mean (intersection) [Watt m-2] |
Model Period Mean (complement) [Watt m-2] |
Benchmark Period Mean (intersection) [Watt m-2] |
Benchmark Period Mean (complement) [Watt m-2] |
Bias [Watt m-2] |
RMSE [Watt m-2] |
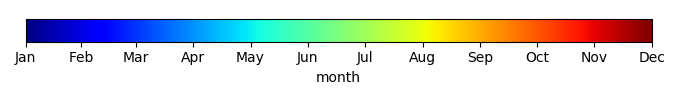
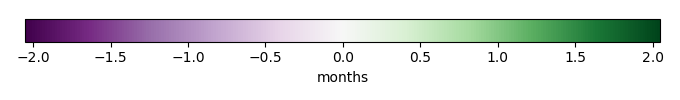
Phase Shift [months] |
Bias Score [1] |
RMSE Score [1] |
Seasonal Cycle Score [1] |
Spatial Distribution Score [1] |
Interannual Variability Score [1] |
Overall Score [1] |
|||
|---|---|---|---|---|---|---|---|---|---|---|---|---|---|---|---|---|---|
| Benchmark | [-] | 179. | |||||||||||||||
| CRUNCEPv7 | [-] | 191. | 191. | 177. | 216. | 14.0 | 24.2 | 1.11 | 0.437 | 0.449 | 0.853 | 0.952 | 0.516 | 0.609 | |||
| GSWP3v1 | [-] | 183. | 183. | 177. | 216. | 5.83 | 16.7 | 0.533 | 0.627 | 0.521 | 0.930 | 0.936 | 0.731 | 0.711 | |||
| WATCH | [-] | 140. | 140. | 177. | 217. | -36.3 | 42.4 | 1.57 | 0.249 | 0.412 | 0.764 | 0.833 | 0.770 | 0.574 |
Download Data |
Period Mean (original grids) [Watt m-2] |
Model Period Mean (intersection) [Watt m-2] |
Model Period Mean (complement) [Watt m-2] |
Benchmark Period Mean (intersection) [Watt m-2] |
Benchmark Period Mean (complement) [Watt m-2] |
Bias [Watt m-2] |
RMSE [Watt m-2] |
Phase Shift [months] |
Bias Score [1] |
RMSE Score [1] |
Seasonal Cycle Score [1] |
Spatial Distribution Score [1] |
Interannual Variability Score [1] |
Overall Score [1] |
|||
|---|---|---|---|---|---|---|---|---|---|---|---|---|---|---|---|---|---|
| Benchmark | [-] | 189. | |||||||||||||||
| CRUNCEPv7 | [-] | 198. | 198. | 188. | 224. | 9.50 | 22.8 | 1.64 | 0.577 | 0.456 | 0.761 | 0.902 | 0.671 | 0.637 | |||
| GSWP3v1 | [-] | 195. | 195. | 188. | 224. | 6.89 | 16.6 | 0.458 | 0.662 | 0.533 | 0.955 | 0.998 | 0.783 | 0.744 | |||
| WATCH | [-] | 159. | 160. | 188. | 224. | -27.9 | 33.6 | 0.577 | 0.341 | 0.490 | 0.935 | 0.853 | 0.641 | 0.625 |
Download Data |
Period Mean (original grids) [Watt m-2] |
Model Period Mean (intersection) [Watt m-2] |
Model Period Mean (complement) [Watt m-2] |
Benchmark Period Mean (intersection) [Watt m-2] |
Benchmark Period Mean (complement) [Watt m-2] |
Bias [Watt m-2] |
RMSE [Watt m-2] |
Phase Shift [months] |
Bias Score [1] |
RMSE Score [1] |
Seasonal Cycle Score [1] |
Spatial Distribution Score [1] |
Interannual Variability Score [1] |
Overall Score [1] |
|||
|---|---|---|---|---|---|---|---|---|---|---|---|---|---|---|---|---|---|
| Benchmark | [-] | 194. | |||||||||||||||
| CRUNCEPv7 | [-] | 194. | 194. | 192. | 221. | 2.03 | 22.6 | 1.19 | 0.694 | 0.500 | 0.837 | 0.751 | 0.534 | 0.636 | |||
| GSWP3v1 | [-] | 197. | 197. | 192. | 221. | 3.85 | 18.7 | 0.529 | 0.718 | 0.563 | 0.926 | 0.960 | 0.668 | 0.733 | |||
| WATCH | [-] | 180. | 180. | 192. | 221. | -12.3 | 24.3 | 0.642 | 0.581 | 0.550 | 0.922 | 0.968 | 0.684 | 0.709 |
Download Data |
Period Mean (original grids) [Watt m-2] |
Model Period Mean (intersection) [Watt m-2] |
Model Period Mean (complement) [Watt m-2] |
Benchmark Period Mean (intersection) [Watt m-2] |
Benchmark Period Mean (complement) [Watt m-2] |
Bias [Watt m-2] |
RMSE [Watt m-2] |
Phase Shift [months] |
Bias Score [1] |
RMSE Score [1] |
Seasonal Cycle Score [1] |
Spatial Distribution Score [1] |
Interannual Variability Score [1] |
Overall Score [1] |
|||
|---|---|---|---|---|---|---|---|---|---|---|---|---|---|---|---|---|---|
| Benchmark | [-] | 81.3 | |||||||||||||||
| CRUNCEPv7 | [-] | 74.9 | 75.0 | 80.9 | 86.2 | -7.45 | 22.7 | 0.352 | 0.876 | 0.732 | 0.977 | 0.872 | 0.607 | 0.799 | |||
| GSWP3v1 | [-] | 72.8 | 72.9 | 80.9 | 86.2 | -9.00 | 20.1 | 0.218 | 0.871 | 0.754 | 0.986 | 0.924 | 0.696 | 0.831 | |||
| WATCH | [-] | 65.2 | 65.3 | 81.6 | 87.0 | -16.4 | 23.2 | 0.255 | 0.789 | 0.759 | 0.983 | 0.973 | 0.694 | 0.826 |
Download Data |
Period Mean (original grids) [Watt m-2] |
Model Period Mean (intersection) [Watt m-2] |
Model Period Mean (complement) [Watt m-2] |
Benchmark Period Mean (intersection) [Watt m-2] |
Benchmark Period Mean (complement) [Watt m-2] |
Bias [Watt m-2] |
RMSE [Watt m-2] |
Phase Shift [months] |
Bias Score [1] |
RMSE Score [1] |
Seasonal Cycle Score [1] |
Spatial Distribution Score [1] |
Interannual Variability Score [1] |
Overall Score [1] |
|||
|---|---|---|---|---|---|---|---|---|---|---|---|---|---|---|---|---|---|
| Benchmark | [-] | 189. | |||||||||||||||
| CRUNCEPv7 | [-] | 186. | 186. | 183. | 210. | 5.12 | 25.9 | 1.53 | 0.491 | 0.411 | 0.774 | 0.550 | 0.466 | 0.517 | |||
| GSWP3v1 | [-] | 177. | 177. | 183. | 210. | -2.07 | 20.5 | 0.665 | 0.611 | 0.455 | 0.909 | 0.728 | 0.713 | 0.645 | |||
| WATCH | [-] | 142. | 141. | 184. | 210. | -34.4 | 41.1 | 1.46 | 0.286 | 0.386 | 0.776 | 0.912 | 0.759 | 0.584 |
Download Data |
Period Mean (original grids) [Watt m-2] |
Model Period Mean (intersection) [Watt m-2] |
Model Period Mean (complement) [Watt m-2] |
Benchmark Period Mean (intersection) [Watt m-2] |
Benchmark Period Mean (complement) [Watt m-2] |
Bias [Watt m-2] |
RMSE [Watt m-2] |
Phase Shift [months] |
Bias Score [1] |
RMSE Score [1] |
Seasonal Cycle Score [1] |
Spatial Distribution Score [1] |
Interannual Variability Score [1] |
Overall Score [1] |
|||
|---|---|---|---|---|---|---|---|---|---|---|---|---|---|---|---|---|---|
| Benchmark | [-] | 105. | |||||||||||||||
| CRUNCEPv7 | [-] | 108. | 108. | 104. | 127. | 4.10 | 20.9 | 0.174 | 0.902 | 0.758 | 0.988 | 0.985 | 0.607 | 0.833 | |||
| GSWP3v1 | [-] | 100. | 100. | 104. | 127. | -3.81 | 16.7 | 0.0856 | 0.929 | 0.798 | 0.994 | 0.998 | 0.644 | 0.860 | |||
| WATCH | [-] | 87.3 | 87.3 | 105. | 128. | -17.6 | 23.0 | 0.259 | 0.781 | 0.813 | 0.983 | 0.973 | 0.675 | 0.840 |
Download Data |
Period Mean (original grids) [Watt m-2] |
Model Period Mean (intersection) [Watt m-2] |
Model Period Mean (complement) [Watt m-2] |
Benchmark Period Mean (intersection) [Watt m-2] |
Benchmark Period Mean (complement) [Watt m-2] |
Bias [Watt m-2] |
RMSE [Watt m-2] |
Phase Shift [months] |
Bias Score [1] |
RMSE Score [1] |
Seasonal Cycle Score [1] |
Spatial Distribution Score [1] |
Interannual Variability Score [1] |
Overall Score [1] |
|||
|---|---|---|---|---|---|---|---|---|---|---|---|---|---|---|---|---|---|
| Benchmark | [-] | 140. | |||||||||||||||
| CRUNCEPv7 | [-] | 149. | 148. | 139. | 154. | 8.93 | 26.1 | 0.567 | 0.748 | 0.694 | 0.955 | 0.969 | 0.641 | 0.783 | |||
| GSWP3v1 | [-] | 136. | 135. | 139. | 154. | -3.72 | 16.9 | 0.242 | 0.891 | 0.744 | 0.980 | 0.998 | 0.623 | 0.830 | |||
| WATCH | [-] | 132. | 132. | 141. | 155. | -8.59 | 22.2 | 0.424 | 0.803 | 0.721 | 0.961 | 0.981 | 0.704 | 0.815 |
Download Data |
Period Mean (original grids) [Watt m-2] |
Model Period Mean (intersection) [Watt m-2] |
Model Period Mean (complement) [Watt m-2] |
Benchmark Period Mean (intersection) [Watt m-2] |
Benchmark Period Mean (complement) [Watt m-2] |
Bias [Watt m-2] |
RMSE [Watt m-2] |
Phase Shift [months] |
Bias Score [1] |
RMSE Score [1] |
Seasonal Cycle Score [1] |
Spatial Distribution Score [1] |
Interannual Variability Score [1] |
Overall Score [1] |
|||
|---|---|---|---|---|---|---|---|---|---|---|---|---|---|---|---|---|---|
| Benchmark | [-] | 180. | |||||||||||||||
| CRUNCEPv7 | [-] | 194. | 194. | 178. | 210. | 15.4 | 31.1 | 0.410 | 0.539 | 0.540 | 0.971 | 0.961 | 0.534 | 0.681 | |||
| GSWP3v1 | [-] | 175. | 175. | 178. | 210. | -1.80 | 18.7 | 0.253 | 0.806 | 0.620 | 0.983 | 0.920 | 0.634 | 0.764 | |||
| WATCH | [-] | 159. | 159. | 179. | 210. | -18.7 | 30.2 | 0.434 | 0.577 | 0.566 | 0.968 | 0.950 | 0.662 | 0.715 |
Download Data |
Period Mean (original grids) [Watt m-2] |
Model Period Mean (intersection) [Watt m-2] |
Model Period Mean (complement) [Watt m-2] |
Benchmark Period Mean (intersection) [Watt m-2] |
Benchmark Period Mean (complement) [Watt m-2] |
Bias [Watt m-2] |
RMSE [Watt m-2] |
Phase Shift [months] |
Bias Score [1] |
RMSE Score [1] |
Seasonal Cycle Score [1] |
Spatial Distribution Score [1] |
Interannual Variability Score [1] |
Overall Score [1] |
|||
|---|---|---|---|---|---|---|---|---|---|---|---|---|---|---|---|---|---|
| Benchmark | [-] | 74.6 | |||||||||||||||
| CRUNCEPv7 | [-] | 68.2 | 68.6 | 74.6 | 74.8 | -7.24 | 21.8 | 0.337 | 0.870 | 0.717 | 0.978 | 0.843 | 0.618 | 0.791 | |||
| GSWP3v1 | [-] | 64.0 | 64.4 | 74.6 | 74.8 | -11.2 | 19.0 | 0.311 | 0.844 | 0.742 | 0.979 | 0.929 | 0.675 | 0.819 | |||
| WATCH | [-] | 51.9 | 52.2 | 75.0 | 75.5 | -23.3 | 25.8 | 0.363 | 0.703 | 0.741 | 0.976 | 0.981 | 0.673 | 0.802 |
Download Data |
Period Mean (original grids) [Watt m-2] |
Model Period Mean (intersection) [Watt m-2] |
Model Period Mean (complement) [Watt m-2] |
Benchmark Period Mean (intersection) [Watt m-2] |
Benchmark Period Mean (complement) [Watt m-2] |
Bias [Watt m-2] |
RMSE [Watt m-2] |
Phase Shift [months] |
Bias Score [1] |
RMSE Score [1] |
Seasonal Cycle Score [1] |
Spatial Distribution Score [1] |
Interannual Variability Score [1] |
Overall Score [1] |
|||
|---|---|---|---|---|---|---|---|---|---|---|---|---|---|---|---|---|---|
| Benchmark | [-] | 193. | |||||||||||||||
| CRUNCEPv7 | [-] | 194. | 194. | 193. | 202. | -0.170 | 20.8 | 0.537 | 0.822 | 0.677 | 0.962 | 0.954 | 0.590 | 0.780 | |||
| GSWP3v1 | [-] | 192. | 192. | 193. | 202. | -1.99 | 18.1 | 0.222 | 0.852 | 0.704 | 0.983 | 0.999 | 0.615 | 0.809 | |||
| WATCH | [-] | 197. | 197. | 194. | 202. | 0.952 | 20.2 | 0.346 | 0.808 | 0.703 | 0.969 | 0.998 | 0.757 | 0.823 |
Download Data |
Period Mean (original grids) [Watt m-2] |
Model Period Mean (intersection) [Watt m-2] |
Model Period Mean (complement) [Watt m-2] |
Benchmark Period Mean (intersection) [Watt m-2] |
Benchmark Period Mean (complement) [Watt m-2] |
Bias [Watt m-2] |
RMSE [Watt m-2] |
Phase Shift [months] |
Bias Score [1] |
RMSE Score [1] |
Seasonal Cycle Score [1] |
Spatial Distribution Score [1] |
Interannual Variability Score [1] |
Overall Score [1] |
|||
|---|---|---|---|---|---|---|---|---|---|---|---|---|---|---|---|---|---|
| Benchmark | [-] | 120. | |||||||||||||||
| CRUNCEPv7 | [-] | 131. | 131. | 117. | 151. | 14.4 | 27.6 | 0.295 | 0.744 | 0.747 | 0.980 | 0.995 | 0.642 | 0.809 | |||
| GSWP3v1 | [-] | 113. | 113. | 117. | 151. | -1.95 | 16.4 | 0.358 | 0.908 | 0.800 | 0.975 | 0.998 | 0.623 | 0.851 | |||
| WATCH | [-] | 95.4 | 95.5 | 117. | 151. | -18.2 | 23.2 | 0.240 | 0.765 | 0.811 | 0.983 | 0.992 | 0.686 | 0.841 |
Download Data |
Period Mean (original grids) [Watt m-2] |
Model Period Mean (intersection) [Watt m-2] |
Model Period Mean (complement) [Watt m-2] |
Benchmark Period Mean (intersection) [Watt m-2] |
Benchmark Period Mean (complement) [Watt m-2] |
Bias [Watt m-2] |
RMSE [Watt m-2] |
Phase Shift [months] |
Bias Score [1] |
RMSE Score [1] |
Seasonal Cycle Score [1] |
Spatial Distribution Score [1] |
Interannual Variability Score [1] |
Overall Score [1] |
|||
|---|---|---|---|---|---|---|---|---|---|---|---|---|---|---|---|---|---|
| Benchmark | [-] | 168. | |||||||||||||||
| CRUNCEPv7 | [-] | 143. | 143. | 143. | 180. | -0.0159 | 23.9 | 0.610 | 0.714 | 0.632 | 0.932 | 0.956 | 0.554 | 0.736 | |||
| GSWP3v1 | [-] | 137. | 137. | 143. | 180. | -5.85 | 18.9 | 0.278 | 0.788 | 0.672 | 0.972 | 0.967 | 0.624 | 0.783 | |||
| WATCH | [-] | 126. | 126. | 144. | 180. | -17.4 | 26.5 | 0.473 | 0.642 | 0.654 | 0.949 | 0.978 | 0.663 | 0.757 |
Download Data |
Period Mean (original grids) [Watt m-2] |
Model Period Mean (intersection) [Watt m-2] |
Model Period Mean (complement) [Watt m-2] |
Benchmark Period Mean (intersection) [Watt m-2] |
Benchmark Period Mean (complement) [Watt m-2] |
Bias [Watt m-2] |
RMSE [Watt m-2] |
Phase Shift [months] |
Bias Score [1] |
RMSE Score [1] |
Seasonal Cycle Score [1] |
Spatial Distribution Score [1] |
Interannual Variability Score [1] |
Overall Score [1] |
|||
|---|---|---|---|---|---|---|---|---|---|---|---|---|---|---|---|---|---|
| Benchmark | [-] | 175. | |||||||||||||||
| CRUNCEPv7 | [-] | 168. | 168. | 173. | 224. | -4.48 | 21.6 | 0.402 | 0.705 | 0.696 | 0.965 | 0.996 | 0.590 | 0.775 | |||
| GSWP3v1 | [-] | 162. | 162. | 173. | 224. | -10.2 | 19.7 | 0.305 | 0.716 | 0.728 | 0.974 | 0.988 | 0.578 | 0.785 | |||
| WATCH | [-] | 147. | 147. | 174. | 225. | -25.4 | 30.3 | 0.397 | 0.547 | 0.713 | 0.967 | 0.996 | 0.551 | 0.748 |
Download Data |
Period Mean (original grids) [Watt m-2] |
Model Period Mean (intersection) [Watt m-2] |
Model Period Mean (complement) [Watt m-2] |
Benchmark Period Mean (intersection) [Watt m-2] |
Benchmark Period Mean (complement) [Watt m-2] |
Bias [Watt m-2] |
RMSE [Watt m-2] |
Phase Shift [months] |
Bias Score [1] |
RMSE Score [1] |
Seasonal Cycle Score [1] |
Spatial Distribution Score [1] |
Interannual Variability Score [1] |
Overall Score [1] |
|||
|---|---|---|---|---|---|---|---|---|---|---|---|---|---|---|---|---|---|
| Benchmark | [-] | 80.0 | |||||||||||||||
| CRUNCEPv7 | [-] | 75.4 | 75.2 | 79.8 | 82.9 | -6.91 | 22.0 | 0.127 | 0.855 | 0.732 | 0.992 | 0.792 | 0.624 | 0.788 | |||
| GSWP3v1 | [-] | 70.5 | 70.4 | 79.8 | 82.9 | -10.9 | 19.6 | 0.0911 | 0.839 | 0.762 | 0.994 | 0.890 | 0.724 | 0.829 | |||
| WATCH | [-] | 66.1 | 65.9 | 80.2 | 83.5 | -15.2 | 22.2 | 0.132 | 0.796 | 0.760 | 0.991 | 0.940 | 0.750 | 0.833 |
Download Data |
Period Mean (original grids) [Watt m-2] |
Model Period Mean (intersection) [Watt m-2] |
Model Period Mean (complement) [Watt m-2] |
Benchmark Period Mean (intersection) [Watt m-2] |
Benchmark Period Mean (complement) [Watt m-2] |
Bias [Watt m-2] |
RMSE [Watt m-2] |
Phase Shift [months] |
Bias Score [1] |
RMSE Score [1] |
Seasonal Cycle Score [1] |
Spatial Distribution Score [1] |
Interannual Variability Score [1] |
Overall Score [1] |
|||
|---|---|---|---|---|---|---|---|---|---|---|---|---|---|---|---|---|---|
| Benchmark | [-] | 205. | |||||||||||||||
| CRUNCEPv7 | [-] | 189. | 189. | 200. | 227. | -9.36 | 28.6 | 0.810 | 0.611 | 0.588 | 0.919 | 0.631 | 0.527 | 0.644 | |||
| GSWP3v1 | [-] | 192. | 192. | 200. | 227. | -6.23 | 20.2 | 0.250 | 0.768 | 0.638 | 0.975 | 0.895 | 0.627 | 0.757 | |||
| WATCH | [-] | 181. | 181. | 199. | 226. | -16.8 | 30.5 | 0.463 | 0.568 | 0.610 | 0.954 | 0.960 | 0.683 | 0.731 |
Download Data |
Period Mean (original grids) [Watt m-2] |
Model Period Mean (intersection) [Watt m-2] |
Model Period Mean (complement) [Watt m-2] |
Benchmark Period Mean (intersection) [Watt m-2] |
Benchmark Period Mean (complement) [Watt m-2] |
Bias [Watt m-2] |
RMSE [Watt m-2] |
Phase Shift [months] |
Bias Score [1] |
RMSE Score [1] |
Seasonal Cycle Score [1] |
Spatial Distribution Score [1] |
Interannual Variability Score [1] |
Overall Score [1] |
|||
|---|---|---|---|---|---|---|---|---|---|---|---|---|---|---|---|---|---|
| Benchmark | [-] | 153. | |||||||||||||||
| CRUNCEPv7 | [-] | 156. | 156. | 151. | 194. | 6.08 | 19.4 | 0.518 | 0.854 | 0.744 | 0.966 | 0.999 | 0.546 | 0.809 | |||
| GSWP3v1 | [-] | 144. | 144. | 151. | 194. | -5.31 | 16.1 | 0.154 | 0.907 | 0.770 | 0.990 | 1.00 | 0.618 | 0.842 | |||
| WATCH | [-] | 146. | 145. | 149. | 193. | -2.75 | 16.5 | 0.353 | 0.912 | 0.766 | 0.976 | 0.998 | 0.751 | 0.861 |
Download Data |
Period Mean (original grids) [Watt m-2] |
Model Period Mean (intersection) [Watt m-2] |
Model Period Mean (complement) [Watt m-2] |
Benchmark Period Mean (intersection) [Watt m-2] |
Benchmark Period Mean (complement) [Watt m-2] |
Bias [Watt m-2] |
RMSE [Watt m-2] |
Phase Shift [months] |
Bias Score [1] |
RMSE Score [1] |
Seasonal Cycle Score [1] |
Spatial Distribution Score [1] |
Interannual Variability Score [1] |
Overall Score [1] |
|||
|---|---|---|---|---|---|---|---|---|---|---|---|---|---|---|---|---|---|
| Benchmark | [-] | 115. | |||||||||||||||
| CRUNCEPv7 | [-] | 123. | 123. | 114. | 123. | 8.13 | 20.1 | 0.223 | 0.869 | 0.784 | 0.985 | 0.975 | 0.573 | 0.828 | |||
| GSWP3v1 | [-] | 111. | 112. | 114. | 123. | -2.98 | 14.7 | 0.0893 | 0.924 | 0.826 | 0.994 | 0.999 | 0.636 | 0.867 | |||
| WATCH | [-] | 108. | 108. | 114. | 122. | -5.88 | 14.9 | 0.203 | 0.908 | 0.832 | 0.985 | 0.957 | 0.738 | 0.875 |
Download Data |
Period Mean (original grids) [Watt m-2] |
Model Period Mean (intersection) [Watt m-2] |
Model Period Mean (complement) [Watt m-2] |
Benchmark Period Mean (intersection) [Watt m-2] |
Benchmark Period Mean (complement) [Watt m-2] |
Bias [Watt m-2] |
RMSE [Watt m-2] |
Phase Shift [months] |
Bias Score [1] |
RMSE Score [1] |
Seasonal Cycle Score [1] |
Spatial Distribution Score [1] |
Interannual Variability Score [1] |
Overall Score [1] |
|||
|---|---|---|---|---|---|---|---|---|---|---|---|---|---|---|---|---|---|
| Benchmark | [-] | 162. | |||||||||||||||
| CRUNCEPv7 | [-] | 155. | 155. | 162. | 171. | -6.38 | 18.0 | 0.279 | 0.895 | 0.790 | 0.981 | 0.991 | 0.615 | 0.844 | |||
| GSWP3v1 | [-] | 159. | 159. | 162. | 171. | -2.78 | 15.1 | 0.159 | 0.930 | 0.810 | 0.989 | 1.00 | 0.648 | 0.865 | |||
| WATCH | [-] | 163. | 163. | 161. | 170. | 2.04 | 17.8 | 0.292 | 0.896 | 0.791 | 0.981 | 0.944 | 0.827 | 0.872 |
Download Data |
Period Mean (original grids) [Watt m-2] |
Model Period Mean (intersection) [Watt m-2] |
Model Period Mean (complement) [Watt m-2] |
Benchmark Period Mean (intersection) [Watt m-2] |
Benchmark Period Mean (complement) [Watt m-2] |
Bias [Watt m-2] |
RMSE [Watt m-2] |
Phase Shift [months] |
Bias Score [1] |
RMSE Score [1] |
Seasonal Cycle Score [1] |
Spatial Distribution Score [1] |
Interannual Variability Score [1] |
Overall Score [1] |
|||
|---|---|---|---|---|---|---|---|---|---|---|---|---|---|---|---|---|---|
| Benchmark | [-] | 176. | |||||||||||||||
| CRUNCEPv7 | [-] | 182. | 182. | 174. | 226. | 8.23 | 22.4 | 1.44 | 0.644 | 0.432 | 0.791 | 0.788 | 0.477 | 0.594 | |||
| GSWP3v1 | [-] | 174. | 174. | 174. | 226. | 0.173 | 17.1 | 0.479 | 0.828 | 0.468 | 0.940 | 0.943 | 0.645 | 0.715 | |||
| WATCH | [-] | 152. | 152. | 172. | 225. | -19.9 | 31.9 | 1.41 | 0.447 | 0.384 | 0.805 | 0.951 | 0.707 | 0.613 |
Download Data |
Period Mean (original grids) [Watt m-2] |
Model Period Mean (intersection) [Watt m-2] |
Model Period Mean (complement) [Watt m-2] |
Benchmark Period Mean (intersection) [Watt m-2] |
Benchmark Period Mean (complement) [Watt m-2] |
Bias [Watt m-2] |
RMSE [Watt m-2] |
Phase Shift [months] |
Bias Score [1] |
RMSE Score [1] |
Seasonal Cycle Score [1] |
Spatial Distribution Score [1] |
Interannual Variability Score [1] |
Overall Score [1] |
|||
|---|---|---|---|---|---|---|---|---|---|---|---|---|---|---|---|---|---|
| Benchmark | [-] | 182. | |||||||||||||||
| CRUNCEPv7 | [-] | 184. | 184. | 181. | 201. | 2.76 | 23.3 | 0.997 | 0.780 | 0.530 | 0.872 | 0.927 | 0.480 | 0.686 | |||
| GSWP3v1 | [-] | 180. | 181. | 181. | 201. | -0.876 | 19.1 | 0.319 | 0.886 | 0.572 | 0.959 | 0.999 | 0.614 | 0.767 | |||
| WATCH | [-] | 161. | 161. | 179. | 200. | -17.5 | 27.0 | 0.450 | 0.590 | 0.566 | 0.950 | 0.990 | 0.724 | 0.731 |
Download Data |
Period Mean (original grids) [Watt m-2] |
Model Period Mean (intersection) [Watt m-2] |
Model Period Mean (complement) [Watt m-2] |
Benchmark Period Mean (intersection) [Watt m-2] |
Benchmark Period Mean (complement) [Watt m-2] |
Bias [Watt m-2] |
RMSE [Watt m-2] |
Phase Shift [months] |
Bias Score [1] |
RMSE Score [1] |
Seasonal Cycle Score [1] |
Spatial Distribution Score [1] |
Interannual Variability Score [1] |
Overall Score [1] |
|||
|---|---|---|---|---|---|---|---|---|---|---|---|---|---|---|---|---|---|
| Benchmark | [-] | 176. | |||||||||||||||
| CRUNCEPv7 | [-] | 176. | 175. | 176. | 178. | -2.14 | 28.3 | 0.529 | 0.714 | 0.664 | 0.949 | 0.810 | 0.511 | 0.719 | |||
| GSWP3v1 | [-] | 176. | 175. | 176. | 178. | -3.76 | 20.8 | 0.301 | 0.842 | 0.697 | 0.970 | 0.999 | 0.603 | 0.801 | |||
| WATCH | [-] | 174. | 174. | 175. | 178. | -4.35 | 27.1 | 0.606 | 0.739 | 0.671 | 0.935 | 0.994 | 0.591 | 0.767 |
Temporally integrated period mean