Mean State
Download Data |
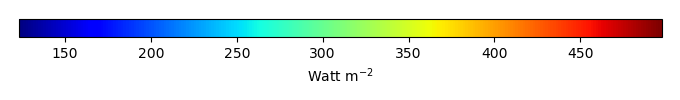
Period Mean (original grids) [Watt m-2] |
Model Period Mean (intersection) [Watt m-2] |
Model Period Mean (complement) [Watt m-2] |
Benchmark Period Mean (intersection) [Watt m-2] |
Benchmark Period Mean (complement) [Watt m-2] |
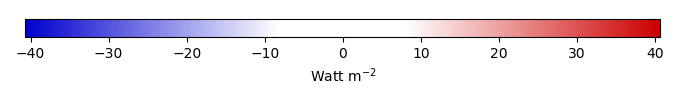
Bias [Watt m-2] |
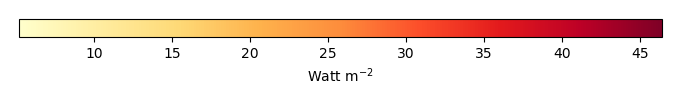
RMSE [Watt m-2] |
Phase Shift [months] |
Bias Score [1] |
RMSE Score [1] |
Seasonal Cycle Score [1] |
Spatial Distribution Score [1] |
Interannual Variability Score [1] |
Overall Score [1] |
|||
|---|---|---|---|---|---|---|---|---|---|---|---|---|---|---|---|---|---|
| Benchmark | [-] | 453. | |||||||||||||||
| CRUNCEPv7 | [-] | 462. | 462. | 453. | 460. | 10.0 | 15.8 | 1.71 | 0.365 | 0.384 | 0.751 | 0.986 | 0.724 | 0.599 | |||
| GSWP3v1 | [-] | 462. | 462. | 453. | 460. | 9.34 | 15.7 | 1.72 | 0.344 | 0.372 | 0.753 | 0.988 | 0.715 | 0.591 | |||
| WATCH | [-] | 456. | 456. | 452. | 460. | 5.05 | 14.3 | 2.00 | 0.434 | 0.345 | 0.704 | 0.994 | 0.743 | 0.594 |
Download Data |
Period Mean (original grids) [Watt m-2] |
Model Period Mean (intersection) [Watt m-2] |
Model Period Mean (complement) [Watt m-2] |
Benchmark Period Mean (intersection) [Watt m-2] |
Benchmark Period Mean (complement) [Watt m-2] |
Bias [Watt m-2] |
RMSE [Watt m-2] |
Phase Shift [months] |
Bias Score [1] |
RMSE Score [1] |
Seasonal Cycle Score [1] |
Spatial Distribution Score [1] |
Interannual Variability Score [1] |
Overall Score [1] |
|||
|---|---|---|---|---|---|---|---|---|---|---|---|---|---|---|---|---|---|
| Benchmark | [-] | 471. | |||||||||||||||
| CRUNCEPv7 | [-] | 485. | 485. | 471. | 456. | 13.4 | 23.9 | 0.875 | 0.498 | 0.469 | 0.929 | 1.00 | 0.760 | 0.688 | |||
| GSWP3v1 | [-] | 481. | 482. | 471. | 456. | 10.1 | 20.9 | 0.713 | 0.562 | 0.498 | 0.945 | 0.949 | 0.707 | 0.693 | |||
| WATCH | [-] | 466. | 466. | 470. | 455. | -3.27 | 21.8 | 1.07 | 0.649 | 0.412 | 0.903 | 0.999 | 0.763 | 0.690 |
Download Data |
Period Mean (original grids) [Watt m-2] |
Model Period Mean (intersection) [Watt m-2] |
Model Period Mean (complement) [Watt m-2] |
Benchmark Period Mean (intersection) [Watt m-2] |
Benchmark Period Mean (complement) [Watt m-2] |
Bias [Watt m-2] |
RMSE [Watt m-2] |
Phase Shift [months] |
Bias Score [1] |
RMSE Score [1] |
Seasonal Cycle Score [1] |
Spatial Distribution Score [1] |
Interannual Variability Score [1] |
Overall Score [1] |
|||
|---|---|---|---|---|---|---|---|---|---|---|---|---|---|---|---|---|---|
| Benchmark | [-] | 443. | |||||||||||||||
| CRUNCEPv7 | [-] | 450. | 449. | 443. | 444. | 6.37 | 18.0 | 0.975 | 0.562 | 0.507 | 0.890 | 0.962 | 0.638 | 0.678 | |||
| GSWP3v1 | [-] | 451. | 451. | 443. | 444. | 7.63 | 17.9 | 1.14 | 0.566 | 0.494 | 0.853 | 0.988 | 0.608 | 0.667 | |||
| WATCH | [-] | 443. | 443. | 441. | 444. | 2.24 | 16.3 | 1.33 | 0.609 | 0.488 | 0.830 | 0.974 | 0.719 | 0.685 |
Download Data |
Period Mean (original grids) [Watt m-2] |
Model Period Mean (intersection) [Watt m-2] |
Model Period Mean (complement) [Watt m-2] |
Benchmark Period Mean (intersection) [Watt m-2] |
Benchmark Period Mean (complement) [Watt m-2] |
Bias [Watt m-2] |
RMSE [Watt m-2] |
Phase Shift [months] |
Bias Score [1] |
RMSE Score [1] |
Seasonal Cycle Score [1] |
Spatial Distribution Score [1] |
Interannual Variability Score [1] |
Overall Score [1] |
|||
|---|---|---|---|---|---|---|---|---|---|---|---|---|---|---|---|---|---|
| Benchmark | [-] | 276. | |||||||||||||||
| CRUNCEPv7 | [-] | 265. | 265. | 275. | 292. | -7.59 | 19.0 | 0.0691 | 0.865 | 0.775 | 0.995 | 0.971 | 0.766 | 0.858 | |||
| GSWP3v1 | [-] | 275. | 275. | 275. | 292. | 3.64 | 16.0 | 0.0557 | 0.901 | 0.799 | 0.996 | 0.989 | 0.793 | 0.880 | |||
| WATCH | [-] | 266. | 267. | 274. | 291. | -5.33 | 19.5 | 0.0661 | 0.886 | 0.758 | 0.996 | 0.975 | 0.847 | 0.870 |
Download Data |
Period Mean (original grids) [Watt m-2] |
Model Period Mean (intersection) [Watt m-2] |
Model Period Mean (complement) [Watt m-2] |
Benchmark Period Mean (intersection) [Watt m-2] |
Benchmark Period Mean (complement) [Watt m-2] |
Bias [Watt m-2] |
RMSE [Watt m-2] |
Phase Shift [months] |
Bias Score [1] |
RMSE Score [1] |
Seasonal Cycle Score [1] |
Spatial Distribution Score [1] |
Interannual Variability Score [1] |
Overall Score [1] |
|||
|---|---|---|---|---|---|---|---|---|---|---|---|---|---|---|---|---|---|
| Benchmark | [-] | 456. | |||||||||||||||
| CRUNCEPv7 | [-] | 456. | 456. | 453. | 465. | 4.81 | 10.5 | 2.03 | 0.307 | 0.384 | 0.682 | 0.986 | 0.671 | 0.569 | |||
| GSWP3v1 | [-] | 458. | 458. | 453. | 465. | 5.84 | 10.1 | 1.76 | 0.314 | 0.411 | 0.732 | 0.934 | 0.717 | 0.587 | |||
| WATCH | [-] | 456. | 456. | 453. | 464. | 4.59 | 10.9 | 2.10 | 0.292 | 0.357 | 0.675 | 0.984 | 0.771 | 0.573 |
Download Data |
Period Mean (original grids) [Watt m-2] |
Model Period Mean (intersection) [Watt m-2] |
Model Period Mean (complement) [Watt m-2] |
Benchmark Period Mean (intersection) [Watt m-2] |
Benchmark Period Mean (complement) [Watt m-2] |
Bias [Watt m-2] |
RMSE [Watt m-2] |
Phase Shift [months] |
Bias Score [1] |
RMSE Score [1] |
Seasonal Cycle Score [1] |
Spatial Distribution Score [1] |
Interannual Variability Score [1] |
Overall Score [1] |
|||
|---|---|---|---|---|---|---|---|---|---|---|---|---|---|---|---|---|---|
| Benchmark | [-] | 306. | |||||||||||||||
| CRUNCEPv7 | [-] | 309. | 309. | 306. | 329. | 3.73 | 11.7 | 0.0258 | 0.920 | 0.867 | 0.998 | 0.976 | 0.890 | 0.920 | |||
| GSWP3v1 | [-] | 316. | 315. | 306. | 329. | 10.1 | 14.8 | 0.0215 | 0.860 | 0.862 | 0.999 | 0.997 | 0.891 | 0.912 | |||
| WATCH | [-] | 309. | 309. | 305. | 329. | 4.00 | 12.8 | 0.0322 | 0.912 | 0.854 | 0.998 | 0.972 | 0.901 | 0.915 |
Download Data |
Period Mean (original grids) [Watt m-2] |
Model Period Mean (intersection) [Watt m-2] |
Model Period Mean (complement) [Watt m-2] |
Benchmark Period Mean (intersection) [Watt m-2] |
Benchmark Period Mean (complement) [Watt m-2] |
Bias [Watt m-2] |
RMSE [Watt m-2] |
Phase Shift [months] |
Bias Score [1] |
RMSE Score [1] |
Seasonal Cycle Score [1] |
Spatial Distribution Score [1] |
Interannual Variability Score [1] |
Overall Score [1] |
|||
|---|---|---|---|---|---|---|---|---|---|---|---|---|---|---|---|---|---|
| Benchmark | [-] | 362. | |||||||||||||||
| CRUNCEPv7 | [-] | 361. | 360. | 361. | 395. | 1.74 | 14.5 | 0.198 | 0.866 | 0.826 | 0.986 | 1.00 | 0.754 | 0.876 | |||
| GSWP3v1 | [-] | 364. | 363. | 361. | 395. | 4.75 | 15.4 | 0.151 | 0.860 | 0.817 | 0.990 | 0.991 | 0.730 | 0.867 | |||
| WATCH | [-] | 356. | 356. | 359. | 395. | -1.00 | 16.0 | 0.148 | 0.862 | 0.807 | 0.989 | 1.00 | 0.812 | 0.879 |
Download Data |
Period Mean (original grids) [Watt m-2] |
Model Period Mean (intersection) [Watt m-2] |
Model Period Mean (complement) [Watt m-2] |
Benchmark Period Mean (intersection) [Watt m-2] |
Benchmark Period Mean (complement) [Watt m-2] |
Bias [Watt m-2] |
RMSE [Watt m-2] |
Phase Shift [months] |
Bias Score [1] |
RMSE Score [1] |
Seasonal Cycle Score [1] |
Spatial Distribution Score [1] |
Interannual Variability Score [1] |
Overall Score [1] |
|||
|---|---|---|---|---|---|---|---|---|---|---|---|---|---|---|---|---|---|
| Benchmark | [-] | 450. | |||||||||||||||
| CRUNCEPv7 | [-] | 457. | 458. | 450. | 463. | 10.2 | 20.0 | 0.673 | 0.556 | 0.567 | 0.935 | 0.987 | 0.654 | 0.711 | |||
| GSWP3v1 | [-] | 452. | 452. | 450. | 463. | 4.66 | 17.7 | 0.767 | 0.653 | 0.557 | 0.922 | 1.00 | 0.627 | 0.719 | |||
| WATCH | [-] | 449. | 450. | 448. | 463. | 3.43 | 19.5 | 0.794 | 0.643 | 0.521 | 0.923 | 1.00 | 0.657 | 0.711 |
Download Data |
Period Mean (original grids) [Watt m-2] |
Model Period Mean (intersection) [Watt m-2] |
Model Period Mean (complement) [Watt m-2] |
Benchmark Period Mean (intersection) [Watt m-2] |
Benchmark Period Mean (complement) [Watt m-2] |
Bias [Watt m-2] |
RMSE [Watt m-2] |
Phase Shift [months] |
Bias Score [1] |
RMSE Score [1] |
Seasonal Cycle Score [1] |
Spatial Distribution Score [1] |
Interannual Variability Score [1] |
Overall Score [1] |
|||
|---|---|---|---|---|---|---|---|---|---|---|---|---|---|---|---|---|---|
| Benchmark | [-] | 275. | |||||||||||||||
| CRUNCEPv7 | [-] | 273. | 273. | 275. | 280. | -1.59 | 15.1 | 0.0657 | 0.922 | 0.792 | 0.995 | 0.979 | 0.853 | 0.889 | |||
| GSWP3v1 | [-] | 282. | 282. | 275. | 280. | 7.91 | 15.3 | 0.0355 | 0.875 | 0.817 | 0.997 | 0.996 | 0.851 | 0.892 | |||
| WATCH | [-] | 275. | 276. | 274. | 280. | 1.50 | 15.6 | 0.0482 | 0.926 | 0.787 | 0.996 | 0.988 | 0.897 | 0.897 |
Download Data |
Period Mean (original grids) [Watt m-2] |
Model Period Mean (intersection) [Watt m-2] |
Model Period Mean (complement) [Watt m-2] |
Benchmark Period Mean (intersection) [Watt m-2] |
Benchmark Period Mean (complement) [Watt m-2] |
Bias [Watt m-2] |
RMSE [Watt m-2] |
Phase Shift [months] |
Bias Score [1] |
RMSE Score [1] |
Seasonal Cycle Score [1] |
Spatial Distribution Score [1] |
Interannual Variability Score [1] |
Overall Score [1] |
|||
|---|---|---|---|---|---|---|---|---|---|---|---|---|---|---|---|---|---|
| Benchmark | [-] | 448. | |||||||||||||||
| CRUNCEPv7 | [-] | 450. | 450. | 450. | 423. | -2.94 | 14.0 | 0.347 | 0.785 | 0.714 | 0.972 | 0.999 | 0.739 | 0.821 | |||
| GSWP3v1 | [-] | 449. | 450. | 450. | 423. | -3.08 | 14.6 | 0.337 | 0.785 | 0.707 | 0.974 | 0.994 | 0.702 | 0.812 | |||
| WATCH | [-] | 445. | 446. | 448. | 422. | -5.01 | 16.1 | 0.356 | 0.759 | 0.684 | 0.972 | 0.997 | 0.712 | 0.801 |
Download Data |
Period Mean (original grids) [Watt m-2] |
Model Period Mean (intersection) [Watt m-2] |
Model Period Mean (complement) [Watt m-2] |
Benchmark Period Mean (intersection) [Watt m-2] |
Benchmark Period Mean (complement) [Watt m-2] |
Bias [Watt m-2] |
RMSE [Watt m-2] |
Phase Shift [months] |
Bias Score [1] |
RMSE Score [1] |
Seasonal Cycle Score [1] |
Spatial Distribution Score [1] |
Interannual Variability Score [1] |
Overall Score [1] |
|||
|---|---|---|---|---|---|---|---|---|---|---|---|---|---|---|---|---|---|
| Benchmark | [-] | 364. | |||||||||||||||
| CRUNCEPv7 | [-] | 361. | 361. | 362. | 385. | 1.58 | 10.8 | 0.513 | 0.858 | 0.809 | 0.965 | 1.00 | 0.828 | 0.878 | |||
| GSWP3v1 | [-] | 363. | 363. | 362. | 385. | 3.66 | 10.8 | 0.476 | 0.859 | 0.809 | 0.968 | 0.993 | 0.830 | 0.878 | |||
| WATCH | [-] | 357. | 357. | 361. | 384. | -0.690 | 12.4 | 0.403 | 0.839 | 0.788 | 0.973 | 0.990 | 0.845 | 0.870 |
Download Data |
Period Mean (original grids) [Watt m-2] |
Model Period Mean (intersection) [Watt m-2] |
Model Period Mean (complement) [Watt m-2] |
Benchmark Period Mean (intersection) [Watt m-2] |
Benchmark Period Mean (complement) [Watt m-2] |
Bias [Watt m-2] |
RMSE [Watt m-2] |
Phase Shift [months] |
Bias Score [1] |
RMSE Score [1] |
Seasonal Cycle Score [1] |
Spatial Distribution Score [1] |
Interannual Variability Score [1] |
Overall Score [1] |
|||
|---|---|---|---|---|---|---|---|---|---|---|---|---|---|---|---|---|---|
| Benchmark | [-] | 397. | |||||||||||||||
| CRUNCEPv7 | [-] | 377. | 377. | 376. | 406. | 1.88 | 16.1 | 0.535 | 0.713 | 0.669 | 0.943 | 0.999 | 0.704 | 0.783 | |||
| GSWP3v1 | [-] | 380. | 380. | 376. | 406. | 4.60 | 16.3 | 0.517 | 0.699 | 0.685 | 0.943 | 0.998 | 0.739 | 0.792 | |||
| WATCH | [-] | 373. | 373. | 375. | 406. | -0.348 | 17.4 | 0.599 | 0.707 | 0.661 | 0.931 | 0.997 | 0.780 | 0.789 |
Download Data |
Period Mean (original grids) [Watt m-2] |
Model Period Mean (intersection) [Watt m-2] |
Model Period Mean (complement) [Watt m-2] |
Benchmark Period Mean (intersection) [Watt m-2] |
Benchmark Period Mean (complement) [Watt m-2] |
Bias [Watt m-2] |
RMSE [Watt m-2] |
Phase Shift [months] |
Bias Score [1] |
RMSE Score [1] |
Seasonal Cycle Score [1] |
Spatial Distribution Score [1] |
Interannual Variability Score [1] |
Overall Score [1] |
|||
|---|---|---|---|---|---|---|---|---|---|---|---|---|---|---|---|---|---|
| Benchmark | [-] | 464. | |||||||||||||||
| CRUNCEPv7 | [-] | 454. | 454. | 465. | 441. | -11.1 | 21.4 | 0.446 | 0.748 | 0.740 | 0.965 | 0.995 | 0.649 | 0.806 | |||
| GSWP3v1 | [-] | 450. | 449. | 465. | 441. | -15.4 | 24.1 | 0.443 | 0.709 | 0.731 | 0.965 | 0.973 | 0.645 | 0.792 | |||
| WATCH | [-] | 437. | 436. | 462. | 441. | -25.2 | 32.1 | 0.507 | 0.595 | 0.717 | 0.958 | 0.964 | 0.674 | 0.771 |
Download Data |
Period Mean (original grids) [Watt m-2] |
Model Period Mean (intersection) [Watt m-2] |
Model Period Mean (complement) [Watt m-2] |
Benchmark Period Mean (intersection) [Watt m-2] |
Benchmark Period Mean (complement) [Watt m-2] |
Bias [Watt m-2] |
RMSE [Watt m-2] |
Phase Shift [months] |
Bias Score [1] |
RMSE Score [1] |
Seasonal Cycle Score [1] |
Spatial Distribution Score [1] |
Interannual Variability Score [1] |
Overall Score [1] |
|||
|---|---|---|---|---|---|---|---|---|---|---|---|---|---|---|---|---|---|
| Benchmark | [-] | 278. | |||||||||||||||
| CRUNCEPv7 | [-] | 277. | 276. | 277. | 289. | -1.61 | 14.2 | 0.0692 | 0.897 | 0.807 | 0.995 | 0.966 | 0.779 | 0.875 | |||
| GSWP3v1 | [-] | 285. | 285. | 277. | 289. | 8.39 | 14.5 | 0.0541 | 0.857 | 0.830 | 0.996 | 0.995 | 0.817 | 0.887 | |||
| WATCH | [-] | 280. | 280. | 277. | 288. | 2.87 | 14.3 | 0.0516 | 0.902 | 0.803 | 0.997 | 0.982 | 0.882 | 0.895 |
Download Data |
Period Mean (original grids) [Watt m-2] |
Model Period Mean (intersection) [Watt m-2] |
Model Period Mean (complement) [Watt m-2] |
Benchmark Period Mean (intersection) [Watt m-2] |
Benchmark Period Mean (complement) [Watt m-2] |
Bias [Watt m-2] |
RMSE [Watt m-2] |
Phase Shift [months] |
Bias Score [1] |
RMSE Score [1] |
Seasonal Cycle Score [1] |
Spatial Distribution Score [1] |
Interannual Variability Score [1] |
Overall Score [1] |
|||
|---|---|---|---|---|---|---|---|---|---|---|---|---|---|---|---|---|---|
| Benchmark | [-] | 444. | |||||||||||||||
| CRUNCEPv7 | [-] | 445. | 445. | 442. | 455. | 6.86 | 15.5 | 0.625 | 0.530 | 0.578 | 0.938 | 0.931 | 0.735 | 0.715 | |||
| GSWP3v1 | [-] | 446. | 446. | 442. | 455. | 7.88 | 14.4 | 0.674 | 0.552 | 0.584 | 0.934 | 0.989 | 0.719 | 0.727 | |||
| WATCH | [-] | 445. | 445. | 441. | 455. | 6.99 | 16.2 | 0.839 | 0.548 | 0.530 | 0.913 | 0.972 | 0.757 | 0.708 |
Download Data |
Period Mean (original grids) [Watt m-2] |
Model Period Mean (intersection) [Watt m-2] |
Model Period Mean (complement) [Watt m-2] |
Benchmark Period Mean (intersection) [Watt m-2] |
Benchmark Period Mean (complement) [Watt m-2] |
Bias [Watt m-2] |
RMSE [Watt m-2] |
Phase Shift [months] |
Bias Score [1] |
RMSE Score [1] |
Seasonal Cycle Score [1] |
Spatial Distribution Score [1] |
Interannual Variability Score [1] |
Overall Score [1] |
|||
|---|---|---|---|---|---|---|---|---|---|---|---|---|---|---|---|---|---|
| Benchmark | [-] | 386. | |||||||||||||||
| CRUNCEPv7 | [-] | 387. | 387. | 384. | 429. | 5.60 | 10.2 | 0.275 | 0.867 | 0.850 | 0.981 | 0.999 | 0.892 | 0.907 | |||
| GSWP3v1 | [-] | 390. | 390. | 384. | 429. | 8.58 | 11.9 | 0.176 | 0.825 | 0.859 | 0.988 | 1.00 | 0.865 | 0.899 | |||
| WATCH | [-] | 383. | 383. | 383. | 429. | 1.98 | 9.68 | 0.148 | 0.897 | 0.838 | 0.990 | 1.00 | 0.904 | 0.911 |
Download Data |
Period Mean (original grids) [Watt m-2] |
Model Period Mean (intersection) [Watt m-2] |
Model Period Mean (complement) [Watt m-2] |
Benchmark Period Mean (intersection) [Watt m-2] |
Benchmark Period Mean (complement) [Watt m-2] |
Bias [Watt m-2] |
RMSE [Watt m-2] |
Phase Shift [months] |
Bias Score [1] |
RMSE Score [1] |
Seasonal Cycle Score [1] |
Spatial Distribution Score [1] |
Interannual Variability Score [1] |
Overall Score [1] |
|||
|---|---|---|---|---|---|---|---|---|---|---|---|---|---|---|---|---|---|
| Benchmark | [-] | 319. | |||||||||||||||
| CRUNCEPv7 | [-] | 322. | 322. | 318. | 343. | 4.63 | 11.7 | 0.170 | 0.894 | 0.841 | 0.989 | 0.999 | 0.841 | 0.901 | |||
| GSWP3v1 | [-] | 327. | 327. | 318. | 343. | 10.1 | 14.6 | 0.138 | 0.832 | 0.838 | 0.991 | 0.990 | 0.839 | 0.888 | |||
| WATCH | [-] | 322. | 322. | 318. | 342. | 5.68 | 12.7 | 0.171 | 0.881 | 0.831 | 0.988 | 0.997 | 0.893 | 0.904 |
Download Data |
Period Mean (original grids) [Watt m-2] |
Model Period Mean (intersection) [Watt m-2] |
Model Period Mean (complement) [Watt m-2] |
Benchmark Period Mean (intersection) [Watt m-2] |
Benchmark Period Mean (complement) [Watt m-2] |
Bias [Watt m-2] |
RMSE [Watt m-2] |
Phase Shift [months] |
Bias Score [1] |
RMSE Score [1] |
Seasonal Cycle Score [1] |
Spatial Distribution Score [1] |
Interannual Variability Score [1] |
Overall Score [1] |
|||
|---|---|---|---|---|---|---|---|---|---|---|---|---|---|---|---|---|---|
| Benchmark | [-] | 376. | |||||||||||||||
| CRUNCEPv7 | [-] | 377. | 378. | 376. | 379. | 2.07 | 14.8 | 0.131 | 0.862 | 0.814 | 0.991 | 0.999 | 0.770 | 0.875 | |||
| GSWP3v1 | [-] | 380. | 381. | 376. | 379. | 5.26 | 16.3 | 0.108 | 0.854 | 0.798 | 0.993 | 0.979 | 0.711 | 0.856 | |||
| WATCH | [-] | 375. | 376. | 374. | 379. | 2.16 | 16.9 | 0.183 | 0.854 | 0.786 | 0.988 | 0.996 | 0.789 | 0.866 |
Download Data |
Period Mean (original grids) [Watt m-2] |
Model Period Mean (intersection) [Watt m-2] |
Model Period Mean (complement) [Watt m-2] |
Benchmark Period Mean (intersection) [Watt m-2] |
Benchmark Period Mean (complement) [Watt m-2] |
Bias [Watt m-2] |
RMSE [Watt m-2] |
Phase Shift [months] |
Bias Score [1] |
RMSE Score [1] |
Seasonal Cycle Score [1] |
Spatial Distribution Score [1] |
Interannual Variability Score [1] |
Overall Score [1] |
|||
|---|---|---|---|---|---|---|---|---|---|---|---|---|---|---|---|---|---|
| Benchmark | [-] | 449. | |||||||||||||||
| CRUNCEPv7 | [-] | 455. | 455. | 449. | 458. | 6.39 | 13.2 | 1.15 | 0.442 | 0.404 | 0.834 | 0.863 | 0.685 | 0.605 | |||
| GSWP3v1 | [-] | 457. | 457. | 449. | 458. | 7.86 | 13.4 | 1.25 | 0.424 | 0.399 | 0.822 | 0.935 | 0.629 | 0.601 | |||
| WATCH | [-] | 453. | 453. | 449. | 458. | 3.99 | 13.6 | 1.83 | 0.504 | 0.367 | 0.729 | 0.923 | 0.689 | 0.597 |
Download Data |
Period Mean (original grids) [Watt m-2] |
Model Period Mean (intersection) [Watt m-2] |
Model Period Mean (complement) [Watt m-2] |
Benchmark Period Mean (intersection) [Watt m-2] |
Benchmark Period Mean (complement) [Watt m-2] |
Bias [Watt m-2] |
RMSE [Watt m-2] |
Phase Shift [months] |
Bias Score [1] |
RMSE Score [1] |
Seasonal Cycle Score [1] |
Spatial Distribution Score [1] |
Interannual Variability Score [1] |
Overall Score [1] |
|||
|---|---|---|---|---|---|---|---|---|---|---|---|---|---|---|---|---|---|
| Benchmark | [-] | 440. | |||||||||||||||
| CRUNCEPv7 | [-] | 447. | 447. | 440. | 430. | 6.01 | 12.7 | 0.806 | 0.675 | 0.603 | 0.899 | 0.981 | 0.774 | 0.756 | |||
| GSWP3v1 | [-] | 448. | 448. | 440. | 430. | 6.99 | 12.9 | 0.794 | 0.659 | 0.605 | 0.895 | 0.980 | 0.735 | 0.746 | |||
| WATCH | [-] | 441. | 441. | 439. | 429. | 1.49 | 11.8 | 0.917 | 0.713 | 0.587 | 0.877 | 0.973 | 0.779 | 0.753 |
Download Data |
Period Mean (original grids) [Watt m-2] |
Model Period Mean (intersection) [Watt m-2] |
Model Period Mean (complement) [Watt m-2] |
Benchmark Period Mean (intersection) [Watt m-2] |
Benchmark Period Mean (complement) [Watt m-2] |
Bias [Watt m-2] |
RMSE [Watt m-2] |
Phase Shift [months] |
Bias Score [1] |
RMSE Score [1] |
Seasonal Cycle Score [1] |
Spatial Distribution Score [1] |
Interannual Variability Score [1] |
Overall Score [1] |
|||
|---|---|---|---|---|---|---|---|---|---|---|---|---|---|---|---|---|---|
| Benchmark | [-] | 387. | |||||||||||||||
| CRUNCEPv7 | [-] | 383. | 382. | 386. | 394. | -2.95 | 18.3 | 0.590 | 0.613 | 0.627 | 0.936 | 0.999 | 0.718 | 0.753 | |||
| GSWP3v1 | [-] | 387. | 386. | 386. | 394. | 0.770 | 16.4 | 0.562 | 0.638 | 0.632 | 0.940 | 0.997 | 0.707 | 0.758 | |||
| WATCH | [-] | 387. | 386. | 385. | 394. | 1.83 | 16.9 | 0.589 | 0.629 | 0.601 | 0.933 | 1.00 | 0.746 | 0.752 |
Temporally integrated period mean