Mean State
Download Data |
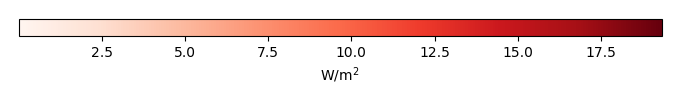
Period Mean (original grids) [W/m2] |
Model Period Mean (intersection) [W/m2] |
Model Period Mean (complement) [W/m2] |
Benchmark Period Mean (intersection) [W/m2] |
Benchmark Period Mean (complement) [W/m2] |
Bias [W/m2] |
RMSE [W/m2] |
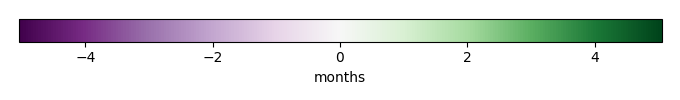
Phase Shift [months] |
Bias Score [1] |
RMSE Score [1] |
Seasonal Cycle Score [1] |
Spatial Distribution Score [1] |
Interannual Variability Score [1] |
Overall Score [1] |
|||
|---|---|---|---|---|---|---|---|---|---|---|---|---|---|---|---|---|---|
| Benchmark | [-] | 31.3 | |||||||||||||||
| CRUNCEPv7 | [-] | 36.3 | 36.0 | 32.3 | 12.4 | 4.32 | 8.09 | 1.57 | 0.290 | 0.388 | 0.780 | 0.969 | 0.522 | 0.556 | |||
| GSWP3v1 | [-] | 33.7 | 33.4 | 32.3 | 12.4 | 1.78 | 7.73 | 1.92 | 0.394 | 0.331 | 0.721 | 0.925 | 0.696 | 0.566 | |||
| WATCH | [-] | 26.8 | 26.4 | 32.5 | 12.5 | -5.20 | 10.3 | 2.54 | 0.173 | 0.297 | 0.604 | 0.958 | 0.583 | 0.485 |
Download Data |
Period Mean (original grids) [W/m2] |
Model Period Mean (intersection) [W/m2] |
Model Period Mean (complement) [W/m2] |
Benchmark Period Mean (intersection) [W/m2] |
Benchmark Period Mean (complement) [W/m2] |
Bias [W/m2] |
RMSE [W/m2] |
Phase Shift [months] |
Bias Score [1] |
RMSE Score [1] |
Seasonal Cycle Score [1] |
Spatial Distribution Score [1] |
Interannual Variability Score [1] |
Overall Score [1] |
|||
|---|---|---|---|---|---|---|---|---|---|---|---|---|---|---|---|---|---|
| Benchmark | [-] | 44.7 | |||||||||||||||
| CRUNCEPv7 | [-] | 46.8 | 47.3 | 45.1 | 13.9 | 2.00 | 8.70 | 1.03 | 0.462 | 0.397 | 0.876 | 0.974 | 0.723 | 0.638 | |||
| GSWP3v1 | [-] | 45.2 | 45.7 | 45.1 | 13.9 | 0.386 | 8.71 | 0.894 | 0.533 | 0.344 | 0.891 | 0.972 | 0.720 | 0.634 | |||
| WATCH | [-] | 37.5 | 38.0 | 45.4 | 13.8 | -7.51 | 12.2 | 1.42 | 0.320 | 0.354 | 0.808 | 0.956 | 0.602 | 0.566 |
Download Data |
Period Mean (original grids) [W/m2] |
Model Period Mean (intersection) [W/m2] |
Model Period Mean (complement) [W/m2] |
Benchmark Period Mean (intersection) [W/m2] |
Benchmark Period Mean (complement) [W/m2] |
Bias [W/m2] |
RMSE [W/m2] |
Phase Shift [months] |
Bias Score [1] |
RMSE Score [1] |
Seasonal Cycle Score [1] |
Spatial Distribution Score [1] |
Interannual Variability Score [1] |
Overall Score [1] |
|||
|---|---|---|---|---|---|---|---|---|---|---|---|---|---|---|---|---|---|
| Benchmark | [-] | 33.4 | |||||||||||||||
| CRUNCEPv7 | [-] | 36.8 | 36.9 | 34.3 | 15.0 | 2.82 | 8.31 | 1.19 | 0.520 | 0.463 | 0.839 | 0.914 | 0.616 | 0.636 | |||
| GSWP3v1 | [-] | 36.3 | 36.3 | 34.3 | 15.0 | 2.16 | 8.43 | 1.35 | 0.555 | 0.413 | 0.815 | 0.902 | 0.712 | 0.635 | |||
| WATCH | [-] | 32.6 | 32.6 | 33.3 | 14.8 | -0.527 | 8.05 | 1.56 | 0.514 | 0.426 | 0.781 | 0.961 | 0.619 | 0.621 |
Download Data |
Period Mean (original grids) [W/m2] |
Model Period Mean (intersection) [W/m2] |
Model Period Mean (complement) [W/m2] |
Benchmark Period Mean (intersection) [W/m2] |
Benchmark Period Mean (complement) [W/m2] |
Bias [W/m2] |
RMSE [W/m2] |
Phase Shift [months] |
Bias Score [1] |
RMSE Score [1] |
Seasonal Cycle Score [1] |
Spatial Distribution Score [1] |
Interannual Variability Score [1] |
Overall Score [1] |
|||
|---|---|---|---|---|---|---|---|---|---|---|---|---|---|---|---|---|---|
| Benchmark | [-] | 40.8 | |||||||||||||||
| CRUNCEPv7 | [-] | 36.1 | 36.0 | 41.2 | 35.6 | -3.96 | 23.8 | 0.305 | 0.811 | 0.636 | 0.980 | 0.940 | 0.631 | 0.772 | |||
| GSWP3v1 | [-] | 33.3 | 33.3 | 41.2 | 35.6 | -7.13 | 23.8 | 0.214 | 0.810 | 0.637 | 0.986 | 0.925 | 0.656 | 0.775 | |||
| WATCH | [-] | 33.0 | 32.9 | 43.1 | 42.3 | -9.36 | 21.1 | 0.278 | 0.777 | 0.677 | 0.981 | 0.956 | 0.596 | 0.777 |
Download Data |
Period Mean (original grids) [W/m2] |
Model Period Mean (intersection) [W/m2] |
Model Period Mean (complement) [W/m2] |
Benchmark Period Mean (intersection) [W/m2] |
Benchmark Period Mean (complement) [W/m2] |
Bias [W/m2] |
RMSE [W/m2] |
Phase Shift [months] |
Bias Score [1] |
RMSE Score [1] |
Seasonal Cycle Score [1] |
Spatial Distribution Score [1] |
Interannual Variability Score [1] |
Overall Score [1] |
|||
|---|---|---|---|---|---|---|---|---|---|---|---|---|---|---|---|---|---|
| Benchmark | [-] | 17.7 | |||||||||||||||
| CRUNCEPv7 | [-] | 29.8 | 29.8 | 19.3 | 12.3 | 10.9 | 11.9 | 2.09 | 0.199 | 0.391 | 0.655 | 0.321 | 0.481 | 0.406 | |||
| GSWP3v1 | [-] | 27.5 | 27.5 | 19.3 | 12.3 | 8.88 | 10.5 | 1.50 | 0.280 | 0.368 | 0.770 | 0.361 | 0.693 | 0.473 | |||
| WATCH | [-] | 21.6 | 21.5 | 18.7 | 11.9 | 4.05 | 9.21 | 2.07 | 0.209 | 0.292 | 0.683 | 0.890 | 0.496 | 0.477 |
Download Data |
Period Mean (original grids) [W/m2] |
Model Period Mean (intersection) [W/m2] |
Model Period Mean (complement) [W/m2] |
Benchmark Period Mean (intersection) [W/m2] |
Benchmark Period Mean (complement) [W/m2] |
Bias [W/m2] |
RMSE [W/m2] |
Phase Shift [months] |
Bias Score [1] |
RMSE Score [1] |
Seasonal Cycle Score [1] |
Spatial Distribution Score [1] |
Interannual Variability Score [1] |
Overall Score [1] |
|||
|---|---|---|---|---|---|---|---|---|---|---|---|---|---|---|---|---|---|
| Benchmark | [-] | 28.1 | |||||||||||||||
| CRUNCEPv7 | [-] | 25.6 | 25.4 | 28.2 | 21.3 | -2.84 | 11.5 | 0.326 | 0.799 | 0.624 | 0.976 | 0.966 | 0.640 | 0.772 | |||
| GSWP3v1 | [-] | 25.2 | 25.1 | 28.2 | 21.3 | -3.04 | 11.8 | 0.270 | 0.789 | 0.621 | 0.982 | 0.977 | 0.695 | 0.781 | |||
| WATCH | [-] | 21.3 | 21.2 | 27.9 | 23.3 | -6.64 | 12.1 | 0.396 | 0.704 | 0.624 | 0.968 | 0.970 | 0.640 | 0.755 |
Download Data |
Period Mean (original grids) [W/m2] |
Model Period Mean (intersection) [W/m2] |
Model Period Mean (complement) [W/m2] |
Benchmark Period Mean (intersection) [W/m2] |
Benchmark Period Mean (complement) [W/m2] |
Bias [W/m2] |
RMSE [W/m2] |
Phase Shift [months] |
Bias Score [1] |
RMSE Score [1] |
Seasonal Cycle Score [1] |
Spatial Distribution Score [1] |
Interannual Variability Score [1] |
Overall Score [1] |
|||
|---|---|---|---|---|---|---|---|---|---|---|---|---|---|---|---|---|---|
| Benchmark | [-] | 35.8 | |||||||||||||||
| CRUNCEPv7 | [-] | 39.1 | 39.1 | 36.5 | 15.2 | 1.84 | 12.6 | 1.01 | 0.611 | 0.516 | 0.865 | 0.898 | 0.678 | 0.680 | |||
| GSWP3v1 | [-] | 35.1 | 35.1 | 36.5 | 15.2 | -2.09 | 11.0 | 0.920 | 0.688 | 0.543 | 0.883 | 0.887 | 0.684 | 0.705 | |||
| WATCH | [-] | 34.8 | 34.7 | 36.6 | 14.8 | -2.59 | 11.9 | 1.09 | 0.663 | 0.506 | 0.851 | 0.955 | 0.664 | 0.691 |
Download Data |
Period Mean (original grids) [W/m2] |
Model Period Mean (intersection) [W/m2] |
Model Period Mean (complement) [W/m2] |
Benchmark Period Mean (intersection) [W/m2] |
Benchmark Period Mean (complement) [W/m2] |
Bias [W/m2] |
RMSE [W/m2] |
Phase Shift [months] |
Bias Score [1] |
RMSE Score [1] |
Seasonal Cycle Score [1] |
Spatial Distribution Score [1] |
Interannual Variability Score [1] |
Overall Score [1] |
|||
|---|---|---|---|---|---|---|---|---|---|---|---|---|---|---|---|---|---|
| Benchmark | [-] | 29.2 | |||||||||||||||
| CRUNCEPv7 | [-] | 37.4 | 37.4 | 30.4 | 12.7 | 6.14 | 10.7 | 1.01 | 0.427 | 0.455 | 0.882 | 0.895 | 0.633 | 0.624 | |||
| GSWP3v1 | [-] | 33.2 | 33.2 | 30.4 | 12.7 | 2.27 | 9.43 | 1.13 | 0.551 | 0.431 | 0.866 | 0.800 | 0.671 | 0.625 | |||
| WATCH | [-] | 30.4 | 30.3 | 30.9 | 12.6 | -1.06 | 10.2 | 1.47 | 0.423 | 0.389 | 0.797 | 0.949 | 0.652 | 0.600 |
Download Data |
Period Mean (original grids) [W/m2] |
Model Period Mean (intersection) [W/m2] |
Model Period Mean (complement) [W/m2] |
Benchmark Period Mean (intersection) [W/m2] |
Benchmark Period Mean (complement) [W/m2] |
Bias [W/m2] |
RMSE [W/m2] |
Phase Shift [months] |
Bias Score [1] |
RMSE Score [1] |
Seasonal Cycle Score [1] |
Spatial Distribution Score [1] |
Interannual Variability Score [1] |
Overall Score [1] |
|||
|---|---|---|---|---|---|---|---|---|---|---|---|---|---|---|---|---|---|
| Benchmark | [-] | 36.1 | |||||||||||||||
| CRUNCEPv7 | [-] | 34.3 | 34.2 | 36.1 | 36.1 | -1.19 | 20.6 | 0.269 | 0.874 | 0.667 | 0.982 | 0.987 | 0.605 | 0.797 | |||
| GSWP3v1 | [-] | 31.4 | 31.3 | 36.1 | 36.1 | -4.28 | 20.1 | 0.202 | 0.869 | 0.678 | 0.986 | 0.863 | 0.703 | 0.796 | |||
| WATCH | [-] | 29.3 | 29.1 | 37.8 | 40.9 | -8.14 | 18.5 | 0.269 | 0.829 | 0.692 | 0.982 | 0.818 | 0.608 | 0.770 |
Download Data |
Period Mean (original grids) [W/m2] |
Model Period Mean (intersection) [W/m2] |
Model Period Mean (complement) [W/m2] |
Benchmark Period Mean (intersection) [W/m2] |
Benchmark Period Mean (complement) [W/m2] |
Bias [W/m2] |
RMSE [W/m2] |
Phase Shift [months] |
Bias Score [1] |
RMSE Score [1] |
Seasonal Cycle Score [1] |
Spatial Distribution Score [1] |
Interannual Variability Score [1] |
Overall Score [1] |
|||
|---|---|---|---|---|---|---|---|---|---|---|---|---|---|---|---|---|---|
| Benchmark | [-] | 36.6 | |||||||||||||||
| CRUNCEPv7 | [-] | 40.9 | 41.0 | 38.5 | 12.8 | 1.52 | 8.92 | 0.687 | 0.638 | 0.560 | 0.940 | 0.833 | 0.691 | 0.703 | |||
| GSWP3v1 | [-] | 39.4 | 39.4 | 38.5 | 12.8 | 0.0558 | 9.10 | 0.622 | 0.616 | 0.565 | 0.942 | 0.799 | 0.693 | 0.696 | |||
| WATCH | [-] | 38.5 | 38.5 | 33.7 | 12.4 | 3.97 | 7.76 | 0.994 | 0.600 | 0.541 | 0.875 | 0.930 | 0.674 | 0.693 |
Download Data |
Period Mean (original grids) [W/m2] |
Model Period Mean (intersection) [W/m2] |
Model Period Mean (complement) [W/m2] |
Benchmark Period Mean (intersection) [W/m2] |
Benchmark Period Mean (complement) [W/m2] |
Bias [W/m2] |
RMSE [W/m2] |
Phase Shift [months] |
Bias Score [1] |
RMSE Score [1] |
Seasonal Cycle Score [1] |
Spatial Distribution Score [1] |
Interannual Variability Score [1] |
Overall Score [1] |
|||
|---|---|---|---|---|---|---|---|---|---|---|---|---|---|---|---|---|---|
| Benchmark | [-] | 19.6 | |||||||||||||||
| CRUNCEPv7 | [-] | 26.8 | 26.8 | 20.5 | 10.1 | 5.68 | 9.91 | 0.850 | 0.609 | 0.562 | 0.907 | 0.967 | 0.687 | 0.715 | |||
| GSWP3v1 | [-] | 22.3 | 22.3 | 20.5 | 10.1 | 1.68 | 8.97 | 0.854 | 0.691 | 0.559 | 0.896 | 0.842 | 0.668 | 0.703 | |||
| WATCH | [-] | 18.7 | 18.8 | 19.3 | 9.80 | -0.517 | 8.59 | 0.790 | 0.642 | 0.558 | 0.911 | 0.833 | 0.667 | 0.695 |
Download Data |
Period Mean (original grids) [W/m2] |
Model Period Mean (intersection) [W/m2] |
Model Period Mean (complement) [W/m2] |
Benchmark Period Mean (intersection) [W/m2] |
Benchmark Period Mean (complement) [W/m2] |
Bias [W/m2] |
RMSE [W/m2] |
Phase Shift [months] |
Bias Score [1] |
RMSE Score [1] |
Seasonal Cycle Score [1] |
Spatial Distribution Score [1] |
Interannual Variability Score [1] |
Overall Score [1] |
|||
|---|---|---|---|---|---|---|---|---|---|---|---|---|---|---|---|---|---|
| Benchmark | [-] | 24.0 | |||||||||||||||
| CRUNCEPv7 | [-] | 47.6 | 47.6 | 44.8 | 14.0 | 1.97 | 13.0 | 0.823 | 0.626 | 0.556 | 0.899 | 0.990 | 0.611 | 0.706 | |||
| GSWP3v1 | [-] | 44.9 | 44.9 | 44.8 | 14.0 | -0.748 | 12.7 | 0.768 | 0.650 | 0.548 | 0.906 | 0.990 | 0.686 | 0.722 | |||
| WATCH | [-] | 42.5 | 42.5 | 44.3 | 14.3 | -2.50 | 13.2 | 0.974 | 0.576 | 0.535 | 0.872 | 0.972 | 0.611 | 0.683 |
Download Data |
Period Mean (original grids) [W/m2] |
Model Period Mean (intersection) [W/m2] |
Model Period Mean (complement) [W/m2] |
Benchmark Period Mean (intersection) [W/m2] |
Benchmark Period Mean (complement) [W/m2] |
Bias [W/m2] |
RMSE [W/m2] |
Phase Shift [months] |
Bias Score [1] |
RMSE Score [1] |
Seasonal Cycle Score [1] |
Spatial Distribution Score [1] |
Interannual Variability Score [1] |
Overall Score [1] |
|||
|---|---|---|---|---|---|---|---|---|---|---|---|---|---|---|---|---|---|
| Benchmark | [-] | 72.5 | |||||||||||||||
| CRUNCEPv7 | [-] | 81.4 | 81.2 | 74.7 | 16.4 | 4.48 | 13.8 | 0.773 | 0.575 | 0.587 | 0.924 | 0.983 | 0.713 | 0.728 | |||
| GSWP3v1 | [-] | 78.5 | 78.3 | 74.7 | 16.4 | 1.75 | 14.0 | 0.756 | 0.590 | 0.558 | 0.923 | 0.980 | 0.705 | 0.719 | |||
| WATCH | [-] | 70.9 | 70.8 | 77.0 | 17.0 | -7.85 | 16.8 | 0.813 | 0.436 | 0.565 | 0.917 | 0.927 | 0.621 | 0.672 |
Download Data |
Period Mean (original grids) [W/m2] |
Model Period Mean (intersection) [W/m2] |
Model Period Mean (complement) [W/m2] |
Benchmark Period Mean (intersection) [W/m2] |
Benchmark Period Mean (complement) [W/m2] |
Bias [W/m2] |
RMSE [W/m2] |
Phase Shift [months] |
Bias Score [1] |
RMSE Score [1] |
Seasonal Cycle Score [1] |
Spatial Distribution Score [1] |
Interannual Variability Score [1] |
Overall Score [1] |
|||
|---|---|---|---|---|---|---|---|---|---|---|---|---|---|---|---|---|---|
| Benchmark | [-] | 46.1 | |||||||||||||||
| CRUNCEPv7 | [-] | 42.1 | 42.1 | 46.3 | 43.2 | -2.53 | 24.8 | 0.356 | 0.844 | 0.636 | 0.973 | 0.968 | 0.587 | 0.774 | |||
| GSWP3v1 | [-] | 37.3 | 37.3 | 46.3 | 43.2 | -7.82 | 24.1 | 0.184 | 0.830 | 0.656 | 0.986 | 0.956 | 0.672 | 0.793 | |||
| WATCH | [-] | 38.9 | 38.8 | 49.1 | 48.0 | -8.87 | 23.2 | 0.286 | 0.808 | 0.672 | 0.979 | 0.983 | 0.593 | 0.785 |
Download Data |
Period Mean (original grids) [W/m2] |
Model Period Mean (intersection) [W/m2] |
Model Period Mean (complement) [W/m2] |
Benchmark Period Mean (intersection) [W/m2] |
Benchmark Period Mean (complement) [W/m2] |
Bias [W/m2] |
RMSE [W/m2] |
Phase Shift [months] |
Bias Score [1] |
RMSE Score [1] |
Seasonal Cycle Score [1] |
Spatial Distribution Score [1] |
Interannual Variability Score [1] |
Overall Score [1] |
|||
|---|---|---|---|---|---|---|---|---|---|---|---|---|---|---|---|---|---|
| Benchmark | [-] | 26.3 | |||||||||||||||
| CRUNCEPv7 | [-] | 34.4 | 34.4 | 28.9 | 13.2 | 4.96 | 11.3 | 1.06 | 0.403 | 0.496 | 0.871 | 0.540 | 0.674 | 0.580 | |||
| GSWP3v1 | [-] | 33.9 | 33.9 | 28.9 | 13.2 | 4.55 | 10.7 | 0.760 | 0.435 | 0.490 | 0.907 | 0.620 | 0.695 | 0.606 | |||
| WATCH | [-] | 32.6 | 32.6 | 30.0 | 13.5 | 1.86 | 10.6 | 1.16 | 0.413 | 0.480 | 0.840 | 0.839 | 0.654 | 0.618 |
Download Data |
Period Mean (original grids) [W/m2] |
Model Period Mean (intersection) [W/m2] |
Model Period Mean (complement) [W/m2] |
Benchmark Period Mean (intersection) [W/m2] |
Benchmark Period Mean (complement) [W/m2] |
Bias [W/m2] |
RMSE [W/m2] |
Phase Shift [months] |
Bias Score [1] |
RMSE Score [1] |
Seasonal Cycle Score [1] |
Spatial Distribution Score [1] |
Interannual Variability Score [1] |
Overall Score [1] |
|||
|---|---|---|---|---|---|---|---|---|---|---|---|---|---|---|---|---|---|
| Benchmark | [-] | 26.9 | |||||||||||||||
| CRUNCEPv7 | [-] | 30.5 | 30.4 | 27.6 | 12.3 | 2.41 | 8.69 | 1.29 | 0.728 | 0.524 | 0.817 | 0.928 | 0.652 | 0.695 | |||
| GSWP3v1 | [-] | 27.6 | 27.5 | 27.6 | 12.3 | -0.305 | 8.02 | 1.11 | 0.718 | 0.551 | 0.839 | 0.834 | 0.673 | 0.694 | |||
| WATCH | [-] | 30.3 | 30.1 | 28.3 | 12.6 | 1.41 | 9.20 | 1.11 | 0.712 | 0.503 | 0.834 | 0.979 | 0.550 | 0.680 |
Download Data |
Period Mean (original grids) [W/m2] |
Model Period Mean (intersection) [W/m2] |
Model Period Mean (complement) [W/m2] |
Benchmark Period Mean (intersection) [W/m2] |
Benchmark Period Mean (complement) [W/m2] |
Bias [W/m2] |
RMSE [W/m2] |
Phase Shift [months] |
Bias Score [1] |
RMSE Score [1] |
Seasonal Cycle Score [1] |
Spatial Distribution Score [1] |
Interannual Variability Score [1] |
Overall Score [1] |
|||
|---|---|---|---|---|---|---|---|---|---|---|---|---|---|---|---|---|---|
| Benchmark | [-] | 26.3 | |||||||||||||||
| CRUNCEPv7 | [-] | 26.2 | 26.3 | 26.9 | 10.9 | -0.571 | 13.1 | 0.486 | 0.740 | 0.547 | 0.949 | 0.982 | 0.573 | 0.723 | |||
| GSWP3v1 | [-] | 23.6 | 23.7 | 26.9 | 10.9 | -3.27 | 12.6 | 0.410 | 0.720 | 0.564 | 0.955 | 0.970 | 0.611 | 0.731 | |||
| WATCH | [-] | 22.4 | 22.5 | 26.3 | 11.0 | -3.87 | 12.9 | 0.680 | 0.691 | 0.553 | 0.929 | 0.963 | 0.556 | 0.707 |
Download Data |
Period Mean (original grids) [W/m2] |
Model Period Mean (intersection) [W/m2] |
Model Period Mean (complement) [W/m2] |
Benchmark Period Mean (intersection) [W/m2] |
Benchmark Period Mean (complement) [W/m2] |
Bias [W/m2] |
RMSE [W/m2] |
Phase Shift [months] |
Bias Score [1] |
RMSE Score [1] |
Seasonal Cycle Score [1] |
Spatial Distribution Score [1] |
Interannual Variability Score [1] |
Overall Score [1] |
|||
|---|---|---|---|---|---|---|---|---|---|---|---|---|---|---|---|---|---|
| Benchmark | [-] | 38.3 | |||||||||||||||
| CRUNCEPv7 | [-] | 36.0 | 36.1 | 38.7 | 12.8 | -3.07 | 10.3 | 1.04 | 0.716 | 0.556 | 0.850 | 0.981 | 0.707 | 0.728 | |||
| GSWP3v1 | [-] | 34.6 | 34.6 | 38.7 | 12.8 | -4.44 | 10.2 | 1.05 | 0.683 | 0.577 | 0.846 | 0.967 | 0.725 | 0.729 | |||
| WATCH | [-] | 38.2 | 38.3 | 40.9 | 13.3 | -3.07 | 10.3 | 0.911 | 0.690 | 0.553 | 0.879 | 0.994 | 0.594 | 0.710 |
Download Data |
Period Mean (original grids) [W/m2] |
Model Period Mean (intersection) [W/m2] |
Model Period Mean (complement) [W/m2] |
Benchmark Period Mean (intersection) [W/m2] |
Benchmark Period Mean (complement) [W/m2] |
Bias [W/m2] |
RMSE [W/m2] |
Phase Shift [months] |
Bias Score [1] |
RMSE Score [1] |
Seasonal Cycle Score [1] |
Spatial Distribution Score [1] |
Interannual Variability Score [1] |
Overall Score [1] |
|||
|---|---|---|---|---|---|---|---|---|---|---|---|---|---|---|---|---|---|
| Benchmark | [-] | 27.6 | |||||||||||||||
| CRUNCEPv7 | [-] | 28.9 | 28.9 | 28.0 | 11.7 | 1.09 | 5.10 | 1.35 | 0.584 | 0.443 | 0.819 | 0.654 | 0.505 | 0.574 | |||
| GSWP3v1 | [-] | 27.1 | 27.1 | 28.0 | 11.7 | -0.726 | 5.09 | 1.15 | 0.546 | 0.448 | 0.858 | 0.746 | 0.627 | 0.612 | |||
| WATCH | [-] | 23.7 | 23.7 | 27.9 | 11.8 | -4.05 | 7.10 | 1.52 | 0.364 | 0.400 | 0.791 | 0.845 | 0.615 | 0.569 |
Download Data |
Period Mean (original grids) [W/m2] |
Model Period Mean (intersection) [W/m2] |
Model Period Mean (complement) [W/m2] |
Benchmark Period Mean (intersection) [W/m2] |
Benchmark Period Mean (complement) [W/m2] |
Bias [W/m2] |
RMSE [W/m2] |
Phase Shift [months] |
Bias Score [1] |
RMSE Score [1] |
Seasonal Cycle Score [1] |
Spatial Distribution Score [1] |
Interannual Variability Score [1] |
Overall Score [1] |
|||
|---|---|---|---|---|---|---|---|---|---|---|---|---|---|---|---|---|---|
| Benchmark | [-] | 31.2 | |||||||||||||||
| CRUNCEPv7 | [-] | 33.1 | 33.1 | 31.8 | 11.7 | 1.25 | 6.24 | 1.09 | 0.682 | 0.521 | 0.855 | 0.676 | 0.651 | 0.651 | |||
| GSWP3v1 | [-] | 31.6 | 31.6 | 31.8 | 11.7 | -0.285 | 6.44 | 1.08 | 0.672 | 0.494 | 0.855 | 0.802 | 0.725 | 0.674 | |||
| WATCH | [-] | 27.8 | 27.8 | 30.4 | 11.6 | -2.60 | 7.18 | 1.68 | 0.506 | 0.480 | 0.744 | 0.757 | 0.653 | 0.603 |
Download Data |
Period Mean (original grids) [W/m2] |
Model Period Mean (intersection) [W/m2] |
Model Period Mean (complement) [W/m2] |
Benchmark Period Mean (intersection) [W/m2] |
Benchmark Period Mean (complement) [W/m2] |
Bias [W/m2] |
RMSE [W/m2] |
Phase Shift [months] |
Bias Score [1] |
RMSE Score [1] |
Seasonal Cycle Score [1] |
Spatial Distribution Score [1] |
Interannual Variability Score [1] |
Overall Score [1] |
|||
|---|---|---|---|---|---|---|---|---|---|---|---|---|---|---|---|---|---|
| Benchmark | [-] | 30.1 | |||||||||||||||
| CRUNCEPv7 | [-] | 34.0 | 34.0 | 32.0 | 13.9 | 1.73 | 10.3 | 0.738 | 0.544 | 0.528 | 0.917 | 0.829 | 0.670 | 0.670 | |||
| GSWP3v1 | [-] | 33.2 | 33.2 | 32.0 | 13.9 | 0.808 | 9.75 | 0.826 | 0.568 | 0.532 | 0.908 | 0.961 | 0.697 | 0.700 | |||
| WATCH | [-] | 32.8 | 32.8 | 32.4 | 14.1 | 0.0103 | 10.5 | 0.881 | 0.520 | 0.544 | 0.897 | 0.969 | 0.660 | 0.689 |
Temporally integrated period mean