Mean State
Download Data |
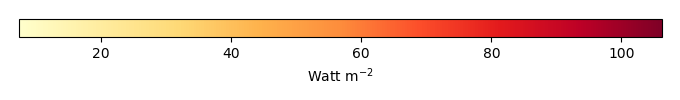
Period Mean (original grids) [Watt m-2] |
Bias [Watt m-2] |
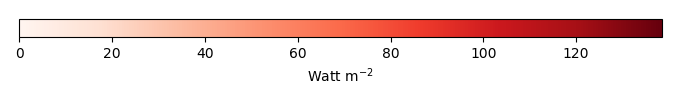
RMSE [Watt m-2] |
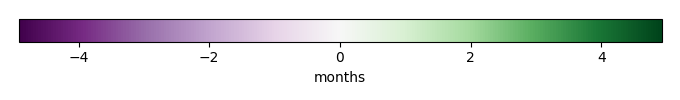
Phase Shift [months] |
Bias Score [1] |
RMSE Score [1] |
Seasonal Cycle Score [1] |
Interannual Variability Score [1] |
Overall Score [1] |
|||
|---|---|---|---|---|---|---|---|---|---|---|---|---|
| Benchmark | [-] | 41.9 | ||||||||||
| CRUNCEPv7 | [-] | 36.0 | -5.82 | 41.3 | 5.10 | 0.434 | 0.367 | 0.0631 | 0.419 | 0.330 | ||
| GSWP3v1 | [-] | 34.8 | -5.59 | 41.0 | 5.10 | 0.436 | 0.370 | 0.0631 | 0.416 | 0.331 | ||
| WATCH | [-] | 32.3 | nan | nan | nan | 0.00 | nan | nan | nan | nan |
Download Data |
Period Mean (original grids) [Watt m-2] |
Bias [Watt m-2] |
RMSE [Watt m-2] |
Phase Shift [months] |
Bias Score [1] |
RMSE Score [1] |
Seasonal Cycle Score [1] |
Interannual Variability Score [1] |
Overall Score [1] |
|||
|---|---|---|---|---|---|---|---|---|---|---|---|---|
| Benchmark | [-] | 44.7 | ||||||||||
| CRUNCEPv7 | [-] | 25.6 | -17.3 | 45.6 | 3.03 | 0.701 | 0.472 | 0.502 | 0.595 | 0.548 | ||
| GSWP3v1 | [-] | 21.5 | -21.3 | 47.9 | 3.54 | 0.621 | 0.471 | 0.376 | 0.556 | 0.499 | ||
| WATCH | [-] | 18.1 | -37.3 | 64.7 | 1.02 | 0.512 | 0.473 | 0.874 | 0.546 | 0.576 |
Download Data |
Period Mean (original grids) [Watt m-2] |
Bias [Watt m-2] |
RMSE [Watt m-2] |
Phase Shift [months] |
Bias Score [1] |
RMSE Score [1] |
Seasonal Cycle Score [1] |
Interannual Variability Score [1] |
Overall Score [1] |
|||
|---|---|---|---|---|---|---|---|---|---|---|---|---|
| Benchmark | [-] | 61.8 | ||||||||||
| CRUNCEPv7 | [-] | 42.3 | -5.67 | 27.4 | 1.84 | 0.438 | 0.459 | 0.698 | 0.514 | 0.514 | ||
| GSWP3v1 | [-] | 38.3 | -10.3 | 24.1 | 1.78 | 0.394 | 0.503 | 0.702 | 0.498 | 0.520 | ||
| WATCH | [-] | 38.5 | -9.65 | 26.2 | 1.08 | 0.334 | 0.472 | 0.835 | 0.479 | 0.518 |
Download Data |
Period Mean (original grids) [Watt m-2] |
Bias [Watt m-2] |
RMSE [Watt m-2] |
Phase Shift [months] |
Bias Score [1] |
RMSE Score [1] |
Seasonal Cycle Score [1] |
Interannual Variability Score [1] |
Overall Score [1] |
|||
|---|---|---|---|---|---|---|---|---|---|---|---|---|
| Benchmark | [-] | 81.1 | ||||||||||
| CRUNCEPv7 | [-] | 77.8 | 4.77 | 7.59 | 0.00 | 0.255 | 0.755 | 1.00 | 0.916 | 0.736 | ||
| GSWP3v1 | [-] | 72.8 | -0.0110 | 7.14 | 0.00 | 0.333 | 0.669 | 1.00 | 0.742 | 0.683 | ||
| WATCH | [-] | 66.1 | -6.02 | 7.91 | 0.00 | 0.237 | 0.697 | 1.00 | 0.756 | 0.678 |
Download Data |
Period Mean (original grids) [Watt m-2] |
Bias [Watt m-2] |
RMSE [Watt m-2] |
Phase Shift [months] |
Bias Score [1] |
RMSE Score [1] |
Seasonal Cycle Score [1] |
Interannual Variability Score [1] |
Overall Score [1] |
|||
|---|---|---|---|---|---|---|---|---|---|---|---|---|
| Benchmark | [-] | 55.8 | ||||||||||
| CRUNCEPv7 | [-] | 42.8 | -21.9 | 41.5 | 0.00 | 0.364 | 0.600 | 1.00 | 0.326 | 0.578 | ||
| GSWP3v1 | [-] | 36.7 | -21.7 | 41.0 | 0.00 | 0.365 | 0.605 | 1.00 | 0.340 | 0.583 | ||
| WATCH | [-] | 43.9 | -18.7 | 34.2 | 0.00 | 0.386 | 0.665 | 1.00 | 0.396 | 0.623 |
Download Data |
Period Mean (original grids) [Watt m-2] |
Bias [Watt m-2] |
RMSE [Watt m-2] |
Phase Shift [months] |
Bias Score [1] |
RMSE Score [1] |
Seasonal Cycle Score [1] |
Interannual Variability Score [1] |
Overall Score [1] |
|||
|---|---|---|---|---|---|---|---|---|---|---|---|---|
| Benchmark | [-] | 39.0 | ||||||||||
| CRUNCEPv7 | [-] | 33.3 | -4.68 | 11.5 | 2.03 | 0.716 | 0.497 | 0.650 | 0.808 | 0.634 | ||
| GSWP3v1 | [-] | 29.7 | -8.64 | 12.4 | 2.03 | 0.543 | 0.550 | 0.650 | 0.771 | 0.613 | ||
| WATCH | [-] | 33.5 | -5.70 | 11.0 | 1.26 | 0.433 | 0.506 | 0.767 | 0.785 | 0.599 |
Download Data |
Period Mean (original grids) [Watt m-2] |
Bias [Watt m-2] |
RMSE [Watt m-2] |
Phase Shift [months] |
Bias Score [1] |
RMSE Score [1] |
Seasonal Cycle Score [1] |
Interannual Variability Score [1] |
Overall Score [1] |
|||
|---|---|---|---|---|---|---|---|---|---|---|---|---|
| Benchmark | [-] | 42.0 | ||||||||||
| CRUNCEPv7 | [-] | 35.8 | -6.21 | 11.9 | 1.27 | 0.681 | 0.549 | 0.795 | 0.765 | 0.668 | ||
| GSWP3v1 | [-] | 34.9 | -7.12 | 11.9 | 0.762 | 0.626 | 0.552 | 0.874 | 0.788 | 0.678 | ||
| WATCH | [-] | 43.1 | 1.19 | 13.7 | 1.25 | 0.559 | 0.452 | 0.798 | 0.712 | 0.594 |
Temporally integrated period mean