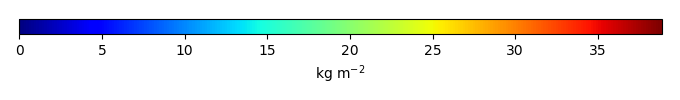
Mean State
Download Data |
Period Mean (original grids) [Pg] |
Model Period Mean (intersection) [Pg] |
Model Period Mean (complement) [Pg] |
Benchmark Period Mean (intersection) [Pg] |
Benchmark Period Mean (complement) [Pg] |
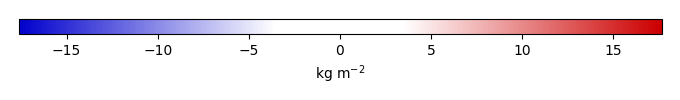
Bias [kg m-2] |
Bias Score [1] |
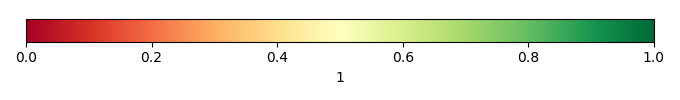
Spatial Distribution Score [1] |
Overall Score [1] |
|||
|---|---|---|---|---|---|---|---|---|---|---|---|---|
| Benchmark | [-] | 64.0 | ||||||||||
| CLM4.5_CRUNCEP | [-] | 58.5 | 58.5 | 0.385 | 63.9 | 0.0663 | -1.25 | 0.75 | 0.95 | 0.85 | ||
| CLM4.5_GSWP3 | [-] | 45.2 | 45.1 | 0.424 | 63.9 | 0.0663 | -5.16 | 0.70 | 0.85 | 0.77 | ||
| CLM4_CRUNCEP | [-] | 58.3 | 59.0 | 0.353 | 63.9 | 0.0663 | -1.12 | 0.74 | 0.89 | 0.81 | ||
| CLM4_GSWP3 | [-] | 49.3 | 50.0 | 0.362 | 63.9 | 0.0663 | -3.82 | 0.72 | 0.79 | 0.75 | ||
| CLM5_CRUNCEP | [-] | 42.9 | 43.1 | 0.424 | 63.9 | 0.0663 | -5.75 | 0.67 | 0.67 | 0.67 | ||
| CLM5_GSWP3 | [-] | 38.4 | 38.4 | 0.429 | 63.9 | 0.0663 | -7.15 | 0.63 | 0.58 | 0.61 |
Download Data |
Period Mean (original grids) [Pg] |
Model Period Mean (intersection) [Pg] |
Model Period Mean (complement) [Pg] |
Benchmark Period Mean (intersection) [Pg] |
Benchmark Period Mean (complement) [Pg] |
Bias [kg m-2] |
Bias Score [1] |
Spatial Distribution Score [1] |
Overall Score [1] |
|||
|---|---|---|---|---|---|---|---|---|---|---|---|---|
| Benchmark | [-] | 3.34 | ||||||||||
| CLM4.5_CRUNCEP | [-] | 2.41 | 1.48 | 0.654 | 3.34 | 0.00700 | -0.576 | 0.48 | 0.54 | 0.51 | ||
| CLM4.5_GSWP3 | [-] | 2.24 | 1.33 | 0.706 | 3.34 | 0.00700 | -0.628 | 0.47 | 0.37 | 0.42 | ||
| CLM4_CRUNCEP | [-] | 7.54 | 5.80 | 0.858 | 3.34 | 0.00700 | 0.872 | 0.52 | 0.82 | 0.67 | ||
| CLM4_GSWP3 | [-] | 7.61 | 5.85 | 0.958 | 3.34 | 0.00700 | 0.882 | 0.54 | 0.84 | 0.69 | ||
| CLM5_CRUNCEP | [-] | 3.63 | 2.48 | 0.742 | 3.34 | 0.00700 | -0.242 | 0.53 | 0.58 | 0.56 | ||
| CLM5_GSWP3 | [-] | 3.30 | 2.21 | 0.738 | 3.34 | 0.00700 | -0.331 | 0.50 | 0.57 | 0.53 |
Download Data |
Period Mean (original grids) [Pg] |
Model Period Mean (intersection) [Pg] |
Model Period Mean (complement) [Pg] |
Benchmark Period Mean (intersection) [Pg] |
Benchmark Period Mean (complement) [Pg] |
Bias [kg m-2] |
Bias Score [1] |
Spatial Distribution Score [1] |
Overall Score [1] |
|||
|---|---|---|---|---|---|---|---|---|---|---|---|---|
| Benchmark | [-] | 14.1 | ||||||||||
| CLM4.5_CRUNCEP | [-] | 6.84 | 5.93 | 0.756 | 14.1 | 0.0194 | -1.05 | 0.49 | 0.67 | 0.58 | ||
| CLM4.5_GSWP3 | [-] | 5.23 | 4.36 | 0.756 | 14.1 | 0.0194 | -1.29 | 0.46 | 0.54 | 0.50 | ||
| CLM4_CRUNCEP | [-] | 13.7 | 12.7 | 0.697 | 14.1 | 0.0194 | -0.118 | 0.53 | 0.80 | 0.66 | ||
| CLM4_GSWP3 | [-] | 10.9 | 9.99 | 0.716 | 14.1 | 0.0194 | -0.481 | 0.54 | 0.74 | 0.64 | ||
| CLM5_CRUNCEP | [-] | 17.0 | 15.6 | 1.11 | 14.1 | 0.0194 | 0.409 | 0.56 | 0.83 | 0.70 | ||
| CLM5_GSWP3 | [-] | 12.3 | 11.1 | 0.996 | 14.1 | 0.0194 | -0.223 | 0.55 | 0.79 | 0.67 |
Download Data |
Period Mean (original grids) [Pg] |
Model Period Mean (intersection) [Pg] |
Model Period Mean (complement) [Pg] |
Benchmark Period Mean (intersection) [Pg] |
Benchmark Period Mean (complement) [Pg] |
Bias [kg m-2] |
Bias Score [1] |
Spatial Distribution Score [1] |
Overall Score [1] |
|||
|---|---|---|---|---|---|---|---|---|---|---|---|---|
| Benchmark | [-] | 1.22 | ||||||||||
| CLM4.5_CRUNCEP | [-] | 3.26 | 2.82 | 0.450 | 1.22 | 0.00453 | 0.719 | 0.47 | 0.72 | 0.60 | ||
| CLM4.5_GSWP3 | [-] | 3.11 | 2.74 | 0.386 | 1.22 | 0.00453 | 0.689 | 0.48 | 0.74 | 0.61 | ||
| CLM4_CRUNCEP | [-] | 0.754 | 0.700 | 0.0764 | 1.22 | 0.00453 | -0.157 | 0.52 | 0.74 | 0.63 | ||
| CLM4_GSWP3 | [-] | 0.802 | 0.743 | 0.0853 | 1.22 | 0.00453 | -0.142 | 0.55 | 0.75 | 0.65 | ||
| CLM5_CRUNCEP | [-] | 5.09 | 4.27 | 0.836 | 1.22 | 0.00453 | 1.36 | 0.37 | 0.45 | 0.41 | ||
| CLM5_GSWP3 | [-] | 4.18 | 3.37 | 0.817 | 1.22 | 0.00453 | 0.991 | 0.47 | 0.50 | 0.49 |
Download Data |
Period Mean (original grids) [Pg] |
Model Period Mean (intersection) [Pg] |
Model Period Mean (complement) [Pg] |
Benchmark Period Mean (intersection) [Pg] |
Benchmark Period Mean (complement) [Pg] |
Bias [kg m-2] |
Bias Score [1] |
Spatial Distribution Score [1] |
Overall Score [1] |
|||
|---|---|---|---|---|---|---|---|---|---|---|---|---|
| Benchmark | [-] | 47.3 | ||||||||||
| CLM4.5_CRUNCEP | [-] | 66.7 | 63.6 | 2.92 | 45.9 | 1.37 | 12.2 | 0.68 | 0.83 | 0.76 | ||
| CLM4.5_GSWP3 | [-] | 54.1 | 51.7 | 2.13 | 45.9 | 1.37 | 7.51 | 0.71 | 0.79 | 0.75 | ||
| CLM4_CRUNCEP | [-] | 80.1 | 76.3 | 3.39 | 45.9 | 1.37 | 17.0 | 0.56 | 0.92 | 0.74 | ||
| CLM4_GSWP3 | [-] | 63.3 | 60.7 | 2.35 | 45.9 | 1.37 | 10.2 | 0.68 | 0.92 | 0.80 | ||
| CLM5_CRUNCEP | [-] | 49.6 | 47.1 | 2.28 | 45.9 | 1.37 | 5.89 | 0.71 | 0.64 | 0.68 | ||
| CLM5_GSWP3 | [-] | 40.1 | 38.1 | 1.81 | 45.9 | 1.37 | 2.33 | 0.68 | 0.51 | 0.60 |
Download Data |
Period Mean (original grids) [Pg] |
Model Period Mean (intersection) [Pg] |
Model Period Mean (complement) [Pg] |
Benchmark Period Mean (intersection) [Pg] |
Benchmark Period Mean (complement) [Pg] |
Bias [kg m-2] |
Bias Score [1] |
Spatial Distribution Score [1] |
Overall Score [1] |
|||
|---|---|---|---|---|---|---|---|---|---|---|---|---|
| Benchmark | [-] | 41.6 | ||||||||||
| CLM4.5_CRUNCEP | [-] | 42.7 | 41.5 | 0.315 | 41.6 | 0.0303 | 0.128 | 0.63 | 0.87 | 0.75 | ||
| CLM4.5_GSWP3 | [-] | 31.5 | 30.7 | 0.274 | 41.6 | 0.0303 | -1.10 | 0.65 | 0.90 | 0.77 | ||
| CLM4_CRUNCEP | [-] | 38.3 | 37.3 | 0.236 | 41.6 | 0.0303 | -0.349 | 0.62 | 0.87 | 0.74 | ||
| CLM4_GSWP3 | [-] | 26.7 | 25.9 | 0.164 | 41.6 | 0.0303 | -1.67 | 0.59 | 0.82 | 0.70 | ||
| CLM5_CRUNCEP | [-] | 73.2 | 71.5 | 0.536 | 41.6 | 0.0303 | 3.57 | 0.49 | 0.67 | 0.58 | ||
| CLM5_GSWP3 | [-] | 52.3 | 51.1 | 0.450 | 41.6 | 0.0303 | 1.23 | 0.55 | 0.74 | 0.65 |
Download Data |
Period Mean (original grids) [Pg] |
Model Period Mean (intersection) [Pg] |
Model Period Mean (complement) [Pg] |
Benchmark Period Mean (intersection) [Pg] |
Benchmark Period Mean (complement) [Pg] |
Bias [kg m-2] |
Bias Score [1] |
Spatial Distribution Score [1] |
Overall Score [1] |
|||
|---|---|---|---|---|---|---|---|---|---|---|---|---|
| Benchmark | [-] | 15.6 | ||||||||||
| CLM4.5_CRUNCEP | [-] | 44.4 | 41.8 | 3.15 | 15.6 | 0.0349 | 3.38 | 0.43 | 0.44 | 0.43 | ||
| CLM4.5_GSWP3 | [-] | 40.8 | 38.2 | 3.05 | 15.6 | 0.0349 | 2.92 | 0.46 | 0.49 | 0.47 | ||
| CLM4_CRUNCEP | [-] | 45.8 | 43.5 | 3.01 | 15.6 | 0.0349 | 3.58 | 0.40 | 0.44 | 0.42 | ||
| CLM4_GSWP3 | [-] | 40.7 | 38.6 | 2.67 | 15.6 | 0.0349 | 2.91 | 0.45 | 0.51 | 0.48 | ||
| CLM5_CRUNCEP | [-] | 36.3 | 33.8 | 3.32 | 15.6 | 0.0349 | 2.50 | 0.45 | 0.59 | 0.52 | ||
| CLM5_GSWP3 | [-] | 31.8 | 29.6 | 2.96 | 15.6 | 0.0349 | 1.93 | 0.51 | 0.68 | 0.59 |
Download Data |
Period Mean (original grids) [Pg] |
Model Period Mean (intersection) [Pg] |
Model Period Mean (complement) [Pg] |
Benchmark Period Mean (intersection) [Pg] |
Benchmark Period Mean (complement) [Pg] |
Bias [kg m-2] |
Bias Score [1] |
Spatial Distribution Score [1] |
Overall Score [1] |
|||
|---|---|---|---|---|---|---|---|---|---|---|---|---|
| Benchmark | [-] | 14.8 | ||||||||||
| CLM4.5_CRUNCEP | [-] | 25.9 | 23.6 | 1.50 | 14.6 | 0.136 | 2.85 | 0.46 | 0.49 | 0.48 | ||
| CLM4.5_GSWP3 | [-] | 23.3 | 21.2 | 1.33 | 14.6 | 0.136 | 2.21 | 0.47 | 0.56 | 0.51 | ||
| CLM4_CRUNCEP | [-] | 30.8 | 28.4 | 1.41 | 14.6 | 0.136 | 3.57 | 0.49 | 0.56 | 0.53 | ||
| CLM4_GSWP3 | [-] | 28.6 | 26.4 | 1.31 | 14.6 | 0.136 | 2.95 | 0.50 | 0.61 | 0.55 | ||
| CLM5_CRUNCEP | [-] | 25.5 | 23.4 | 1.50 | 14.6 | 0.136 | 2.67 | 0.53 | 0.69 | 0.61 | ||
| CLM5_GSWP3 | [-] | 24.9 | 22.6 | 1.43 | 14.6 | 0.136 | 2.37 | 0.53 | 0.73 | 0.63 |
Download Data |
Period Mean (original grids) [Pg] |
Model Period Mean (intersection) [Pg] |
Model Period Mean (complement) [Pg] |
Benchmark Period Mean (intersection) [Pg] |
Benchmark Period Mean (complement) [Pg] |
Bias [kg m-2] |
Bias Score [1] |
Spatial Distribution Score [1] |
Overall Score [1] |
|||
|---|---|---|---|---|---|---|---|---|---|---|---|---|
| Benchmark | [-] | 1.78 | ||||||||||
| CLM4.5_CRUNCEP | [-] | 3.53 | 2.97 | 0.775 | 1.78 | 0.590 | 0.60 | 0.85 | 0.72 | |||
| CLM4.5_GSWP3 | [-] | 3.23 | 2.60 | 0.782 | 1.78 | 0.399 | 0.61 | 0.75 | 0.68 | |||
| CLM4_CRUNCEP | [-] | 0.850 | 0.788 | 0.165 | 1.78 | -0.490 | 0.50 | 0.56 | 0.53 | |||
| CLM4_GSWP3 | [-] | 0.737 | 0.697 | 0.122 | 1.78 | -0.540 | 0.50 | 0.47 | 0.48 | |||
| CLM5_CRUNCEP | [-] | 8.91 | 7.07 | 2.32 | 1.78 | 2.69 | 0.31 | 0.54 | 0.42 | |||
| CLM5_GSWP3 | [-] | 6.90 | 5.31 | 1.98 | 1.78 | 1.79 | 0.40 | 0.58 | 0.49 |
Download Data |
Period Mean (original grids) [Pg] |
Model Period Mean (intersection) [Pg] |
Model Period Mean (complement) [Pg] |
Benchmark Period Mean (intersection) [Pg] |
Benchmark Period Mean (complement) [Pg] |
Bias [kg m-2] |
Bias Score [1] |
Spatial Distribution Score [1] |
Overall Score [1] |
|||
|---|---|---|---|---|---|---|---|---|---|---|---|---|
| Benchmark | [-] | 15.3 | ||||||||||
| CLM4.5_CRUNCEP | [-] | 8.05 | 6.57 | 1.36 | 14.8 | 0.505 | -0.979 | 0.50 | 0.73 | 0.61 | ||
| CLM4.5_GSWP3 | [-] | 8.12 | 6.70 | 1.35 | 14.8 | 0.505 | -0.953 | 0.50 | 0.74 | 0.62 | ||
| CLM4_CRUNCEP | [-] | 7.97 | 6.77 | 1.06 | 14.8 | 0.505 | -0.929 | 0.48 | 0.74 | 0.61 | ||
| CLM4_GSWP3 | [-] | 8.06 | 6.86 | 1.10 | 14.8 | 0.505 | -0.972 | 0.50 | 0.75 | 0.63 | ||
| CLM5_CRUNCEP | [-] | 11.8 | 9.77 | 1.81 | 14.8 | 0.505 | -0.0658 | 0.55 | 0.80 | 0.67 | ||
| CLM5_GSWP3 | [-] | 11.3 | 9.25 | 1.86 | 14.8 | 0.505 | -0.174 | 0.55 | 0.81 | 0.68 |
Download Data |
Period Mean (original grids) [Pg] |
Model Period Mean (intersection) [Pg] |
Model Period Mean (complement) [Pg] |
Benchmark Period Mean (intersection) [Pg] |
Benchmark Period Mean (complement) [Pg] |
Bias [kg m-2] |
Bias Score [1] |
Spatial Distribution Score [1] |
Overall Score [1] |
|||
|---|---|---|---|---|---|---|---|---|---|---|---|---|
| Benchmark | [-] | 13.1 | ||||||||||
| CLM4.5_CRUNCEP | [-] | 14.8 | 13.7 | 0.785 | 13.1 | 0.0236 | 0.582 | 0.63 | 0.84 | 0.74 | ||
| CLM4.5_GSWP3 | [-] | 11.3 | 10.4 | 0.655 | 13.1 | 0.0236 | -0.123 | 0.59 | 0.73 | 0.66 | ||
| CLM4_CRUNCEP | [-] | 8.23 | 7.61 | 0.488 | 13.1 | 0.0236 | -0.744 | 0.54 | 0.61 | 0.58 | ||
| CLM4_GSWP3 | [-] | 5.45 | 5.02 | 0.345 | 13.1 | 0.0236 | -1.34 | 0.48 | 0.32 | 0.40 | ||
| CLM5_CRUNCEP | [-] | 26.8 | 25.2 | 1.18 | 13.1 | 0.0236 | 3.21 | 0.50 | 0.59 | 0.55 | ||
| CLM5_GSWP3 | [-] | 18.2 | 17.0 | 0.899 | 13.1 | 0.0236 | 1.50 | 0.50 | 0.69 | 0.60 |
Download Data |
Period Mean (original grids) [Pg] |
Model Period Mean (intersection) [Pg] |
Model Period Mean (complement) [Pg] |
Benchmark Period Mean (intersection) [Pg] |
Benchmark Period Mean (complement) [Pg] |
Bias [kg m-2] |
Bias Score [1] |
Spatial Distribution Score [1] |
Overall Score [1] |
|||
|---|---|---|---|---|---|---|---|---|---|---|---|---|
| Benchmark | [-] | 455. | ||||||||||
| CLM4.5_CRUNCEP | [-] | 560. | 539. | 20.5 | 449. | 5.38 | 1.67 | 0.65 | 0.89 | 0.77 | ||
| CLM4.5_GSWP3 | [-] | 453. | 434. | 18.3 | 449. | 5.38 | 0.441 | 0.66 | 0.90 | 0.78 | ||
| CLM4_CRUNCEP | [-] | 584. | 566. | 17.6 | 449. | 5.38 | 1.95 | 0.61 | 0.83 | 0.72 | ||
| CLM4_GSWP3 | [-] | 467. | 453. | 14.8 | 449. | 5.38 | 0.561 | 0.63 | 0.89 | 0.76 | ||
| CLM5_CRUNCEP | [-] | 590. | 564. | 26.5 | 449. | 5.38 | 1.95 | 0.65 | 0.89 | 0.77 | ||
| CLM5_GSWP3 | [-] | 487. | 464. | 23.3 | 449. | 5.38 | 0.776 | 0.64 | 0.86 | 0.75 |
Download Data |
Period Mean (original grids) [Pg] |
Model Period Mean (intersection) [Pg] |
Model Period Mean (complement) [Pg] |
Benchmark Period Mean (intersection) [Pg] |
Benchmark Period Mean (complement) [Pg] |
Bias [kg m-2] |
Bias Score [1] |
Spatial Distribution Score [1] |
Overall Score [1] |
|||
|---|---|---|---|---|---|---|---|---|---|---|---|---|
| Benchmark | [-] | 0.854 | ||||||||||
| CLM4.5_CRUNCEP | [-] | 1.41 | 0.773 | 0.644 | 0.849 | 0.00531 | 0.0505 | 0.49 | 0.55 | 0.52 | ||
| CLM4.5_GSWP3 | [-] | 1.28 | 0.708 | 0.583 | 0.849 | 0.00531 | 0.0261 | 0.50 | 0.51 | 0.51 | ||
| CLM4_CRUNCEP | [-] | 1.28 | 0.821 | 0.449 | 0.849 | 0.00531 | 0.0925 | 0.51 | 0.75 | 0.63 | ||
| CLM4_GSWP3 | [-] | 1.25 | 0.783 | 0.466 | 0.849 | 0.00531 | 0.0569 | 0.51 | 0.68 | 0.60 | ||
| CLM5_CRUNCEP | [-] | 1.62 | 0.656 | 0.960 | 0.849 | 0.00531 | 0.00552 | 0.48 | 0.64 | 0.56 | ||
| CLM5_GSWP3 | [-] | 1.51 | 0.664 | 0.856 | 0.849 | 0.00531 | 0.0462 | 0.48 | 0.72 | 0.60 |
Download Data |
Period Mean (original grids) [Pg] |
Model Period Mean (intersection) [Pg] |
Model Period Mean (complement) [Pg] |
Benchmark Period Mean (intersection) [Pg] |
Benchmark Period Mean (complement) [Pg] |
Bias [kg m-2] |
Bias Score [1] |
Spatial Distribution Score [1] |
Overall Score [1] |
|||
|---|---|---|---|---|---|---|---|---|---|---|---|---|
| Benchmark | [-] | 2.82 | ||||||||||
| CLM4.5_CRUNCEP | [-] | 9.13 | 7.60 | 1.40 | 2.82 | 0.00299 | 1.54 | 0.45 | 0.75 | 0.60 | ||
| CLM4.5_GSWP3 | [-] | 7.91 | 6.65 | 1.14 | 2.82 | 0.00299 | 1.24 | 0.50 | 0.82 | 0.66 | ||
| CLM4_CRUNCEP | [-] | 4.26 | 3.55 | 0.632 | 2.82 | 0.00299 | 0.262 | 0.48 | 0.77 | 0.63 | ||
| CLM4_GSWP3 | [-] | 3.07 | 2.65 | 0.393 | 2.82 | 0.00299 | -0.0258 | 0.56 | 0.70 | 0.63 | ||
| CLM5_CRUNCEP | [-] | 16.4 | 13.6 | 2.63 | 2.82 | 0.00299 | 3.44 | 0.27 | 0.31 | 0.29 | ||
| CLM5_GSWP3 | [-] | 14.5 | 12.3 | 2.08 | 2.82 | 0.00299 | 3.01 | 0.27 | 0.35 | 0.31 |
Download Data |
Period Mean (original grids) [Pg] |
Model Period Mean (intersection) [Pg] |
Model Period Mean (complement) [Pg] |
Benchmark Period Mean (intersection) [Pg] |
Benchmark Period Mean (complement) [Pg] |
Bias [kg m-2] |
Bias Score [1] |
Spatial Distribution Score [1] |
Overall Score [1] |
|||
|---|---|---|---|---|---|---|---|---|---|---|---|---|
| Benchmark | [-] | 4.95 | ||||||||||
| CLM4.5_CRUNCEP | [-] | 11.4 | 10.4 | 0.699 | 4.88 | 0.0615 | 3.64 | 0.35 | 0.33 | 0.34 | ||
| CLM4.5_GSWP3 | [-] | 8.50 | 7.65 | 0.586 | 4.88 | 0.0615 | 2.21 | 0.43 | 0.42 | 0.42 | ||
| CLM4_CRUNCEP | [-] | 5.38 | 4.60 | 0.480 | 4.88 | 0.0615 | 0.803 | 0.45 | 0.35 | 0.40 | ||
| CLM4_GSWP3 | [-] | 4.63 | 3.96 | 0.391 | 4.88 | 0.0615 | 0.376 | 0.45 | 0.45 | 0.45 | ||
| CLM5_CRUNCEP | [-] | 12.0 | 10.8 | 0.884 | 4.88 | 0.0615 | 3.93 | 0.38 | 0.42 | 0.40 | ||
| CLM5_GSWP3 | [-] | 10.2 | 9.16 | 0.789 | 4.88 | 0.0615 | 3.11 | 0.45 | 0.52 | 0.48 |
Download Data |
Period Mean (original grids) [Pg] |
Model Period Mean (intersection) [Pg] |
Model Period Mean (complement) [Pg] |
Benchmark Period Mean (intersection) [Pg] |
Benchmark Period Mean (complement) [Pg] |
Bias [kg m-2] |
Bias Score [1] |
Spatial Distribution Score [1] |
Overall Score [1] |
|||
|---|---|---|---|---|---|---|---|---|---|---|---|---|
| Benchmark | [-] | 13.0 | ||||||||||
| CLM4.5_CRUNCEP | [-] | 19.8 | 19.2 | 0.460 | 13.0 | 0.00854 | 1.90 | 0.62 | 0.86 | 0.74 | ||
| CLM4.5_GSWP3 | [-] | 14.3 | 13.8 | 0.399 | 13.0 | 0.00854 | 0.479 | 0.64 | 0.90 | 0.77 | ||
| CLM4_CRUNCEP | [-] | 16.0 | 15.5 | 0.387 | 13.0 | 0.00854 | 0.895 | 0.64 | 0.90 | 0.77 | ||
| CLM4_GSWP3 | [-] | 13.1 | 12.6 | 0.328 | 13.0 | 0.00854 | 0.140 | 0.65 | 0.85 | 0.75 | ||
| CLM5_CRUNCEP | [-] | 17.6 | 17.1 | 0.407 | 13.0 | 0.00854 | 1.40 | 0.64 | 0.89 | 0.76 | ||
| CLM5_GSWP3 | [-] | 11.8 | 11.4 | 0.332 | 13.0 | 0.00854 | -0.100 | 0.65 | 0.87 | 0.76 |
Download Data |
Period Mean (original grids) [Pg] |
Model Period Mean (intersection) [Pg] |
Model Period Mean (complement) [Pg] |
Benchmark Period Mean (intersection) [Pg] |
Benchmark Period Mean (complement) [Pg] |
Bias [kg m-2] |
Bias Score [1] |
Spatial Distribution Score [1] |
Overall Score [1] |
|||
|---|---|---|---|---|---|---|---|---|---|---|---|---|
| Benchmark | [-] | 21.4 | ||||||||||
| CLM4.5_CRUNCEP | [-] | 34.9 | 34.7 | 0.437 | 21.3 | 0.128 | 2.91 | 0.54 | 0.85 | 0.69 | ||
| CLM4.5_GSWP3 | [-] | 28.3 | 28.0 | 0.400 | 21.3 | 0.128 | 1.61 | 0.61 | 0.90 | 0.76 | ||
| CLM4_CRUNCEP | [-] | 25.2 | 24.9 | 0.400 | 21.3 | 0.128 | 0.993 | 0.58 | 0.85 | 0.72 | ||
| CLM4_GSWP3 | [-] | 16.5 | 16.2 | 0.296 | 21.3 | 0.128 | -0.772 | 0.62 | 0.79 | 0.71 | ||
| CLM5_CRUNCEP | [-] | 57.0 | 56.6 | 0.599 | 21.3 | 0.128 | 7.37 | 0.37 | 0.70 | 0.54 | ||
| CLM5_GSWP3 | [-] | 43.8 | 43.5 | 0.471 | 21.3 | 0.128 | 4.72 | 0.47 | 0.79 | 0.63 |
Download Data |
Period Mean (original grids) [Pg] |
Model Period Mean (intersection) [Pg] |
Model Period Mean (complement) [Pg] |
Benchmark Period Mean (intersection) [Pg] |
Benchmark Period Mean (complement) [Pg] |
Bias [kg m-2] |
Bias Score [1] |
Spatial Distribution Score [1] |
Overall Score [1] |
|||
|---|---|---|---|---|---|---|---|---|---|---|---|---|
| Benchmark | [-] | 9.57 | ||||||||||
| CLM4.5_CRUNCEP | [-] | 3.36 | 3.15 | 0.248 | 9.53 | 0.0397 | -1.87 | 0.48 | 0.32 | 0.40 | ||
| CLM4.5_GSWP3 | [-] | 2.93 | 2.71 | 0.257 | 9.53 | 0.0397 | -1.99 | 0.47 | 0.26 | 0.36 | ||
| CLM4_CRUNCEP | [-] | 5.10 | 4.86 | 0.276 | 9.53 | 0.0397 | -1.34 | 0.56 | 0.51 | 0.53 | ||
| CLM4_GSWP3 | [-] | 3.96 | 3.74 | 0.266 | 9.53 | 0.0397 | -1.71 | 0.51 | 0.28 | 0.40 | ||
| CLM5_CRUNCEP | [-] | 3.52 | 3.30 | 0.245 | 9.53 | 0.0397 | -1.79 | 0.50 | 0.65 | 0.57 | ||
| CLM5_GSWP3 | [-] | 3.09 | 2.90 | 0.233 | 9.53 | 0.0397 | -1.92 | 0.49 | 0.49 | 0.49 |
Download Data |
Period Mean (original grids) [Pg] |
Model Period Mean (intersection) [Pg] |
Model Period Mean (complement) [Pg] |
Benchmark Period Mean (intersection) [Pg] |
Benchmark Period Mean (complement) [Pg] |
Bias [kg m-2] |
Bias Score [1] |
Spatial Distribution Score [1] |
Overall Score [1] |
|||
|---|---|---|---|---|---|---|---|---|---|---|---|---|
| Benchmark | [-] | 151. | ||||||||||
| CLM4.5_CRUNCEP | [-] | 181. | 180. | 0.636 | 151. | 0.0403 | 3.94 | 0.74 | 0.96 | 0.85 | ||
| CLM4.5_GSWP3 | [-] | 141. | 141. | 0.533 | 151. | 0.0403 | -0.828 | 0.77 | 0.95 | 0.86 | ||
| CLM4_CRUNCEP | [-] | 209. | 208. | 0.587 | 151. | 0.0403 | 7.19 | 0.65 | 0.87 | 0.76 | ||
| CLM4_GSWP3 | [-] | 160. | 159. | 0.457 | 151. | 0.0403 | 1.24 | 0.69 | 0.92 | 0.80 | ||
| CLM5_CRUNCEP | [-] | 152. | 151. | 0.651 | 151. | 0.0403 | 0.381 | 0.80 | 0.87 | 0.84 | ||
| CLM5_GSWP3 | [-] | 129. | 128. | 0.570 | 151. | 0.0403 | -2.41 | 0.76 | 0.78 | 0.77 |
Download Data |
Period Mean (original grids) [Pg] |
Model Period Mean (intersection) [Pg] |
Model Period Mean (complement) [Pg] |
Benchmark Period Mean (intersection) [Pg] |
Benchmark Period Mean (complement) [Pg] |
Bias [kg m-2] |
Bias Score [1] |
Spatial Distribution Score [1] |
Overall Score [1] |
|||
|---|---|---|---|---|---|---|---|---|---|---|---|---|
| Benchmark | [-] | 10.7 | ||||||||||
| CLM4.5_CRUNCEP | [-] | 15.2 | 14.9 | 0.374 | 10.7 | 0.0170 | 0.839 | 0.46 | 0.67 | 0.57 | ||
| CLM4.5_GSWP3 | [-] | 13.0 | 12.8 | 0.311 | 10.7 | 0.0170 | 0.468 | 0.48 | 0.74 | 0.61 | ||
| CLM4_CRUNCEP | [-] | 19.5 | 19.5 | 0.338 | 10.7 | 0.0170 | 1.53 | 0.42 | 0.64 | 0.53 | ||
| CLM4_GSWP3 | [-] | 17.1 | 17.0 | 0.294 | 10.7 | 0.0170 | 1.10 | 0.45 | 0.71 | 0.58 | ||
| CLM5_CRUNCEP | [-] | 21.4 | 21.3 | 0.571 | 10.7 | 0.0170 | 1.85 | 0.51 | 0.81 | 0.66 | ||
| CLM5_GSWP3 | [-] | 21.5 | 21.4 | 0.512 | 10.7 | 0.0170 | 1.83 | 0.52 | 0.81 | 0.66 |
Download Data |
Period Mean (original grids) [Pg] |
Model Period Mean (intersection) [Pg] |
Model Period Mean (complement) [Pg] |
Benchmark Period Mean (intersection) [Pg] |
Benchmark Period Mean (complement) [Pg] |
Bias [kg m-2] |
Bias Score [1] |
Spatial Distribution Score [1] |
Overall Score [1] |
|||
|---|---|---|---|---|---|---|---|---|---|---|---|---|
| Benchmark | [-] | 4.41 | ||||||||||
| CLM4.5_CRUNCEP | [-] | 4.38 | 4.31 | 0.221 | 4.31 | 0.102 | 0.703 | 0.54 | 0.78 | 0.66 | ||
| CLM4.5_GSWP3 | [-] | 5.02 | 4.94 | 0.251 | 4.31 | 0.102 | 0.986 | 0.54 | 0.76 | 0.65 | ||
| CLM4_CRUNCEP | [-] | 3.87 | 3.98 | 0.195 | 4.31 | 0.102 | 0.488 | 0.55 | 0.78 | 0.66 | ||
| CLM4_GSWP3 | [-] | 4.81 | 4.91 | 0.221 | 4.31 | 0.102 | 0.811 | 0.55 | 0.77 | 0.66 | ||
| CLM5_CRUNCEP | [-] | 5.25 | 4.84 | 0.454 | 4.31 | 0.102 | 1.14 | 0.59 | 0.77 | 0.68 | ||
| CLM5_GSWP3 | [-] | 6.25 | 5.78 | 0.493 | 4.31 | 0.102 | 1.41 | 0.59 | 0.80 | 0.70 |
Temporally integrated period mean