Mean State
Download Data |
Period Mean (original grids) [Pg] |
Model Period Mean (intersection) [Pg] |
Model Period Mean (complement) [Pg] |
Benchmark Period Mean (intersection) [Pg] |
Benchmark Period Mean (complement) [Pg] |
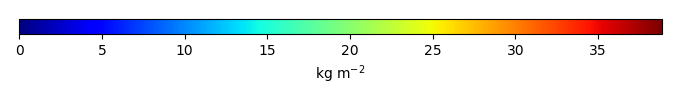
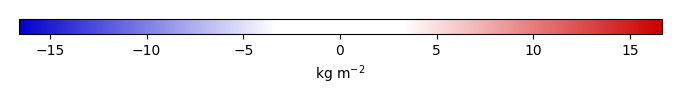
Bias [kg m-2] |
Bias Score [1] |
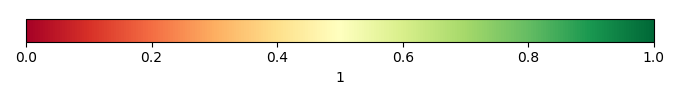
Spatial Distribution Score [1] |
Overall Score [1] |
|||
|---|---|---|---|---|---|---|---|---|---|---|---|---|
| Benchmark | [-] | 30.1 | ||||||||||
| CLM4 | [-] | 582. | 22.9 | 559. | 29.9 | 0.195 | -0.538 | 0.615 | 0.774 | 0.694 | ||
| CLM4.5 | [-] | 560. | 27.8 | 532. | 29.9 | 0.195 | 0.0652 | 0.600 | 0.827 | 0.714 | ||
| CLM5 | [-] | 589. | 29.0 | 560. | 29.9 | 0.195 | 0.319 | 0.597 | 0.839 | 0.718 |
Download Data |
Period Mean (original grids) [Pg] |
Model Period Mean (intersection) [Pg] |
Model Period Mean (complement) [Pg] |
Benchmark Period Mean (intersection) [Pg] |
Benchmark Period Mean (complement) [Pg] |
Bias [kg m-2] |
Bias Score [1] |
Spatial Distribution Score [1] |
Overall Score [1] |
|||
|---|---|---|---|---|---|---|---|---|---|---|---|---|
| Benchmark | [-] | 1.44 | ||||||||||
| CLM4 | [-] | 4.27 | 0.825 | 3.37 | 1.41 | 0.0279 | -0.354 | 0.498 | 0.646 | 0.572 | ||
| CLM4.5 | [-] | 9.20 | 3.15 | 5.91 | 1.41 | 0.0279 | 1.69 | 0.483 | 0.805 | 0.644 | ||
| CLM5 | [-] | 16.4 | 5.84 | 10.4 | 1.41 | 0.0279 | 4.22 | 0.263 | 0.351 | 0.307 |
Download Data |
Period Mean (original grids) [Pg] |
Model Period Mean (intersection) [Pg] |
Model Period Mean (complement) [Pg] |
Benchmark Period Mean (intersection) [Pg] |
Benchmark Period Mean (complement) [Pg] |
Bias [kg m-2] |
Bias Score [1] |
Spatial Distribution Score [1] |
Overall Score [1] |
|||
|---|---|---|---|---|---|---|---|---|---|---|---|---|
| Benchmark | [-] | 0.00649 | ||||||||||
| CLM4 | [-] | 5.39 | 0.00905 | 5.08 | 0.00649 | 0.00778 | 0.433 | 0.0945 | 0.264 | |||
| CLM4.5 | [-] | 11.4 | 0.0173 | 11.1 | 0.00649 | 0.148 | 0.562 | 0.793 | 0.677 | |||
| CLM5 | [-] | 11.9 | 0.0238 | 11.6 | 0.00649 | 0.192 | 0.544 | 0.674 | 0.609 |
Download Data |
Period Mean (original grids) [Pg] |
Model Period Mean (intersection) [Pg] |
Model Period Mean (complement) [Pg] |
Benchmark Period Mean (intersection) [Pg] |
Benchmark Period Mean (complement) [Pg] |
Bias [kg m-2] |
Bias Score [1] |
Spatial Distribution Score [1] |
Overall Score [1] |
|||
|---|---|---|---|---|---|---|---|---|---|---|---|---|
| Benchmark | [-] | 17.4 | ||||||||||
| CLM4 | [-] | 16.4 | 16.0 | 0.277 | 17.3 | 0.0180 | -0.0107 | 0.674 | 0.911 | 0.792 | ||
| CLM4.5 | [-] | 20.4 | 19.9 | 0.343 | 17.3 | 0.0180 | 1.01 | 0.679 | 0.915 | 0.797 | ||
| CLM5 | [-] | 17.8 | 17.3 | 0.314 | 17.3 | 0.0180 | 0.419 | 0.686 | 0.919 | 0.803 |
Download Data |
Period Mean (original grids) [Pg] |
Model Period Mean (intersection) [Pg] |
Model Period Mean (complement) [Pg] |
Benchmark Period Mean (intersection) [Pg] |
Benchmark Period Mean (complement) [Pg] |
Bias [kg m-2] |
Bias Score [1] |
Spatial Distribution Score [1] |
Overall Score [1] |
|||
|---|---|---|---|---|---|---|---|---|---|---|---|---|
| Benchmark | [-] | 1.52 | ||||||||||
| CLM4 | [-] | 25.1 | 1.02 | 24.2 | 1.46 | 0.0621 | -0.890 | 0.476 | 0.682 | 0.579 | ||
| CLM4.5 | [-] | 34.8 | 1.47 | 33.5 | 1.46 | 0.0621 | 1.42 | 0.601 | 0.759 | 0.680 | ||
| CLM5 | [-] | 56.8 | 2.46 | 54.5 | 1.46 | 0.0621 | 7.01 | 0.557 | 0.882 | 0.720 |
Download Data |
Period Mean (original grids) [Pg] |
Model Period Mean (intersection) [Pg] |
Model Period Mean (complement) [Pg] |
Benchmark Period Mean (intersection) [Pg] |
Benchmark Period Mean (complement) [Pg] |
Bias [kg m-2] |
Bias Score [1] |
Spatial Distribution Score [1] |
Overall Score [1] |
|||
|---|---|---|---|---|---|---|---|---|---|---|---|---|
| Benchmark | [-] | 9.78 | ||||||||||
| CLM4 | [-] | 5.11 | 4.98 | 0.169 | 9.71 | 0.0683 | -1.19 | 0.547 | 0.421 | 0.484 | ||
| CLM4.5 | [-] | 3.42 | 3.26 | 0.205 | 9.71 | 0.0683 | -1.67 | 0.475 | 0.261 | 0.368 | ||
| CLM5 | [-] | 3.49 | 3.35 | 0.157 | 9.71 | 0.0683 | -1.61 | 0.492 | 0.568 | 0.530 |
Temporally integrated period mean