Mean State
Download Data |
Period Mean (original grids) [Pg] |
Model Period Mean (intersection) [Pg] |
Model Period Mean (complement) [Pg] |
Benchmark Period Mean (intersection) [Pg] |
Benchmark Period Mean (complement) [Pg] |
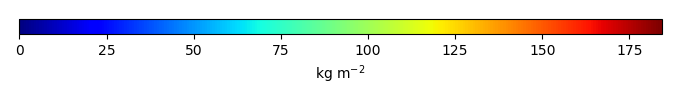
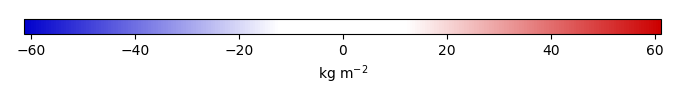
Bias [kg m-2] |
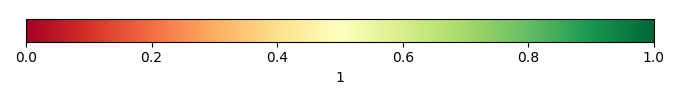
Bias Score [1] |
Spatial Distribution Score [1] |
Overall Score [1] |
|||
|---|---|---|---|---|---|---|---|---|---|---|---|---|
| Benchmark | [-] | 76.5 | ||||||||||
| CLM4 | [-] | 7.93 | 7.01 | 1.05 | 76.1 | 0.362 | -24.3 | 0.408 | 0.198 | 0.303 | ||
| CLM4.5 | [-] | 93.5 | 83.8 | 9.89 | 76.1 | 0.362 | 3.99 | 0.536 | 0.388 | 0.462 | ||
| CLM5 | [-] | 248. | 232. | 16.7 | 76.1 | 0.362 | 57.1 | 0.241 | 0.0749 | 0.158 |
Download Data |
Period Mean (original grids) [Pg] |
Model Period Mean (intersection) [Pg] |
Model Period Mean (complement) [Pg] |
Benchmark Period Mean (intersection) [Pg] |
Benchmark Period Mean (complement) [Pg] |
Bias [kg m-2] |
Bias Score [1] |
Spatial Distribution Score [1] |
Overall Score [1] |
|||
|---|---|---|---|---|---|---|---|---|---|---|---|---|
| Benchmark | [-] | 113. | ||||||||||
| CLM4 | [-] | 85.6 | 45.5 | 38.1 | 113. | 0.00185 | -14.1 | 0.546 | 0.295 | 0.421 | ||
| CLM4.5 | [-] | 156. | 84.4 | 68.2 | 113. | 0.00185 | -6.10 | 0.619 | 0.831 | 0.725 | ||
| CLM5 | [-] | 294. | 194. | 94.1 | 113. | 0.00185 | 16.5 | 0.520 | 0.552 | 0.536 |
Download Data |
Period Mean (original grids) [Pg] |
Model Period Mean (intersection) [Pg] |
Model Period Mean (complement) [Pg] |
Benchmark Period Mean (intersection) [Pg] |
Benchmark Period Mean (complement) [Pg] |
Bias [kg m-2] |
Bias Score [1] |
Spatial Distribution Score [1] |
Overall Score [1] |
|||
|---|---|---|---|---|---|---|---|---|---|---|---|---|
| Benchmark | [-] | 12.2 | ||||||||||
| CLM4 | [-] | 86.3 | 3.55 | 84.7 | 12.2 | -8.82 | 0.499 | 0.783 | 0.641 | |||
| CLM4.5 | [-] | 118. | 6.54 | 115. | 12.2 | -5.53 | 0.602 | 0.854 | 0.728 | |||
| CLM5 | [-] | 122. | 13.3 | 113. | 12.2 | 1.52 | 0.534 | 0.265 | 0.400 |
Download Data |
Period Mean (original grids) [Pg] |
Model Period Mean (intersection) [Pg] |
Model Period Mean (complement) [Pg] |
Benchmark Period Mean (intersection) [Pg] |
Benchmark Period Mean (complement) [Pg] |
Bias [kg m-2] |
Bias Score [1] |
Spatial Distribution Score [1] |
Overall Score [1] |
|||
|---|---|---|---|---|---|---|---|---|---|---|---|---|
| Benchmark | [-] | 97.3 | ||||||||||
| CLM4 | [-] | 5.53 | 5.24 | 0.729 | 97.2 | 0.0996 | -29.1 | 0.391 | 0.111 | 0.251 | ||
| CLM4.5 | [-] | 95.5 | 87.9 | 8.96 | 97.2 | 0.0996 | -2.82 | 0.620 | 0.628 | 0.624 | ||
| CLM5 | [-] | 254. | 242. | 14.9 | 97.2 | 0.0996 | 46.5 | 0.406 | 0.104 | 0.255 |
Download Data |
Period Mean (original grids) [Pg] |
Model Period Mean (intersection) [Pg] |
Model Period Mean (complement) [Pg] |
Benchmark Period Mean (intersection) [Pg] |
Benchmark Period Mean (complement) [Pg] |
Bias [kg m-2] |
Bias Score [1] |
Spatial Distribution Score [1] |
Overall Score [1] |
|||
|---|---|---|---|---|---|---|---|---|---|---|---|---|
| Benchmark | [-] | 5.12 | ||||||||||
| CLM4 | [-] | 24.8 | 0.594 | 23.8 | 5.12 | -16.8 | 0.413 | 0.0760 | 0.245 | |||
| CLM4.5 | [-] | 57.3 | 2.92 | 53.6 | 5.12 | -8.21 | 0.593 | 0.438 | 0.516 | |||
| CLM5 | [-] | 67.9 | 4.90 | 62.0 | 5.12 | -0.930 | 0.698 | 0.894 | 0.796 |
Download Data |
Period Mean (original grids) [Pg] |
Model Period Mean (intersection) [Pg] |
Model Period Mean (complement) [Pg] |
Benchmark Period Mean (intersection) [Pg] |
Benchmark Period Mean (complement) [Pg] |
Bias [kg m-2] |
Bias Score [1] |
Spatial Distribution Score [1] |
Overall Score [1] |
|||
|---|---|---|---|---|---|---|---|---|---|---|---|---|
| Benchmark | [-] | 475. | ||||||||||
| CLM4 | [-] | 614. | 99.9 | 514. | 474. | 1.51 | -16.4 | 0.456 | 0.214 | 0.335 | ||
| CLM4.5 | [-] | 1.27e+03 | 418. | 853. | 474. | 1.51 | -2.02 | 0.572 | 0.772 | 0.672 | ||
| CLM5 | [-] | 1.92e+03 | 1.08e+03 | 836. | 474. | 1.51 | 27.6 | 0.429 | 0.188 | 0.308 |
Download Data |
Period Mean (original grids) [Pg] |
Model Period Mean (intersection) [Pg] |
Model Period Mean (complement) [Pg] |
Benchmark Period Mean (intersection) [Pg] |
Benchmark Period Mean (complement) [Pg] |
Bias [kg m-2] |
Bias Score [1] |
Spatial Distribution Score [1] |
Overall Score [1] |
|||
|---|---|---|---|---|---|---|---|---|---|---|---|---|
| Benchmark | [-] | 116. | ||||||||||
| CLM4 | [-] | 23.0 | 21.4 | 1.40 | 116. | 0.373 | -15.4 | 0.437 | 0.148 | 0.292 | ||
| CLM4.5 | [-] | 126. | 117. | 8.33 | 116. | 0.373 | 1.37 | 0.525 | 0.721 | 0.623 | ||
| CLM5 | [-] | 326. | 313. | 14.0 | 116. | 0.373 | 34.5 | 0.413 | 0.146 | 0.279 |
Download Data |
Period Mean (original grids) [Pg] |
Model Period Mean (intersection) [Pg] |
Model Period Mean (complement) [Pg] |
Benchmark Period Mean (intersection) [Pg] |
Benchmark Period Mean (complement) [Pg] |
Bias [kg m-2] |
Bias Score [1] |
Spatial Distribution Score [1] |
Overall Score [1] |
|||
|---|---|---|---|---|---|---|---|---|---|---|---|---|
| Benchmark | [-] | 0.0131 | ||||||||||
| CLM4 | [-] | 33.2 | 0.0213 | 32.7 | 0.0131 | 3.77 | 0.529 | 4.04e-23 | 0.264 | |||
| CLM4.5 | [-] | 53.3 | 0.0389 | 52.5 | 0.0131 | 11.6 | 0.139 | 6.24e-23 | 0.0697 | |||
| CLM5 | [-] | 42.8 | 0.0285 | 42.1 | 0.0131 | 6.98 | 0.306 | 3.26e-20 | 0.153 |
Download Data |
Period Mean (original grids) [Pg] |
Model Period Mean (intersection) [Pg] |
Model Period Mean (complement) [Pg] |
Benchmark Period Mean (intersection) [Pg] |
Benchmark Period Mean (complement) [Pg] |
Bias [kg m-2] |
Bias Score [1] |
Spatial Distribution Score [1] |
Overall Score [1] |
|||
|---|---|---|---|---|---|---|---|---|---|---|---|---|
| Benchmark | [-] | 46.1 | ||||||||||
| CLM4 | [-] | 41.7 | 16.2 | 25.7 | 46.1 | 0.00725 | -14.4 | 0.507 | 0.126 | 0.317 | ||
| CLM4.5 | [-] | 75.3 | 32.9 | 42.8 | 46.1 | 0.00725 | -6.41 | 0.557 | 0.334 | 0.445 | ||
| CLM5 | [-] | 145. | 81.7 | 61.9 | 46.1 | 0.00725 | 16.6 | 0.544 | 0.683 | 0.614 |
Download Data |
Period Mean (original grids) [Pg] |
Model Period Mean (intersection) [Pg] |
Model Period Mean (complement) [Pg] |
Benchmark Period Mean (intersection) [Pg] |
Benchmark Period Mean (complement) [Pg] |
Bias [kg m-2] |
Bias Score [1] |
Spatial Distribution Score [1] |
Overall Score [1] |
|||
|---|---|---|---|---|---|---|---|---|---|---|---|---|
| Benchmark | [-] | 0.232 | ||||||||||
| CLM4 | [-] | 11.8 | 0.309 | 11.9 | 0.232 | 1.08 | 0.493 | 0.453 | 0.473 | |||
| CLM4.5 | [-] | 14.5 | 0.310 | 14.9 | 0.232 | 1.08 | 0.493 | 0.720 | 0.607 | |||
| CLM5 | [-] | 12.9 | 0.398 | 13.2 | 0.232 | 1.94 | 0.597 | 0.713 | 0.655 |
Temporally integrated period mean