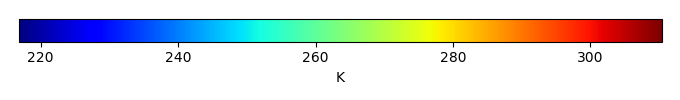
Mean State
Download Data |
Period Mean (original grids) [K] |
Model Period Mean (intersection) [K] |
Model Period Mean (complement) [K] |
Benchmark Period Mean (intersection) [K] |
Benchmark Period Mean (complement) [K] |
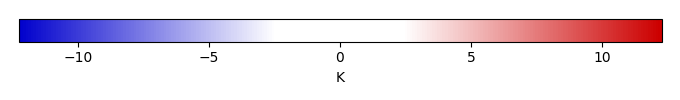
Bias [K] |
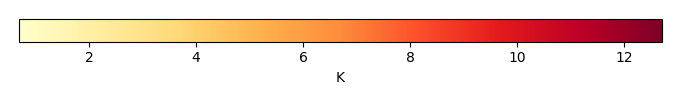
RMSE [K] |
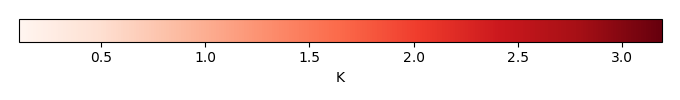
Phase Shift [months] |
Bias Score [1] |
RMSE Score [1] |
Seasonal Cycle Score [1] |
Spatial Distribution Score [1] |
Interannual Variability Score [1] |
Overall Score [1] |
|||
|---|---|---|---|---|---|---|---|---|---|---|---|---|---|---|---|---|---|
| Benchmark | [-] | 304. | |||||||||||||||
| CLM4 | [-] | 303. | 303. | 303. | 304. | 304. | -0.340 | 1.41 | 0.720 | 0.614 | 0.506 | 0.898 | 0.992 | 0.758 | 0.712 | ||
| CLM4.5 | [-] | 303. | 303. | 304. | 304. | 304. | -0.264 | 1.34 | 0.684 | 0.644 | 0.517 | 0.906 | 0.997 | 0.765 | 0.724 | ||
| CLM5 | [-] | 303. | 303. | 304. | 304. | 304. | -0.242 | 1.35 | 0.659 | 0.644 | 0.514 | 0.909 | 0.996 | 0.759 | 0.723 |
Download Data |
Period Mean (original grids) [K] |
Model Period Mean (intersection) [K] |
Model Period Mean (complement) [K] |
Benchmark Period Mean (intersection) [K] |
Benchmark Period Mean (complement) [K] |
Bias [K] |
RMSE [K] |
Phase Shift [months] |
Bias Score [1] |
RMSE Score [1] |
Seasonal Cycle Score [1] |
Spatial Distribution Score [1] |
Interannual Variability Score [1] |
Overall Score [1] |
|||
|---|---|---|---|---|---|---|---|---|---|---|---|---|---|---|---|---|---|
| Benchmark | [-] | 307. | |||||||||||||||
| CLM4 | [-] | 307. | 307. | 305. | 307. | 305. | 0.335 | 1.92 | 0.237 | 0.732 | 0.572 | 0.982 | 0.994 | 0.690 | 0.757 | ||
| CLM4.5 | [-] | 307. | 307. | 305. | 307. | 305. | 0.274 | 1.89 | 0.220 | 0.733 | 0.579 | 0.983 | 0.995 | 0.696 | 0.761 | ||
| CLM5 | [-] | 307. | 307. | 305. | 307. | 305. | 0.336 | 1.88 | 0.219 | 0.734 | 0.580 | 0.983 | 0.995 | 0.698 | 0.762 |
Download Data |
Period Mean (original grids) [K] |
Model Period Mean (intersection) [K] |
Model Period Mean (complement) [K] |
Benchmark Period Mean (intersection) [K] |
Benchmark Period Mean (complement) [K] |
Bias [K] |
RMSE [K] |
Phase Shift [months] |
Bias Score [1] |
RMSE Score [1] |
Seasonal Cycle Score [1] |
Spatial Distribution Score [1] |
Interannual Variability Score [1] |
Overall Score [1] |
|||
|---|---|---|---|---|---|---|---|---|---|---|---|---|---|---|---|---|---|
| Benchmark | [-] | 301. | |||||||||||||||
| CLM4 | [-] | 302. | 302. | 299. | 301. | 302. | 0.669 | 1.90 | 0.680 | 0.606 | 0.570 | 0.914 | 0.997 | 0.860 | 0.753 | ||
| CLM4.5 | [-] | 302. | 302. | 299. | 301. | 302. | 0.625 | 1.84 | 0.655 | 0.612 | 0.580 | 0.918 | 0.998 | 0.861 | 0.758 | ||
| CLM5 | [-] | 302. | 302. | 300. | 301. | 302. | 0.673 | 1.84 | 0.633 | 0.608 | 0.587 | 0.922 | 0.998 | 0.861 | 0.760 |
Download Data |
Period Mean (original grids) [K] |
Model Period Mean (intersection) [K] |
Model Period Mean (complement) [K] |
Benchmark Period Mean (intersection) [K] |
Benchmark Period Mean (complement) [K] |
Bias [K] |
RMSE [K] |
Phase Shift [months] |
Bias Score [1] |
RMSE Score [1] |
Seasonal Cycle Score [1] |
Spatial Distribution Score [1] |
Interannual Variability Score [1] |
Overall Score [1] |
|||
|---|---|---|---|---|---|---|---|---|---|---|---|---|---|---|---|---|---|
| Benchmark | [-] | 266. | |||||||||||||||
| CLM4 | [-] | 262. | 262. | 265. | 266. | 269. | -3.44 | 4.30 | 0.0590 | 0.809 | 0.857 | 0.996 | 0.978 | 0.876 | 0.895 | ||
| CLM4.5 | [-] | 262. | 262. | 265. | 266. | 269. | -3.10 | 3.97 | 0.0469 | 0.826 | 0.863 | 0.997 | 0.976 | 0.871 | 0.899 | ||
| CLM5 | [-] | 263. | 263. | 266. | 266. | 269. | -2.12 | 2.84 | 0.0467 | 0.873 | 0.898 | 0.997 | 0.991 | 0.879 | 0.923 |
Download Data |
Period Mean (original grids) [K] |
Model Period Mean (intersection) [K] |
Model Period Mean (complement) [K] |
Benchmark Period Mean (intersection) [K] |
Benchmark Period Mean (complement) [K] |
Bias [K] |
RMSE [K] |
Phase Shift [months] |
Bias Score [1] |
RMSE Score [1] |
Seasonal Cycle Score [1] |
Spatial Distribution Score [1] |
Interannual Variability Score [1] |
Overall Score [1] |
|||
|---|---|---|---|---|---|---|---|---|---|---|---|---|---|---|---|---|---|
| Benchmark | [-] | 304. | |||||||||||||||
| CLM4 | [-] | 301. | 301. | 301. | 304. | 303. | -2.64 | 2.72 | 1.54 | 0.0782 | 0.485 | 0.760 | 0.874 | 0.757 | 0.573 | ||
| CLM4.5 | [-] | 301. | 301. | 302. | 304. | 303. | -2.42 | 2.51 | 1.57 | 0.101 | 0.481 | 0.753 | 0.884 | 0.763 | 0.577 | ||
| CLM5 | [-] | 301. | 301. | 301. | 304. | 303. | -2.47 | 2.55 | 1.46 | 0.0953 | 0.477 | 0.773 | 0.878 | 0.765 | 0.578 |
Download Data |
Period Mean (original grids) [K] |
Model Period Mean (intersection) [K] |
Model Period Mean (complement) [K] |
Benchmark Period Mean (intersection) [K] |
Benchmark Period Mean (complement) [K] |
Bias [K] |
RMSE [K] |
Phase Shift [months] |
Bias Score [1] |
RMSE Score [1] |
Seasonal Cycle Score [1] |
Spatial Distribution Score [1] |
Interannual Variability Score [1] |
Overall Score [1] |
|||
|---|---|---|---|---|---|---|---|---|---|---|---|---|---|---|---|---|---|
| Benchmark | [-] | 276. | |||||||||||||||
| CLM4 | [-] | 274. | 274. | 276. | 276. | 278. | -2.11 | 2.72 | 0.00659 | 0.868 | 0.897 | 1.00 | 0.986 | 0.964 | 0.935 | ||
| CLM4.5 | [-] | 274. | 274. | 276. | 276. | 278. | -2.34 | 2.91 | 0.00705 | 0.857 | 0.896 | 1.00 | 0.973 | 0.966 | 0.931 | ||
| CLM5 | [-] | 274. | 274. | 276. | 276. | 278. | -1.78 | 2.21 | 0.00705 | 0.887 | 0.922 | 1.00 | 0.993 | 0.967 | 0.949 |
Download Data |
Period Mean (original grids) [K] |
Model Period Mean (intersection) [K] |
Model Period Mean (complement) [K] |
Benchmark Period Mean (intersection) [K] |
Benchmark Period Mean (complement) [K] |
Bias [K] |
RMSE [K] |
Phase Shift [months] |
Bias Score [1] |
RMSE Score [1] |
Seasonal Cycle Score [1] |
Spatial Distribution Score [1] |
Interannual Variability Score [1] |
Overall Score [1] |
|||
|---|---|---|---|---|---|---|---|---|---|---|---|---|---|---|---|---|---|
| Benchmark | [-] | 286. | |||||||||||||||
| CLM4 | [-] | 285. | 285. | 290. | 286. | 289. | -0.390 | 2.03 | 0.0882 | 0.867 | 0.883 | 0.993 | 0.992 | 0.931 | 0.925 | ||
| CLM4.5 | [-] | 285. | 285. | 290. | 286. | 289. | -0.486 | 2.08 | 0.0875 | 0.864 | 0.881 | 0.993 | 0.992 | 0.934 | 0.924 | ||
| CLM5 | [-] | 285. | 285. | 290. | 286. | 289. | -0.391 | 1.96 | 0.0896 | 0.869 | 0.888 | 0.993 | 0.993 | 0.937 | 0.928 |
Download Data |
Period Mean (original grids) [K] |
Model Period Mean (intersection) [K] |
Model Period Mean (complement) [K] |
Benchmark Period Mean (intersection) [K] |
Benchmark Period Mean (complement) [K] |
Bias [K] |
RMSE [K] |
Phase Shift [months] |
Bias Score [1] |
RMSE Score [1] |
Seasonal Cycle Score [1] |
Spatial Distribution Score [1] |
Interannual Variability Score [1] |
Overall Score [1] |
|||
|---|---|---|---|---|---|---|---|---|---|---|---|---|---|---|---|---|---|
| Benchmark | [-] | 302. | |||||||||||||||
| CLM4 | [-] | 302. | 302. | 302. | 302. | 304. | -0.259 | 1.77 | 0.260 | 0.693 | 0.734 | 0.974 | 0.998 | 0.818 | 0.825 | ||
| CLM4.5 | [-] | 302. | 302. | 303. | 302. | 304. | -0.228 | 1.74 | 0.253 | 0.697 | 0.738 | 0.974 | 0.999 | 0.823 | 0.828 | ||
| CLM5 | [-] | 302. | 302. | 303. | 302. | 304. | -0.220 | 1.71 | 0.251 | 0.698 | 0.745 | 0.976 | 0.999 | 0.831 | 0.832 |
Download Data |
Period Mean (original grids) [K] |
Model Period Mean (intersection) [K] |
Model Period Mean (complement) [K] |
Benchmark Period Mean (intersection) [K] |
Benchmark Period Mean (complement) [K] |
Bias [K] |
RMSE [K] |
Phase Shift [months] |
Bias Score [1] |
RMSE Score [1] |
Seasonal Cycle Score [1] |
Spatial Distribution Score [1] |
Interannual Variability Score [1] |
Overall Score [1] |
|||
|---|---|---|---|---|---|---|---|---|---|---|---|---|---|---|---|---|---|
| Benchmark | [-] | 268. | |||||||||||||||
| CLM4 | [-] | 264. | 264. | 265. | 268. | 268. | -3.84 | 4.73 | 0.0271 | 0.781 | 0.838 | 0.998 | 0.981 | 0.912 | 0.892 | ||
| CLM4.5 | [-] | 264. | 264. | 264. | 268. | 268. | -3.69 | 4.51 | 0.0973 | 0.789 | 0.847 | 0.993 | 0.982 | 0.909 | 0.894 | ||
| CLM5 | [-] | 265. | 265. | 266. | 268. | 268. | -2.30 | 2.90 | 0.0405 | 0.862 | 0.895 | 0.997 | 0.994 | 0.910 | 0.926 |
Download Data |
Period Mean (original grids) [K] |
Model Period Mean (intersection) [K] |
Model Period Mean (complement) [K] |
Benchmark Period Mean (intersection) [K] |
Benchmark Period Mean (complement) [K] |
Bias [K] |
RMSE [K] |
Phase Shift [months] |
Bias Score [1] |
RMSE Score [1] |
Seasonal Cycle Score [1] |
Spatial Distribution Score [1] |
Interannual Variability Score [1] |
Overall Score [1] |
|||
|---|---|---|---|---|---|---|---|---|---|---|---|---|---|---|---|---|---|
| Benchmark | [-] | 301. | |||||||||||||||
| CLM4 | [-] | 302. | 302. | 296. | 301. | 299. | 0.237 | 1.79 | 0.155 | 0.741 | 0.823 | 0.989 | 0.982 | 0.869 | 0.871 | ||
| CLM4.5 | [-] | 302. | 302. | 296. | 301. | 299. | 0.207 | 1.76 | 0.150 | 0.744 | 0.824 | 0.989 | 0.984 | 0.874 | 0.873 | ||
| CLM5 | [-] | 302. | 302. | 296. | 301. | 299. | 0.241 | 1.78 | 0.146 | 0.741 | 0.824 | 0.989 | 0.983 | 0.879 | 0.873 |
Download Data |
Period Mean (original grids) [K] |
Model Period Mean (intersection) [K] |
Model Period Mean (complement) [K] |
Benchmark Period Mean (intersection) [K] |
Benchmark Period Mean (complement) [K] |
Bias [K] |
RMSE [K] |
Phase Shift [months] |
Bias Score [1] |
RMSE Score [1] |
Seasonal Cycle Score [1] |
Spatial Distribution Score [1] |
Interannual Variability Score [1] |
Overall Score [1] |
|||
|---|---|---|---|---|---|---|---|---|---|---|---|---|---|---|---|---|---|
| Benchmark | [-] | 286. | |||||||||||||||
| CLM4 | [-] | 284. | 284. | 286. | 286. | 289. | -1.35 | 2.04 | 0.272 | 0.809 | 0.870 | 0.982 | 0.977 | 0.914 | 0.904 | ||
| CLM4.5 | [-] | 284. | 284. | 286. | 286. | 289. | -1.31 | 2.01 | 0.265 | 0.812 | 0.870 | 0.982 | 0.986 | 0.918 | 0.906 | ||
| CLM5 | [-] | 284. | 284. | 286. | 286. | 289. | -1.14 | 1.77 | 0.276 | 0.825 | 0.889 | 0.981 | 0.995 | 0.924 | 0.917 |
Download Data |
Period Mean (original grids) [K] |
Model Period Mean (intersection) [K] |
Model Period Mean (complement) [K] |
Benchmark Period Mean (intersection) [K] |
Benchmark Period Mean (complement) [K] |
Bias [K] |
RMSE [K] |
Phase Shift [months] |
Bias Score [1] |
RMSE Score [1] |
Seasonal Cycle Score [1] |
Spatial Distribution Score [1] |
Interannual Variability Score [1] |
Overall Score [1] |
|||
|---|---|---|---|---|---|---|---|---|---|---|---|---|---|---|---|---|---|
| Benchmark | [-] | 292. | |||||||||||||||
| CLM4 | [-] | 286. | 291. | 246. | 292. | 295. | -0.805 | 2.39 | 0.288 | 0.717 | 0.756 | 0.965 | 0.987 | 0.861 | 0.841 | ||
| CLM4.5 | [-] | 286. | 291. | 247. | 292. | 295. | -0.821 | 2.36 | 0.285 | 0.725 | 0.758 | 0.966 | 0.987 | 0.864 | 0.843 | ||
| CLM5 | [-] | 287. | 292. | 247. | 292. | 295. | -0.595 | 2.12 | 0.279 | 0.735 | 0.769 | 0.967 | 0.993 | 0.866 | 0.850 |
Download Data |
Period Mean (original grids) [K] |
Model Period Mean (intersection) [K] |
Model Period Mean (complement) [K] |
Benchmark Period Mean (intersection) [K] |
Benchmark Period Mean (complement) [K] |
Bias [K] |
RMSE [K] |
Phase Shift [months] |
Bias Score [1] |
RMSE Score [1] |
Seasonal Cycle Score [1] |
Spatial Distribution Score [1] |
Interannual Variability Score [1] |
Overall Score [1] |
|||
|---|---|---|---|---|---|---|---|---|---|---|---|---|---|---|---|---|---|
| Benchmark | [-] | 303. | |||||||||||||||
| CLM4 | [-] | 304. | 304. | 301. | 303. | 303. | 1.53 | 2.40 | 0.204 | 0.741 | 0.820 | 0.983 | 0.986 | 0.817 | 0.861 | ||
| CLM4.5 | [-] | 304. | 304. | 301. | 303. | 303. | 1.44 | 2.32 | 0.202 | 0.750 | 0.822 | 0.983 | 0.988 | 0.822 | 0.865 | ||
| CLM5 | [-] | 304. | 304. | 301. | 303. | 303. | 1.50 | 2.34 | 0.202 | 0.746 | 0.823 | 0.983 | 0.988 | 0.826 | 0.865 |
Download Data |
Period Mean (original grids) [K] |
Model Period Mean (intersection) [K] |
Model Period Mean (complement) [K] |
Benchmark Period Mean (intersection) [K] |
Benchmark Period Mean (complement) [K] |
Bias [K] |
RMSE [K] |
Phase Shift [months] |
Bias Score [1] |
RMSE Score [1] |
Seasonal Cycle Score [1] |
Spatial Distribution Score [1] |
Interannual Variability Score [1] |
Overall Score [1] |
|||
|---|---|---|---|---|---|---|---|---|---|---|---|---|---|---|---|---|---|
| Benchmark | [-] | 268. | |||||||||||||||
| CLM4 | [-] | 266. | 266. | 262. | 268. | 270. | -2.71 | 3.85 | 0.0300 | 0.814 | 0.821 | 0.998 | 0.992 | 0.888 | 0.889 | ||
| CLM4.5 | [-] | 266. | 266. | 262. | 268. | 270. | -2.69 | 3.77 | 0.0384 | 0.814 | 0.825 | 0.997 | 0.993 | 0.884 | 0.890 | ||
| CLM5 | [-] | 267. | 267. | 264. | 268. | 270. | -1.71 | 2.54 | 0.0217 | 0.874 | 0.876 | 0.999 | 0.999 | 0.890 | 0.919 |
Download Data |
Period Mean (original grids) [K] |
Model Period Mean (intersection) [K] |
Model Period Mean (complement) [K] |
Benchmark Period Mean (intersection) [K] |
Benchmark Period Mean (complement) [K] |
Bias [K] |
RMSE [K] |
Phase Shift [months] |
Bias Score [1] |
RMSE Score [1] |
Seasonal Cycle Score [1] |
Spatial Distribution Score [1] |
Interannual Variability Score [1] |
Overall Score [1] |
|||
|---|---|---|---|---|---|---|---|---|---|---|---|---|---|---|---|---|---|
| Benchmark | [-] | 302. | |||||||||||||||
| CLM4 | [-] | 299. | 299. | 301. | 302. | 303. | -2.39 | 2.85 | 0.282 | 0.420 | 0.698 | 0.974 | 1.00 | 0.868 | 0.776 | ||
| CLM4.5 | [-] | 299. | 299. | 301. | 302. | 303. | -2.37 | 2.83 | 0.276 | 0.422 | 0.699 | 0.974 | 1.00 | 0.867 | 0.777 | ||
| CLM5 | [-] | 299. | 299. | 301. | 302. | 303. | -2.35 | 2.82 | 0.282 | 0.424 | 0.697 | 0.973 | 1.00 | 0.864 | 0.776 |
Download Data |
Period Mean (original grids) [K] |
Model Period Mean (intersection) [K] |
Model Period Mean (complement) [K] |
Benchmark Period Mean (intersection) [K] |
Benchmark Period Mean (complement) [K] |
Bias [K] |
RMSE [K] |
Phase Shift [months] |
Bias Score [1] |
RMSE Score [1] |
Seasonal Cycle Score [1] |
Spatial Distribution Score [1] |
Interannual Variability Score [1] |
Overall Score [1] |
|||
|---|---|---|---|---|---|---|---|---|---|---|---|---|---|---|---|---|---|
| Benchmark | [-] | 292. | |||||||||||||||
| CLM4 | [-] | 290. | 290. | 296. | 292. | 297. | -1.81 | 2.03 | 0.0839 | 0.810 | 0.908 | 0.994 | 1.00 | 0.936 | 0.926 | ||
| CLM4.5 | [-] | 290. | 290. | 296. | 292. | 297. | -1.90 | 2.13 | 0.0673 | 0.803 | 0.903 | 0.995 | 1.00 | 0.935 | 0.923 | ||
| CLM5 | [-] | 290. | 290. | 296. | 292. | 297. | -1.79 | 2.01 | 0.0688 | 0.812 | 0.909 | 0.995 | 1.00 | 0.931 | 0.926 |
Download Data |
Period Mean (original grids) [K] |
Model Period Mean (intersection) [K] |
Model Period Mean (complement) [K] |
Benchmark Period Mean (intersection) [K] |
Benchmark Period Mean (complement) [K] |
Bias [K] |
RMSE [K] |
Phase Shift [months] |
Bias Score [1] |
RMSE Score [1] |
Seasonal Cycle Score [1] |
Spatial Distribution Score [1] |
Interannual Variability Score [1] |
Overall Score [1] |
|||
|---|---|---|---|---|---|---|---|---|---|---|---|---|---|---|---|---|---|
| Benchmark | [-] | 279. | |||||||||||||||
| CLM4 | [-] | 277. | 277. | 279. | 279. | 282. | -1.87 | 2.39 | 0.0401 | 0.847 | 0.890 | 0.997 | 0.991 | 0.942 | 0.926 | ||
| CLM4.5 | [-] | 277. | 277. | 279. | 279. | 282. | -1.96 | 2.45 | 0.0359 | 0.840 | 0.891 | 0.998 | 0.991 | 0.939 | 0.925 | ||
| CLM5 | [-] | 278. | 278. | 279. | 279. | 282. | -1.67 | 2.10 | 0.0391 | 0.859 | 0.907 | 0.997 | 0.998 | 0.941 | 0.935 |
Download Data |
Period Mean (original grids) [K] |
Model Period Mean (intersection) [K] |
Model Period Mean (complement) [K] |
Benchmark Period Mean (intersection) [K] |
Benchmark Period Mean (complement) [K] |
Bias [K] |
RMSE [K] |
Phase Shift [months] |
Bias Score [1] |
RMSE Score [1] |
Seasonal Cycle Score [1] |
Spatial Distribution Score [1] |
Interannual Variability Score [1] |
Overall Score [1] |
|||
|---|---|---|---|---|---|---|---|---|---|---|---|---|---|---|---|---|---|
| Benchmark | [-] | 291. | |||||||||||||||
| CLM4 | [-] | 289. | 290. | 291. | 291. | 292. | -1.21 | 2.25 | 0.0518 | 0.837 | 0.852 | 0.996 | 0.996 | 0.931 | 0.911 | ||
| CLM4.5 | [-] | 289. | 289. | 291. | 291. | 292. | -1.34 | 2.37 | 0.0514 | 0.830 | 0.847 | 0.996 | 0.994 | 0.934 | 0.908 | ||
| CLM5 | [-] | 290. | 290. | 291. | 291. | 292. | -1.15 | 2.16 | 0.0515 | 0.842 | 0.858 | 0.996 | 0.997 | 0.934 | 0.914 |
Download Data |
Period Mean (original grids) [K] |
Model Period Mean (intersection) [K] |
Model Period Mean (complement) [K] |
Benchmark Period Mean (intersection) [K] |
Benchmark Period Mean (complement) [K] |
Bias [K] |
RMSE [K] |
Phase Shift [months] |
Bias Score [1] |
RMSE Score [1] |
Seasonal Cycle Score [1] |
Spatial Distribution Score [1] |
Interannual Variability Score [1] |
Overall Score [1] |
|||
|---|---|---|---|---|---|---|---|---|---|---|---|---|---|---|---|---|---|
| Benchmark | [-] | 304. | |||||||||||||||
| CLM4 | [-] | 303. | 303. | 302. | 304. | 304. | -0.885 | 1.46 | 0.688 | 0.476 | 0.531 | 0.904 | 0.986 | 0.835 | 0.711 | ||
| CLM4.5 | [-] | 303. | 303. | 302. | 304. | 304. | -0.652 | 1.34 | 0.718 | 0.562 | 0.528 | 0.901 | 0.985 | 0.839 | 0.724 | ||
| CLM5 | [-] | 303. | 303. | 302. | 304. | 304. | -0.697 | 1.38 | 0.721 | 0.537 | 0.523 | 0.901 | 0.985 | 0.834 | 0.717 |
Download Data |
Period Mean (original grids) [K] |
Model Period Mean (intersection) [K] |
Model Period Mean (complement) [K] |
Benchmark Period Mean (intersection) [K] |
Benchmark Period Mean (complement) [K] |
Bias [K] |
RMSE [K] |
Phase Shift [months] |
Bias Score [1] |
RMSE Score [1] |
Seasonal Cycle Score [1] |
Spatial Distribution Score [1] |
Interannual Variability Score [1] |
Overall Score [1] |
|||
|---|---|---|---|---|---|---|---|---|---|---|---|---|---|---|---|---|---|
| Benchmark | [-] | 301. | |||||||||||||||
| CLM4 | [-] | 301. | 301. | 298. | 301. | 297. | -0.0691 | 1.51 | 0.764 | 0.719 | 0.606 | 0.887 | 0.999 | 0.790 | 0.768 | ||
| CLM4.5 | [-] | 301. | 301. | 298. | 301. | 297. | -0.0687 | 1.46 | 0.745 | 0.723 | 0.615 | 0.890 | 1.00 | 0.798 | 0.773 | ||
| CLM5 | [-] | 301. | 301. | 298. | 301. | 297. | -0.0178 | 1.47 | 0.747 | 0.721 | 0.617 | 0.890 | 0.999 | 0.799 | 0.774 |
Download Data |
Period Mean (original grids) [K] |
Model Period Mean (intersection) [K] |
Model Period Mean (complement) [K] |
Benchmark Period Mean (intersection) [K] |
Benchmark Period Mean (complement) [K] |
Bias [K] |
RMSE [K] |
Phase Shift [months] |
Bias Score [1] |
RMSE Score [1] |
Seasonal Cycle Score [1] |
Spatial Distribution Score [1] |
Interannual Variability Score [1] |
Overall Score [1] |
|||
|---|---|---|---|---|---|---|---|---|---|---|---|---|---|---|---|---|---|
| Benchmark | [-] | 290. | |||||||||||||||
| CLM4 | [-] | 290. | 290. | 291. | 290. | 289. | -0.581 | 2.35 | 0.384 | 0.580 | 0.698 | 0.951 | 0.996 | 0.859 | 0.797 | ||
| CLM4.5 | [-] | 290. | 290. | 291. | 290. | 289. | -0.651 | 2.39 | 0.387 | 0.576 | 0.695 | 0.951 | 0.995 | 0.860 | 0.795 | ||
| CLM5 | [-] | 290. | 290. | 291. | 290. | 289. | -0.549 | 2.32 | 0.382 | 0.582 | 0.703 | 0.950 | 0.997 | 0.865 | 0.800 |
Temporally integrated period mean