Mean State
Download Data |
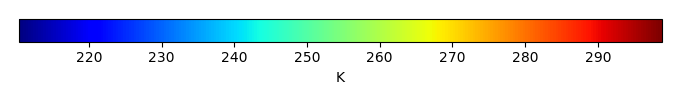
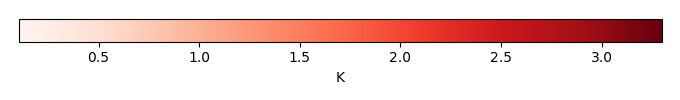
Period Mean (original grids) [K] |
Model Period Mean (intersection) [K] |
Model Period Mean (complement) [K] |
Benchmark Period Mean (intersection) [K] |
Benchmark Period Mean (complement) [K] |
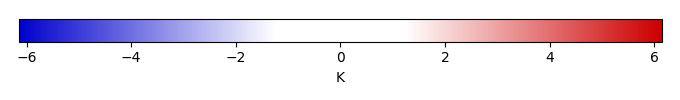
Bias [K] |
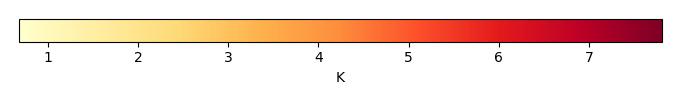
RMSE [K] |
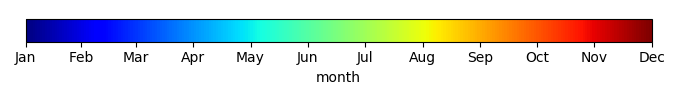
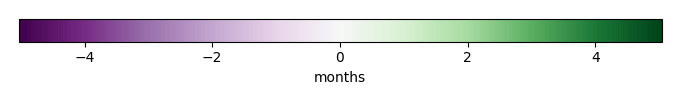
Phase Shift [months] |
Bias Score [1] |
RMSE Score [1] |
Seasonal Cycle Score [1] |
Spatial Distribution Score [1] |
Interannual Variability Score [1] |
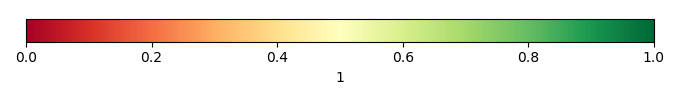
Overall Score [1] |
|||
|---|---|---|---|---|---|---|---|---|---|---|---|---|---|---|---|---|---|
| Benchmark | [-] | 293. | |||||||||||||||
| CLM4 | [-] | 294. | 294. | 298. | 293. | 296. | 1.20 | 1.74 | 0.854 | 0.428 | 0.487 | 0.895 | 0.962 | 0.796 | 0.676 | ||
| CLM4.5 | [-] | 294. | 294. | 298. | 293. | 296. | 1.59 | 2.00 | 0.875 | 0.335 | 0.489 | 0.895 | 0.982 | 0.803 | 0.666 | ||
| CLM5 | [-] | 295. | 295. | 298. | 293. | 296. | 2.11 | 2.33 | 0.941 | 0.192 | 0.491 | 0.882 | 1.00 | 0.802 | 0.643 |
Download Data |
Period Mean (original grids) [K] |
Model Period Mean (intersection) [K] |
Model Period Mean (complement) [K] |
Benchmark Period Mean (intersection) [K] |
Benchmark Period Mean (complement) [K] |
Bias [K] |
RMSE [K] |
Phase Shift [months] |
Bias Score [1] |
RMSE Score [1] |
Seasonal Cycle Score [1] |
Spatial Distribution Score [1] |
Interannual Variability Score [1] |
Overall Score [1] |
|||
|---|---|---|---|---|---|---|---|---|---|---|---|---|---|---|---|---|---|
| Benchmark | [-] | 293. | |||||||||||||||
| CLM4 | [-] | 294. | 294. | 297. | 293. | 294. | 1.20 | 2.23 | 0.412 | 0.585 | 0.611 | 0.957 | 0.994 | 0.907 | 0.778 | ||
| CLM4.5 | [-] | 295. | 295. | 297. | 293. | 294. | 1.71 | 2.58 | 0.319 | 0.498 | 0.618 | 0.973 | 0.986 | 0.901 | 0.766 | ||
| CLM5 | [-] | 295. | 295. | 297. | 293. | 294. | 2.04 | 2.64 | 0.306 | 0.479 | 0.628 | 0.972 | 0.961 | 0.891 | 0.760 |
Download Data |
Period Mean (original grids) [K] |
Model Period Mean (intersection) [K] |
Model Period Mean (complement) [K] |
Benchmark Period Mean (intersection) [K] |
Benchmark Period Mean (complement) [K] |
Bias [K] |
RMSE [K] |
Phase Shift [months] |
Bias Score [1] |
RMSE Score [1] |
Seasonal Cycle Score [1] |
Spatial Distribution Score [1] |
Interannual Variability Score [1] |
Overall Score [1] |
|||
|---|---|---|---|---|---|---|---|---|---|---|---|---|---|---|---|---|---|
| Benchmark | [-] | 288. | |||||||||||||||
| CLM4 | [-] | 290. | 290. | 294. | 288. | 293. | 1.87 | 2.23 | 0.919 | 0.540 | 0.732 | 0.872 | 0.997 | 0.838 | 0.785 | ||
| CLM4.5 | [-] | 291. | 291. | 294. | 288. | 293. | 2.31 | 2.56 | 0.845 | 0.465 | 0.739 | 0.890 | 0.997 | 0.830 | 0.776 | ||
| CLM5 | [-] | 291. | 291. | 294. | 288. | 293. | 2.48 | 2.67 | 0.888 | 0.446 | 0.742 | 0.881 | 0.999 | 0.829 | 0.773 |
Download Data |
Period Mean (original grids) [K] |
Model Period Mean (intersection) [K] |
Model Period Mean (complement) [K] |
Benchmark Period Mean (intersection) [K] |
Benchmark Period Mean (complement) [K] |
Bias [K] |
RMSE [K] |
Phase Shift [months] |
Bias Score [1] |
RMSE Score [1] |
Seasonal Cycle Score [1] |
Spatial Distribution Score [1] |
Interannual Variability Score [1] |
Overall Score [1] |
|||
|---|---|---|---|---|---|---|---|---|---|---|---|---|---|---|---|---|---|
| Benchmark | [-] | 256. | |||||||||||||||
| CLM4 | [-] | 254. | 254. | 259. | 256. | 261. | -1.84 | 2.77 | 0.0730 | 0.875 | 0.893 | 0.995 | 1.00 | 0.886 | 0.924 | ||
| CLM4.5 | [-] | 254. | 254. | 259. | 256. | 261. | -1.52 | 2.62 | 0.0671 | 0.890 | 0.889 | 0.995 | 1.00 | 0.891 | 0.926 | ||
| CLM5 | [-] | 257. | 256. | 261. | 256. | 261. | 0.587 | 1.91 | 0.0676 | 0.933 | 0.906 | 0.995 | 1.00 | 0.888 | 0.938 |
Download Data |
Period Mean (original grids) [K] |
Model Period Mean (intersection) [K] |
Model Period Mean (complement) [K] |
Benchmark Period Mean (intersection) [K] |
Benchmark Period Mean (complement) [K] |
Bias [K] |
RMSE [K] |
Phase Shift [months] |
Bias Score [1] |
RMSE Score [1] |
Seasonal Cycle Score [1] |
Spatial Distribution Score [1] |
Interannual Variability Score [1] |
Overall Score [1] |
|||
|---|---|---|---|---|---|---|---|---|---|---|---|---|---|---|---|---|---|
| Benchmark | [-] | 294. | |||||||||||||||
| CLM4 | [-] | 296. | 296. | 298. | 294. | 295. | 2.22 | 2.53 | 1.59 | 0.128 | 0.452 | 0.761 | 0.992 | 0.797 | 0.597 | ||
| CLM4.5 | [-] | 296. | 296. | 298. | 294. | 295. | 2.35 | 2.62 | 1.58 | 0.112 | 0.458 | 0.765 | 0.988 | 0.777 | 0.593 | ||
| CLM5 | [-] | 297. | 297. | 298. | 294. | 295. | 3.11 | 3.26 | 1.60 | 0.0596 | 0.477 | 0.757 | 0.937 | 0.744 | 0.575 |
Download Data |
Period Mean (original grids) [K] |
Model Period Mean (intersection) [K] |
Model Period Mean (complement) [K] |
Benchmark Period Mean (intersection) [K] |
Benchmark Period Mean (complement) [K] |
Bias [K] |
RMSE [K] |
Phase Shift [months] |
Bias Score [1] |
RMSE Score [1] |
Seasonal Cycle Score [1] |
Spatial Distribution Score [1] |
Interannual Variability Score [1] |
Overall Score [1] |
|||
|---|---|---|---|---|---|---|---|---|---|---|---|---|---|---|---|---|---|
| Benchmark | [-] | 265. | |||||||||||||||
| CLM4 | [-] | 263. | 263. | 270. | 265. | 269. | -2.31 | 2.87 | 0.0281 | 0.834 | 0.910 | 0.998 | 0.997 | 0.964 | 0.935 | ||
| CLM4.5 | [-] | 263. | 263. | 270. | 265. | 269. | -1.79 | 2.62 | 0.0273 | 0.854 | 0.906 | 0.998 | 0.985 | 0.965 | 0.935 | ||
| CLM5 | [-] | 266. | 266. | 272. | 265. | 269. | 0.538 | 1.48 | 0.0277 | 0.935 | 0.930 | 0.998 | 0.992 | 0.971 | 0.959 |
Download Data |
Period Mean (original grids) [K] |
Model Period Mean (intersection) [K] |
Model Period Mean (complement) [K] |
Benchmark Period Mean (intersection) [K] |
Benchmark Period Mean (complement) [K] |
Bias [K] |
RMSE [K] |
Phase Shift [months] |
Bias Score [1] |
RMSE Score [1] |
Seasonal Cycle Score [1] |
Spatial Distribution Score [1] |
Interannual Variability Score [1] |
Overall Score [1] |
|||
|---|---|---|---|---|---|---|---|---|---|---|---|---|---|---|---|---|---|
| Benchmark | [-] | 274. | |||||||||||||||
| CLM4 | [-] | 273. | 273. | 284. | 274. | 280. | -0.263 | 2.35 | 0.0254 | 0.849 | 0.858 | 0.998 | 1.00 | 0.891 | 0.909 | ||
| CLM4.5 | [-] | 274. | 274. | 284. | 274. | 280. | 0.121 | 2.30 | 0.0231 | 0.854 | 0.860 | 0.998 | 0.998 | 0.899 | 0.911 | ||
| CLM5 | [-] | 275. | 275. | 285. | 274. | 280. | 1.21 | 2.20 | 0.0399 | 0.848 | 0.883 | 0.997 | 0.999 | 0.922 | 0.922 |
Download Data |
Period Mean (original grids) [K] |
Model Period Mean (intersection) [K] |
Model Period Mean (complement) [K] |
Benchmark Period Mean (intersection) [K] |
Benchmark Period Mean (complement) [K] |
Bias [K] |
RMSE [K] |
Phase Shift [months] |
Bias Score [1] |
RMSE Score [1] |
Seasonal Cycle Score [1] |
Spatial Distribution Score [1] |
Interannual Variability Score [1] |
Overall Score [1] |
|||
|---|---|---|---|---|---|---|---|---|---|---|---|---|---|---|---|---|---|
| Benchmark | [-] | 291. | |||||||||||||||
| CLM4 | [-] | 291. | 291. | 298. | 291. | 296. | 0.310 | 2.16 | 0.345 | 0.646 | 0.778 | 0.971 | 0.968 | 0.829 | 0.829 | ||
| CLM4.5 | [-] | 291. | 291. | 298. | 291. | 296. | 0.723 | 2.13 | 0.328 | 0.639 | 0.784 | 0.972 | 0.980 | 0.845 | 0.834 | ||
| CLM5 | [-] | 292. | 292. | 298. | 291. | 296. | 1.17 | 2.14 | 0.303 | 0.631 | 0.791 | 0.976 | 0.990 | 0.853 | 0.839 |
Download Data |
Period Mean (original grids) [K] |
Model Period Mean (intersection) [K] |
Model Period Mean (complement) [K] |
Benchmark Period Mean (intersection) [K] |
Benchmark Period Mean (complement) [K] |
Bias [K] |
RMSE [K] |
Phase Shift [months] |
Bias Score [1] |
RMSE Score [1] |
Seasonal Cycle Score [1] |
Spatial Distribution Score [1] |
Interannual Variability Score [1] |
Overall Score [1] |
|||
|---|---|---|---|---|---|---|---|---|---|---|---|---|---|---|---|---|---|
| Benchmark | [-] | 259. | |||||||||||||||
| CLM4 | [-] | 256. | 256. | 259. | 259. | 260. | -2.59 | 3.29 | 0.0255 | 0.842 | 0.885 | 0.998 | 1.00 | 0.919 | 0.921 | ||
| CLM4.5 | [-] | 257. | 257. | 259. | 259. | 260. | -2.30 | 3.08 | 0.0283 | 0.858 | 0.883 | 0.998 | 0.999 | 0.918 | 0.923 | ||
| CLM5 | [-] | 259. | 259. | 261. | 259. | 260. | -0.0883 | 1.60 | 0.0227 | 0.962 | 0.910 | 0.998 | 0.999 | 0.911 | 0.949 |
Download Data |
Period Mean (original grids) [K] |
Model Period Mean (intersection) [K] |
Model Period Mean (complement) [K] |
Benchmark Period Mean (intersection) [K] |
Benchmark Period Mean (complement) [K] |
Bias [K] |
RMSE [K] |
Phase Shift [months] |
Bias Score [1] |
RMSE Score [1] |
Seasonal Cycle Score [1] |
Spatial Distribution Score [1] |
Interannual Variability Score [1] |
Overall Score [1] |
|||
|---|---|---|---|---|---|---|---|---|---|---|---|---|---|---|---|---|---|
| Benchmark | [-] | 287. | |||||||||||||||
| CLM4 | [-] | 290. | 290. | 291. | 287. | 289. | 2.13 | 2.40 | 0.219 | 0.634 | 0.830 | 0.985 | 0.982 | 0.908 | 0.861 | ||
| CLM4.5 | [-] | 290. | 290. | 291. | 287. | 289. | 2.17 | 2.42 | 0.223 | 0.631 | 0.828 | 0.984 | 0.984 | 0.908 | 0.860 | ||
| CLM5 | [-] | 290. | 290. | 291. | 287. | 289. | 2.60 | 2.76 | 0.207 | 0.582 | 0.834 | 0.985 | 0.994 | 0.905 | 0.856 |
Download Data |
Period Mean (original grids) [K] |
Model Period Mean (intersection) [K] |
Model Period Mean (complement) [K] |
Benchmark Period Mean (intersection) [K] |
Benchmark Period Mean (complement) [K] |
Bias [K] |
RMSE [K] |
Phase Shift [months] |
Bias Score [1] |
RMSE Score [1] |
Seasonal Cycle Score [1] |
Spatial Distribution Score [1] |
Interannual Variability Score [1] |
Overall Score [1] |
|||
|---|---|---|---|---|---|---|---|---|---|---|---|---|---|---|---|---|---|
| Benchmark | [-] | 277. | |||||||||||||||
| CLM4 | [-] | 276. | 276. | 280. | 277. | 281. | -0.641 | 2.01 | 0.102 | 0.798 | 0.819 | 0.993 | 0.965 | 0.871 | 0.877 | ||
| CLM4.5 | [-] | 276. | 276. | 279. | 277. | 281. | -0.716 | 1.98 | 0.101 | 0.797 | 0.824 | 0.993 | 0.968 | 0.876 | 0.880 | ||
| CLM5 | [-] | 278. | 278. | 281. | 277. | 281. | 0.782 | 1.54 | 0.261 | 0.817 | 0.870 | 0.982 | 0.993 | 0.919 | 0.909 |
Download Data |
Period Mean (original grids) [K] |
Model Period Mean (intersection) [K] |
Model Period Mean (complement) [K] |
Benchmark Period Mean (intersection) [K] |
Benchmark Period Mean (complement) [K] |
Bias [K] |
RMSE [K] |
Phase Shift [months] |
Bias Score [1] |
RMSE Score [1] |
Seasonal Cycle Score [1] |
Spatial Distribution Score [1] |
Interannual Variability Score [1] |
Overall Score [1] |
|||
|---|---|---|---|---|---|---|---|---|---|---|---|---|---|---|---|---|---|
| Benchmark | [-] | 281. | |||||||||||||||
| CLM4 | [-] | 276. | 280. | 241. | 280. | 287. | 0.170 | 2.35 | 0.413 | 0.679 | 0.779 | 0.947 | 0.993 | 0.884 | 0.844 | ||
| CLM4.5 | [-] | 276. | 281. | 240. | 280. | 287. | 0.453 | 2.38 | 0.403 | 0.666 | 0.779 | 0.949 | 0.992 | 0.887 | 0.842 | ||
| CLM5 | [-] | 277. | 282. | 241. | 280. | 287. | 1.45 | 2.25 | 0.416 | 0.657 | 0.794 | 0.947 | 0.998 | 0.895 | 0.848 |
Download Data |
Period Mean (original grids) [K] |
Model Period Mean (intersection) [K] |
Model Period Mean (complement) [K] |
Benchmark Period Mean (intersection) [K] |
Benchmark Period Mean (complement) [K] |
Bias [K] |
RMSE [K] |
Phase Shift [months] |
Bias Score [1] |
RMSE Score [1] |
Seasonal Cycle Score [1] |
Spatial Distribution Score [1] |
Interannual Variability Score [1] |
Overall Score [1] |
|||
|---|---|---|---|---|---|---|---|---|---|---|---|---|---|---|---|---|---|
| Benchmark | [-] | 289. | |||||||||||||||
| CLM4 | [-] | 288. | 288. | 292. | 288. | 292. | 0.0109 | 1.91 | 0.329 | 0.789 | 0.835 | 0.974 | 1.00 | 0.899 | 0.889 | ||
| CLM4.5 | [-] | 289. | 289. | 292. | 288. | 292. | 0.244 | 1.86 | 0.309 | 0.795 | 0.836 | 0.976 | 0.999 | 0.897 | 0.890 | ||
| CLM5 | [-] | 289. | 289. | 292. | 288. | 292. | 0.570 | 1.87 | 0.313 | 0.793 | 0.838 | 0.976 | 0.997 | 0.909 | 0.892 |
Download Data |
Period Mean (original grids) [K] |
Model Period Mean (intersection) [K] |
Model Period Mean (complement) [K] |
Benchmark Period Mean (intersection) [K] |
Benchmark Period Mean (complement) [K] |
Bias [K] |
RMSE [K] |
Phase Shift [months] |
Bias Score [1] |
RMSE Score [1] |
Seasonal Cycle Score [1] |
Spatial Distribution Score [1] |
Interannual Variability Score [1] |
Overall Score [1] |
|||
|---|---|---|---|---|---|---|---|---|---|---|---|---|---|---|---|---|---|
| Benchmark | [-] | 260. | |||||||||||||||
| CLM4 | [-] | 258. | 258. | 257. | 260. | 262. | -2.38 | 3.03 | 0.0693 | 0.835 | 0.884 | 0.995 | 0.988 | 0.899 | 0.914 | ||
| CLM4.5 | [-] | 258. | 258. | 257. | 260. | 262. | -2.07 | 2.84 | 0.0762 | 0.854 | 0.878 | 0.995 | 0.985 | 0.900 | 0.915 | ||
| CLM5 | [-] | 260. | 260. | 259. | 260. | 262. | 0.124 | 1.63 | 0.0682 | 0.938 | 0.904 | 0.995 | 0.986 | 0.895 | 0.937 |
Download Data |
Period Mean (original grids) [K] |
Model Period Mean (intersection) [K] |
Model Period Mean (complement) [K] |
Benchmark Period Mean (intersection) [K] |
Benchmark Period Mean (complement) [K] |
Bias [K] |
RMSE [K] |
Phase Shift [months] |
Bias Score [1] |
RMSE Score [1] |
Seasonal Cycle Score [1] |
Spatial Distribution Score [1] |
Interannual Variability Score [1] |
Overall Score [1] |
|||
|---|---|---|---|---|---|---|---|---|---|---|---|---|---|---|---|---|---|
| Benchmark | [-] | 289. | |||||||||||||||
| CLM4 | [-] | 290. | 290. | 295. | 289. | 293. | 2.66 | 3.20 | 0.515 | 0.405 | 0.715 | 0.949 | 0.982 | 0.870 | 0.773 | ||
| CLM4.5 | [-] | 290. | 290. | 295. | 289. | 293. | 2.60 | 3.11 | 0.570 | 0.414 | 0.704 | 0.941 | 0.993 | 0.873 | 0.772 | ||
| CLM5 | [-] | 291. | 291. | 295. | 289. | 293. | 3.06 | 3.46 | 0.530 | 0.376 | 0.712 | 0.946 | 0.994 | 0.873 | 0.769 |
Download Data |
Period Mean (original grids) [K] |
Model Period Mean (intersection) [K] |
Model Period Mean (complement) [K] |
Benchmark Period Mean (intersection) [K] |
Benchmark Period Mean (complement) [K] |
Bias [K] |
RMSE [K] |
Phase Shift [months] |
Bias Score [1] |
RMSE Score [1] |
Seasonal Cycle Score [1] |
Spatial Distribution Score [1] |
Interannual Variability Score [1] |
Overall Score [1] |
|||
|---|---|---|---|---|---|---|---|---|---|---|---|---|---|---|---|---|---|
| Benchmark | [-] | 280. | |||||||||||||||
| CLM4 | [-] | 280. | 280. | 290. | 280. | 287. | 0.229 | 1.51 | 0.0725 | 0.892 | 0.884 | 0.995 | 0.986 | 0.920 | 0.927 | ||
| CLM4.5 | [-] | 280. | 280. | 290. | 280. | 287. | 0.506 | 1.51 | 0.0606 | 0.890 | 0.884 | 0.996 | 0.988 | 0.928 | 0.928 | ||
| CLM5 | [-] | 282. | 282. | 291. | 280. | 287. | 1.92 | 2.14 | 0.0503 | 0.793 | 0.909 | 0.997 | 0.993 | 0.949 | 0.925 |
Download Data |
Period Mean (original grids) [K] |
Model Period Mean (intersection) [K] |
Model Period Mean (complement) [K] |
Benchmark Period Mean (intersection) [K] |
Benchmark Period Mean (complement) [K] |
Bias [K] |
RMSE [K] |
Phase Shift [months] |
Bias Score [1] |
RMSE Score [1] |
Seasonal Cycle Score [1] |
Spatial Distribution Score [1] |
Interannual Variability Score [1] |
Overall Score [1] |
|||
|---|---|---|---|---|---|---|---|---|---|---|---|---|---|---|---|---|---|
| Benchmark | [-] | 268. | |||||||||||||||
| CLM4 | [-] | 266. | 266. | 273. | 268. | 274. | -1.93 | 2.56 | 0.0440 | 0.819 | 0.890 | 0.997 | 0.961 | 0.938 | 0.916 | ||
| CLM4.5 | [-] | 266. | 266. | 273. | 268. | 274. | -1.55 | 2.32 | 0.0393 | 0.842 | 0.885 | 0.997 | 0.967 | 0.940 | 0.919 | ||
| CLM5 | [-] | 269. | 269. | 274. | 268. | 274. | 0.849 | 1.54 | 0.0363 | 0.895 | 0.908 | 0.998 | 0.995 | 0.944 | 0.941 |
Download Data |
Period Mean (original grids) [K] |
Model Period Mean (intersection) [K] |
Model Period Mean (complement) [K] |
Benchmark Period Mean (intersection) [K] |
Benchmark Period Mean (complement) [K] |
Bias [K] |
RMSE [K] |
Phase Shift [months] |
Bias Score [1] |
RMSE Score [1] |
Seasonal Cycle Score [1] |
Spatial Distribution Score [1] |
Interannual Variability Score [1] |
Overall Score [1] |
|||
|---|---|---|---|---|---|---|---|---|---|---|---|---|---|---|---|---|---|
| Benchmark | [-] | 276. | |||||||||||||||
| CLM4 | [-] | 276. | 276. | 282. | 276. | 280. | 0.511 | 2.23 | 0.0308 | 0.797 | 0.832 | 0.998 | 0.994 | 0.838 | 0.882 | ||
| CLM4.5 | [-] | 276. | 276. | 282. | 276. | 280. | 0.819 | 2.21 | 0.0341 | 0.803 | 0.827 | 0.997 | 0.999 | 0.846 | 0.883 | ||
| CLM5 | [-] | 277. | 277. | 283. | 276. | 280. | 1.79 | 2.50 | 0.0354 | 0.761 | 0.836 | 0.997 | 0.997 | 0.897 | 0.887 |
Download Data |
Period Mean (original grids) [K] |
Model Period Mean (intersection) [K] |
Model Period Mean (complement) [K] |
Benchmark Period Mean (intersection) [K] |
Benchmark Period Mean (complement) [K] |
Bias [K] |
RMSE [K] |
Phase Shift [months] |
Bias Score [1] |
RMSE Score [1] |
Seasonal Cycle Score [1] |
Spatial Distribution Score [1] |
Interannual Variability Score [1] |
Overall Score [1] |
|||
|---|---|---|---|---|---|---|---|---|---|---|---|---|---|---|---|---|---|
| Benchmark | [-] | 294. | |||||||||||||||
| CLM4 | [-] | 295. | 295. | 298. | 294. | 294. | 1.41 | 1.98 | 2.03 | 0.245 | 0.522 | 0.674 | 0.974 | 0.877 | 0.636 | ||
| CLM4.5 | [-] | 295. | 295. | 298. | 294. | 294. | 1.67 | 2.16 | 2.07 | 0.204 | 0.521 | 0.666 | 0.980 | 0.887 | 0.630 | ||
| CLM5 | [-] | 296. | 296. | 298. | 294. | 294. | 2.20 | 2.50 | 2.13 | 0.137 | 0.521 | 0.661 | 1.00 | 0.882 | 0.620 |
Download Data |
Period Mean (original grids) [K] |
Model Period Mean (intersection) [K] |
Model Period Mean (complement) [K] |
Benchmark Period Mean (intersection) [K] |
Benchmark Period Mean (complement) [K] |
Bias [K] |
RMSE [K] |
Phase Shift [months] |
Bias Score [1] |
RMSE Score [1] |
Seasonal Cycle Score [1] |
Spatial Distribution Score [1] |
Interannual Variability Score [1] |
Overall Score [1] |
|||
|---|---|---|---|---|---|---|---|---|---|---|---|---|---|---|---|---|---|
| Benchmark | [-] | 290. | |||||||||||||||
| CLM4 | [-] | 291. | 291. | 293. | 290. | 288. | 1.58 | 2.04 | 0.799 | 0.529 | 0.728 | 0.885 | 0.981 | 0.891 | 0.790 | ||
| CLM4.5 | [-] | 292. | 292. | 293. | 290. | 288. | 1.92 | 2.28 | 0.765 | 0.477 | 0.725 | 0.890 | 0.979 | 0.900 | 0.783 | ||
| CLM5 | [-] | 292. | 292. | 294. | 290. | 288. | 2.43 | 2.59 | 0.778 | 0.410 | 0.742 | 0.888 | 0.997 | 0.919 | 0.783 |
Download Data |
Period Mean (original grids) [K] |
Model Period Mean (intersection) [K] |
Model Period Mean (complement) [K] |
Benchmark Period Mean (intersection) [K] |
Benchmark Period Mean (complement) [K] |
Bias [K] |
RMSE [K] |
Phase Shift [months] |
Bias Score [1] |
RMSE Score [1] |
Seasonal Cycle Score [1] |
Spatial Distribution Score [1] |
Interannual Variability Score [1] |
Overall Score [1] |
|||
|---|---|---|---|---|---|---|---|---|---|---|---|---|---|---|---|---|---|
| Benchmark | [-] | 278. | |||||||||||||||
| CLM4 | [-] | 279. | 279. | 284. | 278. | 281. | 1.33 | 2.68 | 0.239 | 0.545 | 0.726 | 0.977 | 0.988 | 0.904 | 0.811 | ||
| CLM4.5 | [-] | 279. | 279. | 284. | 278. | 281. | 1.88 | 2.90 | 0.306 | 0.520 | 0.719 | 0.966 | 0.995 | 0.904 | 0.804 | ||
| CLM5 | [-] | 280. | 280. | 285. | 278. | 281. | 2.59 | 3.21 | 0.305 | 0.458 | 0.749 | 0.964 | 0.999 | 0.922 | 0.807 |
Temporally integrated period mean