Mean State
Download Data |
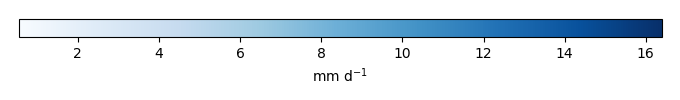
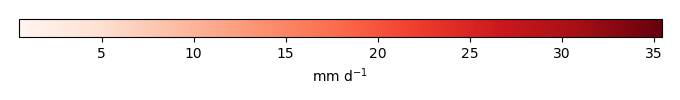
Period Mean (original grids) [mm d-1] |
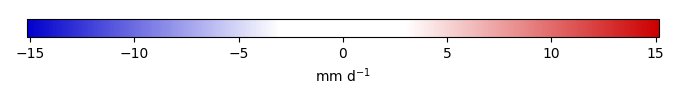
Bias [mm d-1] |
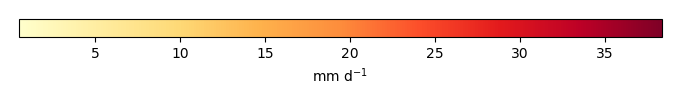
RMSE [mm d-1] |
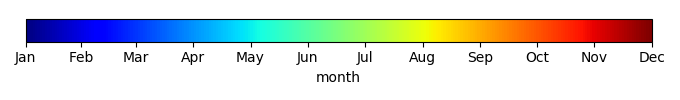
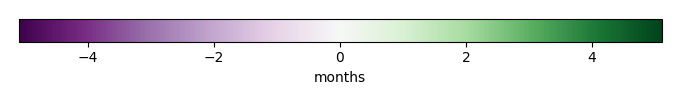
Phase Shift [months] |
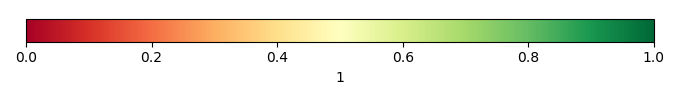
Bias Score [1] |
RMSE Score [1] |
Seasonal Cycle Score [1] |
Interannual Variability Score [1] |
Overall Score [1] |
|||
|---|---|---|---|---|---|---|---|---|---|---|---|---|
| Benchmark | [-] | 0.000892 | ||||||||||
| CLM4 | [-] | 0.00152 | 0.000632 | 0.00105 | 1.01 | 0.584 | 0.419 | 0.933 | 0.623 | 0.596 | ||
| CLM4.5 | [-] | 0.00152 | 0.000632 | 0.00105 | 1.01 | 0.584 | 0.419 | 0.933 | 0.623 | 0.596 | ||
| CLM5 | [-] | 0.00152 | 0.000632 | 0.00105 | 1.01 | 0.584 | 0.419 | 0.933 | 0.623 | 0.596 |
Download Data |
Period Mean (original grids) [mm d-1] |
Bias [mm d-1] |
RMSE [mm d-1] |
Phase Shift [months] |
Bias Score [1] |
RMSE Score [1] |
Seasonal Cycle Score [1] |
Interannual Variability Score [1] |
Overall Score [1] |
|||
|---|---|---|---|---|---|---|---|---|---|---|---|---|
| Benchmark | [-] | 0.000513 | ||||||||||
| CLM4 | [-] | 0.000519 | 6.48e-06 | 0.000443 | 2.05 | 0.985 | 0.362 | 0.745 | 0.875 | 0.666 | ||
| CLM4.5 | [-] | 0.000519 | 6.48e-06 | 0.000443 | 2.05 | 0.985 | 0.362 | 0.745 | 0.875 | 0.666 | ||
| CLM5 | [-] | 0.000519 | 6.48e-06 | 0.000443 | 2.05 | 0.985 | 0.362 | 0.745 | 0.875 | 0.666 |
Download Data |
Period Mean (original grids) [mm d-1] |
Bias [mm d-1] |
RMSE [mm d-1] |
Phase Shift [months] |
Bias Score [1] |
RMSE Score [1] |
Seasonal Cycle Score [1] |
Interannual Variability Score [1] |
Overall Score [1] |
|||
|---|---|---|---|---|---|---|---|---|---|---|---|---|
| Benchmark | [-] | 0.00569 | ||||||||||
| CLM4 | [-] | 0.0106 | 0.00487 | 0.00686 | 2.03 | 0.302 | 0.377 | 0.749 | 0.925 | 0.546 | ||
| CLM4.5 | [-] | 0.0106 | 0.00487 | 0.00686 | 2.03 | 0.302 | 0.377 | 0.749 | 0.925 | 0.546 | ||
| CLM5 | [-] | 0.0106 | 0.00487 | 0.00686 | 2.03 | 0.302 | 0.377 | 0.749 | 0.925 | 0.546 |
Download Data |
Period Mean (original grids) [mm d-1] |
Bias [mm d-1] |
RMSE [mm d-1] |
Phase Shift [months] |
Bias Score [1] |
RMSE Score [1] |
Seasonal Cycle Score [1] |
Interannual Variability Score [1] |
Overall Score [1] |
|||
|---|---|---|---|---|---|---|---|---|---|---|---|---|
| Benchmark | [-] | 0.00102 | ||||||||||
| CLM4 | [-] | 0.00141 | 0.000381 | 0.00111 | 1.02 | 0.740 | 0.388 | 0.932 | 0.751 | 0.640 | ||
| CLM4.5 | [-] | 0.00141 | 0.000381 | 0.00111 | 1.02 | 0.740 | 0.388 | 0.932 | 0.751 | 0.640 | ||
| CLM5 | [-] | 0.00141 | 0.000381 | 0.00111 | 1.02 | 0.740 | 0.388 | 0.932 | 0.751 | 0.640 |
Download Data |
Period Mean (original grids) [mm d-1] |
Bias [mm d-1] |
RMSE [mm d-1] |
Phase Shift [months] |
Bias Score [1] |
RMSE Score [1] |
Seasonal Cycle Score [1] |
Interannual Variability Score [1] |
Overall Score [1] |
|||
|---|---|---|---|---|---|---|---|---|---|---|---|---|
| Benchmark | [-] | 0.00411 | ||||||||||
| CLM4 | [-] | 0.00340 | -0.000706 | 0.00248 | 1.53 | 0.818 | 0.591 | 0.781 | 0.774 | 0.711 | ||
| CLM4.5 | [-] | 0.00340 | -0.000706 | 0.00248 | 1.53 | 0.818 | 0.591 | 0.781 | 0.774 | 0.711 | ||
| CLM5 | [-] | 0.00340 | -0.000706 | 0.00248 | 1.53 | 0.818 | 0.591 | 0.781 | 0.774 | 0.711 |
Download Data |
Period Mean (original grids) [mm d-1] |
Bias [mm d-1] |
RMSE [mm d-1] |
Phase Shift [months] |
Bias Score [1] |
RMSE Score [1] |
Seasonal Cycle Score [1] |
Interannual Variability Score [1] |
Overall Score [1] |
|||
|---|---|---|---|---|---|---|---|---|---|---|---|---|
| Benchmark | [-] | 0.00424 | ||||||||||
| CLM4 | [-] | 0.00215 | -0.00208 | 0.00567 | 1.75 | 0.676 | 0.425 | 0.813 | 0.557 | 0.579 | ||
| CLM4.5 | [-] | 0.00215 | -0.00208 | 0.00567 | 1.75 | 0.676 | 0.425 | 0.813 | 0.557 | 0.579 | ||
| CLM5 | [-] | 0.00215 | -0.00208 | 0.00567 | 1.75 | 0.676 | 0.425 | 0.813 | 0.557 | 0.579 |
Download Data |
Period Mean (original grids) [mm d-1] |
Bias [mm d-1] |
RMSE [mm d-1] |
Phase Shift [months] |
Bias Score [1] |
RMSE Score [1] |
Seasonal Cycle Score [1] |
Interannual Variability Score [1] |
Overall Score [1] |
|||
|---|---|---|---|---|---|---|---|---|---|---|---|---|
| Benchmark | [-] | 0.00308 | ||||||||||
| CLM4 | [-] | 0.00224 | -0.000841 | 0.00359 | 1.48 | 0.698 | 0.442 | 0.816 | 0.635 | 0.607 | ||
| CLM4.5 | [-] | 0.00224 | -0.000841 | 0.00359 | 1.48 | 0.698 | 0.442 | 0.816 | 0.635 | 0.607 | ||
| CLM5 | [-] | 0.00224 | -0.000841 | 0.00359 | 1.48 | 0.698 | 0.442 | 0.816 | 0.635 | 0.607 |
Download Data |
Period Mean (original grids) [mm d-1] |
Bias [mm d-1] |
RMSE [mm d-1] |
Phase Shift [months] |
Bias Score [1] |
RMSE Score [1] |
Seasonal Cycle Score [1] |
Interannual Variability Score [1] |
Overall Score [1] |
|||
|---|---|---|---|---|---|---|---|---|---|---|---|---|
| Benchmark | [-] | 0.000883 | ||||||||||
| CLM4 | [-] | 0.000910 | 2.65e-05 | 0.000695 | 1.03 | 0.980 | 0.594 | 0.930 | 0.974 | 0.814 | ||
| CLM4.5 | [-] | 0.000910 | 2.65e-05 | 0.000695 | 1.03 | 0.980 | 0.594 | 0.930 | 0.974 | 0.814 | ||
| CLM5 | [-] | 0.000910 | 2.65e-05 | 0.000695 | 1.03 | 0.980 | 0.594 | 0.930 | 0.974 | 0.814 |
Download Data |
Period Mean (original grids) [mm d-1] |
Bias [mm d-1] |
RMSE [mm d-1] |
Phase Shift [months] |
Bias Score [1] |
RMSE Score [1] |
Seasonal Cycle Score [1] |
Interannual Variability Score [1] |
Overall Score [1] |
|||
|---|---|---|---|---|---|---|---|---|---|---|---|---|
| Benchmark | [-] | 0.00229 | ||||||||||
| CLM4 | [-] | 0.00270 | 0.000377 | 0.00156 | 1.12 | 0.806 | 0.480 | 0.839 | 0.835 | 0.688 | ||
| CLM4.5 | [-] | 0.00270 | 0.000377 | 0.00156 | 1.12 | 0.806 | 0.480 | 0.839 | 0.835 | 0.688 | ||
| CLM5 | [-] | 0.00270 | 0.000377 | 0.00156 | 1.12 | 0.806 | 0.480 | 0.839 | 0.835 | 0.688 |
Download Data |
Period Mean (original grids) [mm d-1] |
Bias [mm d-1] |
RMSE [mm d-1] |
Phase Shift [months] |
Bias Score [1] |
RMSE Score [1] |
Seasonal Cycle Score [1] |
Interannual Variability Score [1] |
Overall Score [1] |
|||
|---|---|---|---|---|---|---|---|---|---|---|---|---|
| Benchmark | [-] | 0.00124 | ||||||||||
| CLM4 | [-] | 0.00159 | 0.000353 | 0.00131 | 1.46 | 0.733 | 0.410 | 0.695 | 0.712 | 0.592 | ||
| CLM4.5 | [-] | 0.00159 | 0.000353 | 0.00131 | 1.46 | 0.733 | 0.410 | 0.695 | 0.712 | 0.592 | ||
| CLM5 | [-] | 0.00159 | 0.000353 | 0.00131 | 1.46 | 0.733 | 0.410 | 0.695 | 0.712 | 0.592 |
Download Data |
Period Mean (original grids) [mm d-1] |
Bias [mm d-1] |
RMSE [mm d-1] |
Phase Shift [months] |
Bias Score [1] |
RMSE Score [1] |
Seasonal Cycle Score [1] |
Interannual Variability Score [1] |
Overall Score [1] |
|||
|---|---|---|---|---|---|---|---|---|---|---|---|---|
| Benchmark | [-] | 0.00165 | ||||||||||
| CLM4 | [-] | 0.00148 | -0.000170 | 0.00104 | 0.844 | 0.918 | 0.608 | 0.920 | 0.900 | 0.791 | ||
| CLM4.5 | [-] | 0.00148 | -0.000170 | 0.00104 | 0.844 | 0.918 | 0.608 | 0.920 | 0.900 | 0.791 | ||
| CLM5 | [-] | 0.00148 | -0.000170 | 0.00104 | 0.844 | 0.918 | 0.608 | 0.920 | 0.900 | 0.791 |
Download Data |
Period Mean (original grids) [mm d-1] |
Bias [mm d-1] |
RMSE [mm d-1] |
Phase Shift [months] |
Bias Score [1] |
RMSE Score [1] |
Seasonal Cycle Score [1] |
Interannual Variability Score [1] |
Overall Score [1] |
|||
|---|---|---|---|---|---|---|---|---|---|---|---|---|
| Benchmark | [-] | 0.00319 | ||||||||||
| CLM4 | [-] | 0.00538 | 0.00219 | 0.00239 | 0.00 | 0.361 | 0.421 | 1.00 | 0.537 | 0.548 | ||
| CLM4.5 | [-] | 0.00538 | 0.00219 | 0.00239 | 0.00 | 0.361 | 0.421 | 1.00 | 0.537 | 0.548 | ||
| CLM5 | [-] | 0.00538 | 0.00219 | 0.00239 | 0.00 | 0.361 | 0.421 | 1.00 | 0.537 | 0.548 |
Temporally integrated period mean