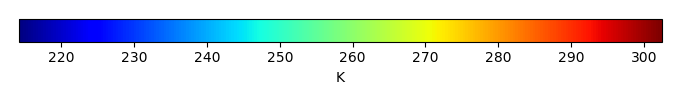
Mean State
Download Data |
Period Mean (original grids) [K] |
Model Period Mean (intersection) [K] |
Model Period Mean (complement) [K] |
Benchmark Period Mean (intersection) [K] |
Benchmark Period Mean (complement) [K] |
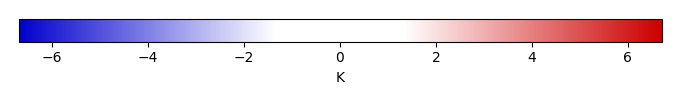
Bias [K] |
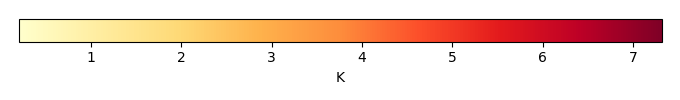
RMSE [K] |
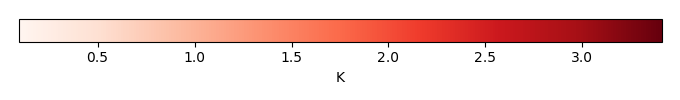
Phase Shift [months] |
Bias Score [1] |
RMSE Score [1] |
Seasonal Cycle Score [1] |
Spatial Distribution Score [1] |
Interannual Variability Score [1] |
Overall Score [1] |
|||
|---|---|---|---|---|---|---|---|---|---|---|---|---|---|---|---|---|---|
| Benchmark | [-] | 299. | |||||||||||||||
| CLM4 | [-] | 298. | 298. | 301. | 298. | 300. | -0.366 | 1.05 | 0.353 | 0.460 | 0.755 | 0.960 | 0.942 | 0.927 | 0.800 | ||
| CLM4.5 | [-] | 298. | 298. | 300. | 298. | 300. | -0.147 | 0.947 | 0.322 | 0.502 | 0.779 | 0.967 | 0.958 | 0.944 | 0.821 | ||
| CLM5 | [-] | 299. | 299. | 301. | 298. | 300. | 0.167 | 0.738 | 0.323 | 0.625 | 0.793 | 0.963 | 0.985 | 0.956 | 0.853 |
Download Data |
Period Mean (original grids) [K] |
Model Period Mean (intersection) [K] |
Model Period Mean (complement) [K] |
Benchmark Period Mean (intersection) [K] |
Benchmark Period Mean (complement) [K] |
Bias [K] |
RMSE [K] |
Phase Shift [months] |
Bias Score [1] |
RMSE Score [1] |
Seasonal Cycle Score [1] |
Spatial Distribution Score [1] |
Interannual Variability Score [1] |
Overall Score [1] |
|||
|---|---|---|---|---|---|---|---|---|---|---|---|---|---|---|---|---|---|
| Benchmark | [-] | 300. | |||||||||||||||
| CLM4 | [-] | 300. | 300. | 301. | 300. | 300. | 0.0789 | 0.911 | 0.228 | 0.757 | 0.790 | 0.983 | 1.00 | 0.946 | 0.878 | ||
| CLM4.5 | [-] | 300. | 301. | 301. | 300. | 300. | 0.316 | 0.883 | 0.221 | 0.743 | 0.824 | 0.983 | 0.997 | 0.962 | 0.889 | ||
| CLM5 | [-] | 301. | 301. | 301. | 300. | 300. | 0.521 | 0.852 | 0.195 | 0.730 | 0.854 | 0.985 | 0.996 | 0.969 | 0.898 |
Download Data |
Period Mean (original grids) [K] |
Model Period Mean (intersection) [K] |
Model Period Mean (complement) [K] |
Benchmark Period Mean (intersection) [K] |
Benchmark Period Mean (complement) [K] |
Bias [K] |
RMSE [K] |
Phase Shift [months] |
Bias Score [1] |
RMSE Score [1] |
Seasonal Cycle Score [1] |
Spatial Distribution Score [1] |
Interannual Variability Score [1] |
Overall Score [1] |
|||
|---|---|---|---|---|---|---|---|---|---|---|---|---|---|---|---|---|---|
| Benchmark | [-] | 295. | |||||||||||||||
| CLM4 | [-] | 295. | 295. | 296. | 295. | 297. | 0.0992 | 0.933 | 0.410 | 0.687 | 0.827 | 0.948 | 1.00 | 0.918 | 0.868 | ||
| CLM4.5 | [-] | 295. | 295. | 296. | 295. | 297. | 0.336 | 0.850 | 0.334 | 0.718 | 0.853 | 0.960 | 0.999 | 0.929 | 0.885 | ||
| CLM5 | [-] | 296. | 295. | 297. | 295. | 297. | 0.445 | 0.865 | 0.404 | 0.708 | 0.867 | 0.945 | 1.00 | 0.948 | 0.889 |
Download Data |
Period Mean (original grids) [K] |
Model Period Mean (intersection) [K] |
Model Period Mean (complement) [K] |
Benchmark Period Mean (intersection) [K] |
Benchmark Period Mean (complement) [K] |
Bias [K] |
RMSE [K] |
Phase Shift [months] |
Bias Score [1] |
RMSE Score [1] |
Seasonal Cycle Score [1] |
Spatial Distribution Score [1] |
Interannual Variability Score [1] |
Overall Score [1] |
|||
|---|---|---|---|---|---|---|---|---|---|---|---|---|---|---|---|---|---|
| Benchmark | [-] | 262. | |||||||||||||||
| CLM4 | [-] | 258. | 258. | 262. | 262. | 266. | -2.90 | 3.47 | 0.0203 | 0.830 | 0.894 | 0.999 | 0.996 | 0.916 | 0.921 | ||
| CLM4.5 | [-] | 259. | 259. | 262. | 262. | 266. | -2.58 | 3.20 | 0.0161 | 0.846 | 0.895 | 0.999 | 0.996 | 0.912 | 0.924 | ||
| CLM5 | [-] | 260. | 260. | 263. | 262. | 266. | -1.00 | 1.60 | 0.0159 | 0.921 | 0.943 | 0.999 | 0.999 | 0.921 | 0.954 |
Download Data |
Period Mean (original grids) [K] |
Model Period Mean (intersection) [K] |
Model Period Mean (complement) [K] |
Benchmark Period Mean (intersection) [K] |
Benchmark Period Mean (complement) [K] |
Bias [K] |
RMSE [K] |
Phase Shift [months] |
Bias Score [1] |
RMSE Score [1] |
Seasonal Cycle Score [1] |
Spatial Distribution Score [1] |
Interannual Variability Score [1] |
Overall Score [1] |
|||
|---|---|---|---|---|---|---|---|---|---|---|---|---|---|---|---|---|---|
| Benchmark | [-] | 299. | |||||||||||||||
| CLM4 | [-] | 298. | 298. | 299. | 299. | 299. | -0.555 | 1.01 | 0.773 | 0.330 | 0.604 | 0.890 | 0.973 | 0.850 | 0.708 | ||
| CLM4.5 | [-] | 299. | 298. | 299. | 299. | 299. | -0.452 | 0.944 | 0.717 | 0.354 | 0.620 | 0.899 | 0.978 | 0.864 | 0.723 | ||
| CLM5 | [-] | 299. | 299. | 300. | 299. | 299. | -0.0330 | 0.793 | 0.616 | 0.415 | 0.681 | 0.912 | 0.996 | 0.880 | 0.761 |
Download Data |
Period Mean (original grids) [K] |
Model Period Mean (intersection) [K] |
Model Period Mean (complement) [K] |
Benchmark Period Mean (intersection) [K] |
Benchmark Period Mean (complement) [K] |
Bias [K] |
RMSE [K] |
Phase Shift [months] |
Bias Score [1] |
RMSE Score [1] |
Seasonal Cycle Score [1] |
Spatial Distribution Score [1] |
Interannual Variability Score [1] |
Overall Score [1] |
|||
|---|---|---|---|---|---|---|---|---|---|---|---|---|---|---|---|---|---|
| Benchmark | [-] | 271. | |||||||||||||||
| CLM4 | [-] | 269. | 269. | 273. | 271. | 274. | -2.43 | 2.85 | 0.00954 | 0.839 | 0.906 | 0.999 | 0.997 | 0.969 | 0.936 | ||
| CLM4.5 | [-] | 269. | 269. | 273. | 271. | 274. | -2.28 | 2.73 | 0.00954 | 0.847 | 0.906 | 0.999 | 0.998 | 0.971 | 0.938 | ||
| CLM5 | [-] | 271. | 270. | 274. | 271. | 274. | -0.737 | 1.06 | 0.00890 | 0.938 | 0.961 | 0.999 | 0.999 | 0.981 | 0.973 |
Download Data |
Period Mean (original grids) [K] |
Model Period Mean (intersection) [K] |
Model Period Mean (complement) [K] |
Benchmark Period Mean (intersection) [K] |
Benchmark Period Mean (complement) [K] |
Bias [K] |
RMSE [K] |
Phase Shift [months] |
Bias Score [1] |
RMSE Score [1] |
Seasonal Cycle Score [1] |
Spatial Distribution Score [1] |
Interannual Variability Score [1] |
Overall Score [1] |
|||
|---|---|---|---|---|---|---|---|---|---|---|---|---|---|---|---|---|---|
| Benchmark | [-] | 280. | |||||||||||||||
| CLM4 | [-] | 279. | 279. | 287. | 280. | 285. | -0.945 | 1.80 | 0.0264 | 0.862 | 0.913 | 0.998 | 1.00 | 0.938 | 0.937 | ||
| CLM4.5 | [-] | 280. | 279. | 287. | 280. | 285. | -0.792 | 1.70 | 0.0264 | 0.870 | 0.915 | 0.998 | 1.00 | 0.942 | 0.940 | ||
| CLM5 | [-] | 280. | 280. | 287. | 280. | 285. | -0.0730 | 1.17 | 0.0271 | 0.900 | 0.948 | 0.998 | 1.00 | 0.963 | 0.960 |
Download Data |
Period Mean (original grids) [K] |
Model Period Mean (intersection) [K] |
Model Period Mean (complement) [K] |
Benchmark Period Mean (intersection) [K] |
Benchmark Period Mean (complement) [K] |
Bias [K] |
RMSE [K] |
Phase Shift [months] |
Bias Score [1] |
RMSE Score [1] |
Seasonal Cycle Score [1] |
Spatial Distribution Score [1] |
Interannual Variability Score [1] |
Overall Score [1] |
|||
|---|---|---|---|---|---|---|---|---|---|---|---|---|---|---|---|---|---|
| Benchmark | [-] | 297. | |||||||||||||||
| CLM4 | [-] | 296. | 296. | 300. | 297. | 300. | -0.323 | 1.31 | 0.180 | 0.742 | 0.847 | 0.982 | 0.988 | 0.909 | 0.886 | ||
| CLM4.5 | [-] | 297. | 297. | 300. | 297. | 300. | -0.121 | 1.24 | 0.181 | 0.747 | 0.855 | 0.982 | 0.993 | 0.919 | 0.892 | ||
| CLM5 | [-] | 297. | 297. | 300. | 297. | 300. | 0.195 | 1.12 | 0.170 | 0.749 | 0.886 | 0.983 | 0.998 | 0.940 | 0.907 |
Download Data |
Period Mean (original grids) [K] |
Model Period Mean (intersection) [K] |
Model Period Mean (complement) [K] |
Benchmark Period Mean (intersection) [K] |
Benchmark Period Mean (complement) [K] |
Bias [K] |
RMSE [K] |
Phase Shift [months] |
Bias Score [1] |
RMSE Score [1] |
Seasonal Cycle Score [1] |
Spatial Distribution Score [1] |
Interannual Variability Score [1] |
Overall Score [1] |
|||
|---|---|---|---|---|---|---|---|---|---|---|---|---|---|---|---|---|---|
| Benchmark | [-] | 264. | |||||||||||||||
| CLM4 | [-] | 261. | 261. | 262. | 264. | 264. | -3.09 | 3.70 | 0.00943 | 0.816 | 0.877 | 0.999 | 0.996 | 0.960 | 0.921 | ||
| CLM4.5 | [-] | 261. | 261. | 262. | 264. | 264. | -2.91 | 3.46 | 0.0496 | 0.825 | 0.886 | 0.997 | 0.997 | 0.960 | 0.925 | ||
| CLM5 | [-] | 263. | 263. | 264. | 264. | 264. | -1.09 | 1.43 | 0.0193 | 0.929 | 0.948 | 0.999 | 0.999 | 0.970 | 0.965 |
Download Data |
Period Mean (original grids) [K] |
Model Period Mean (intersection) [K] |
Model Period Mean (complement) [K] |
Benchmark Period Mean (intersection) [K] |
Benchmark Period Mean (complement) [K] |
Bias [K] |
RMSE [K] |
Phase Shift [months] |
Bias Score [1] |
RMSE Score [1] |
Seasonal Cycle Score [1] |
Spatial Distribution Score [1] |
Interannual Variability Score [1] |
Overall Score [1] |
|||
|---|---|---|---|---|---|---|---|---|---|---|---|---|---|---|---|---|---|
| Benchmark | [-] | 295. | |||||||||||||||
| CLM4 | [-] | 295. | 295. | 293. | 295. | 294. | 0.0117 | 0.641 | 0.110 | 0.898 | 0.914 | 0.992 | 0.997 | 0.935 | 0.942 | ||
| CLM4.5 | [-] | 295. | 295. | 293. | 295. | 294. | 0.00772 | 0.650 | 0.111 | 0.897 | 0.913 | 0.992 | 0.997 | 0.931 | 0.941 | ||
| CLM5 | [-] | 295. | 295. | 293. | 295. | 294. | 0.323 | 0.624 | 0.0892 | 0.890 | 0.929 | 0.994 | 0.999 | 0.950 | 0.949 |
Download Data |
Period Mean (original grids) [K] |
Model Period Mean (intersection) [K] |
Model Period Mean (complement) [K] |
Benchmark Period Mean (intersection) [K] |
Benchmark Period Mean (complement) [K] |
Bias [K] |
RMSE [K] |
Phase Shift [months] |
Bias Score [1] |
RMSE Score [1] |
Seasonal Cycle Score [1] |
Spatial Distribution Score [1] |
Interannual Variability Score [1] |
Overall Score [1] |
|||
|---|---|---|---|---|---|---|---|---|---|---|---|---|---|---|---|---|---|
| Benchmark | [-] | 282. | |||||||||||||||
| CLM4 | [-] | 281. | 281. | 283. | 282. | 286. | -1.00 | 1.69 | 0.124 | 0.836 | 0.870 | 0.992 | 0.980 | 0.906 | 0.909 | ||
| CLM4.5 | [-] | 281. | 281. | 283. | 282. | 286. | -1.02 | 1.67 | 0.128 | 0.834 | 0.874 | 0.991 | 0.985 | 0.908 | 0.911 | ||
| CLM5 | [-] | 281. | 281. | 284. | 282. | 286. | -0.172 | 0.983 | 0.147 | 0.893 | 0.924 | 0.990 | 0.997 | 0.946 | 0.946 |
Download Data |
Period Mean (original grids) [K] |
Model Period Mean (intersection) [K] |
Model Period Mean (complement) [K] |
Benchmark Period Mean (intersection) [K] |
Benchmark Period Mean (complement) [K] |
Bias [K] |
RMSE [K] |
Phase Shift [months] |
Bias Score [1] |
RMSE Score [1] |
Seasonal Cycle Score [1] |
Spatial Distribution Score [1] |
Interannual Variability Score [1] |
Overall Score [1] |
|||
|---|---|---|---|---|---|---|---|---|---|---|---|---|---|---|---|---|---|
| Benchmark | [-] | 287. | |||||||||||||||
| CLM4 | [-] | 281. | 286. | 243. | 287. | 292. | -0.921 | 1.65 | 0.173 | 0.770 | 0.859 | 0.981 | 0.993 | 0.931 | 0.899 | ||
| CLM4.5 | [-] | 281. | 286. | 243. | 287. | 292. | -0.792 | 1.58 | 0.164 | 0.782 | 0.865 | 0.983 | 0.993 | 0.936 | 0.904 | ||
| CLM5 | [-] | 282. | 286. | 244. | 287. | 292. | -0.107 | 1.02 | 0.157 | 0.821 | 0.900 | 0.982 | 0.998 | 0.952 | 0.926 |
Download Data |
Period Mean (original grids) [K] |
Model Period Mean (intersection) [K] |
Model Period Mean (complement) [K] |
Benchmark Period Mean (intersection) [K] |
Benchmark Period Mean (complement) [K] |
Bias [K] |
RMSE [K] |
Phase Shift [months] |
Bias Score [1] |
RMSE Score [1] |
Seasonal Cycle Score [1] |
Spatial Distribution Score [1] |
Interannual Variability Score [1] |
Overall Score [1] |
|||
|---|---|---|---|---|---|---|---|---|---|---|---|---|---|---|---|---|---|
| Benchmark | [-] | 296. | |||||||||||||||
| CLM4 | [-] | 296. | 296. | 296. | 296. | 297. | -0.125 | 1.01 | 0.152 | 0.882 | 0.921 | 0.989 | 1.00 | 0.958 | 0.945 | ||
| CLM4.5 | [-] | 296. | 296. | 296. | 296. | 297. | -0.0557 | 0.978 | 0.149 | 0.886 | 0.923 | 0.989 | 1.00 | 0.957 | 0.946 | ||
| CLM5 | [-] | 296. | 296. | 297. | 296. | 297. | 0.240 | 0.867 | 0.138 | 0.891 | 0.939 | 0.990 | 1.00 | 0.965 | 0.954 |
Download Data |
Period Mean (original grids) [K] |
Model Period Mean (intersection) [K] |
Model Period Mean (complement) [K] |
Benchmark Period Mean (intersection) [K] |
Benchmark Period Mean (complement) [K] |
Bias [K] |
RMSE [K] |
Phase Shift [months] |
Bias Score [1] |
RMSE Score [1] |
Seasonal Cycle Score [1] |
Spatial Distribution Score [1] |
Interannual Variability Score [1] |
Overall Score [1] |
|||
|---|---|---|---|---|---|---|---|---|---|---|---|---|---|---|---|---|---|
| Benchmark | [-] | 265. | |||||||||||||||
| CLM4 | [-] | 262. | 262. | 260. | 265. | 266. | -2.77 | 3.36 | 0.0230 | 0.809 | 0.871 | 0.998 | 0.994 | 0.942 | 0.914 | ||
| CLM4.5 | [-] | 262. | 262. | 260. | 265. | 266. | -2.60 | 3.21 | 0.0179 | 0.819 | 0.872 | 0.999 | 0.994 | 0.938 | 0.916 | ||
| CLM5 | [-] | 264. | 264. | 261. | 265. | 266. | -0.989 | 1.43 | 0.0106 | 0.920 | 0.935 | 0.999 | 0.998 | 0.945 | 0.955 |
Download Data |
Period Mean (original grids) [K] |
Model Period Mean (intersection) [K] |
Model Period Mean (complement) [K] |
Benchmark Period Mean (intersection) [K] |
Benchmark Period Mean (complement) [K] |
Bias [K] |
RMSE [K] |
Phase Shift [months] |
Bias Score [1] |
RMSE Score [1] |
Seasonal Cycle Score [1] |
Spatial Distribution Score [1] |
Interannual Variability Score [1] |
Overall Score [1] |
|||
|---|---|---|---|---|---|---|---|---|---|---|---|---|---|---|---|---|---|
| Benchmark | [-] | 296. | |||||||||||||||
| CLM4 | [-] | 295. | 295. | 298. | 296. | 298. | -0.0641 | 1.27 | 0.269 | 0.664 | 0.825 | 0.977 | 0.996 | 0.912 | 0.867 | ||
| CLM4.5 | [-] | 295. | 295. | 298. | 296. | 298. | -0.107 | 1.25 | 0.293 | 0.671 | 0.813 | 0.974 | 1.00 | 0.908 | 0.863 | ||
| CLM5 | [-] | 295. | 295. | 298. | 296. | 298. | 0.206 | 1.20 | 0.263 | 0.668 | 0.847 | 0.977 | 1.00 | 0.925 | 0.877 |
Download Data |
Period Mean (original grids) [K] |
Model Period Mean (intersection) [K] |
Model Period Mean (complement) [K] |
Benchmark Period Mean (intersection) [K] |
Benchmark Period Mean (complement) [K] |
Bias [K] |
RMSE [K] |
Phase Shift [months] |
Bias Score [1] |
RMSE Score [1] |
Seasonal Cycle Score [1] |
Spatial Distribution Score [1] |
Interannual Variability Score [1] |
Overall Score [1] |
|||
|---|---|---|---|---|---|---|---|---|---|---|---|---|---|---|---|---|---|
| Benchmark | [-] | 286. | |||||||||||||||
| CLM4 | [-] | 285. | 285. | 293. | 286. | 292. | -1.07 | 1.41 | 0.0428 | 0.880 | 0.914 | 0.997 | 0.997 | 0.952 | 0.942 | ||
| CLM4.5 | [-] | 285. | 285. | 293. | 286. | 292. | -0.971 | 1.35 | 0.0433 | 0.890 | 0.913 | 0.997 | 0.997 | 0.955 | 0.944 | ||
| CLM5 | [-] | 286. | 286. | 294. | 286. | 292. | -0.0907 | 0.670 | 0.0345 | 0.945 | 0.947 | 0.998 | 0.999 | 0.968 | 0.967 |
Download Data |
Period Mean (original grids) [K] |
Model Period Mean (intersection) [K] |
Model Period Mean (complement) [K] |
Benchmark Period Mean (intersection) [K] |
Benchmark Period Mean (complement) [K] |
Bias [K] |
RMSE [K] |
Phase Shift [months] |
Bias Score [1] |
RMSE Score [1] |
Seasonal Cycle Score [1] |
Spatial Distribution Score [1] |
Interannual Variability Score [1] |
Overall Score [1] |
|||
|---|---|---|---|---|---|---|---|---|---|---|---|---|---|---|---|---|---|
| Benchmark | [-] | 275. | |||||||||||||||
| CLM4 | [-] | 272. | 272. | 276. | 274. | 278. | -2.21 | 2.59 | 0.0546 | 0.814 | 0.895 | 0.996 | 0.974 | 0.964 | 0.923 | ||
| CLM4.5 | [-] | 272. | 272. | 276. | 274. | 278. | -2.08 | 2.48 | 0.0553 | 0.824 | 0.895 | 0.996 | 0.975 | 0.965 | 0.925 | ||
| CLM5 | [-] | 274. | 274. | 277. | 274. | 278. | -0.630 | 1.01 | 0.0424 | 0.923 | 0.947 | 0.997 | 0.995 | 0.971 | 0.964 |
Download Data |
Period Mean (original grids) [K] |
Model Period Mean (intersection) [K] |
Model Period Mean (complement) [K] |
Benchmark Period Mean (intersection) [K] |
Benchmark Period Mean (complement) [K] |
Bias [K] |
RMSE [K] |
Phase Shift [months] |
Bias Score [1] |
RMSE Score [1] |
Seasonal Cycle Score [1] |
Spatial Distribution Score [1] |
Interannual Variability Score [1] |
Overall Score [1] |
|||
|---|---|---|---|---|---|---|---|---|---|---|---|---|---|---|---|---|---|
| Benchmark | [-] | 284. | |||||||||||||||
| CLM4 | [-] | 282. | 283. | 286. | 284. | 286. | -0.886 | 1.75 | 0.0307 | 0.846 | 0.887 | 0.998 | 0.994 | 0.928 | 0.923 | ||
| CLM4.5 | [-] | 282. | 283. | 286. | 284. | 286. | -0.805 | 1.75 | 0.0295 | 0.851 | 0.879 | 0.998 | 0.996 | 0.932 | 0.922 | ||
| CLM5 | [-] | 283. | 283. | 287. | 284. | 286. | -0.0645 | 1.18 | 0.0249 | 0.883 | 0.924 | 0.998 | 1.00 | 0.965 | 0.949 |
Download Data |
Period Mean (original grids) [K] |
Model Period Mean (intersection) [K] |
Model Period Mean (complement) [K] |
Benchmark Period Mean (intersection) [K] |
Benchmark Period Mean (complement) [K] |
Bias [K] |
RMSE [K] |
Phase Shift [months] |
Bias Score [1] |
RMSE Score [1] |
Seasonal Cycle Score [1] |
Spatial Distribution Score [1] |
Interannual Variability Score [1] |
Overall Score [1] |
|||
|---|---|---|---|---|---|---|---|---|---|---|---|---|---|---|---|---|---|
| Benchmark | [-] | 299. | |||||||||||||||
| CLM4 | [-] | 298. | 298. | 300. | 299. | 299. | -0.539 | 0.965 | 0.523 | 0.534 | 0.723 | 0.925 | 0.979 | 0.901 | 0.797 | ||
| CLM4.5 | [-] | 299. | 299. | 300. | 299. | 299. | -0.364 | 0.863 | 0.491 | 0.596 | 0.732 | 0.932 | 0.982 | 0.911 | 0.814 | ||
| CLM5 | [-] | 299. | 299. | 300. | 299. | 299. | -0.0597 | 0.717 | 0.460 | 0.654 | 0.763 | 0.936 | 0.996 | 0.939 | 0.842 |
Download Data |
Period Mean (original grids) [K] |
Model Period Mean (intersection) [K] |
Model Period Mean (complement) [K] |
Benchmark Period Mean (intersection) [K] |
Benchmark Period Mean (complement) [K] |
Bias [K] |
RMSE [K] |
Phase Shift [months] |
Bias Score [1] |
RMSE Score [1] |
Seasonal Cycle Score [1] |
Spatial Distribution Score [1] |
Interannual Variability Score [1] |
Overall Score [1] |
|||
|---|---|---|---|---|---|---|---|---|---|---|---|---|---|---|---|---|---|
| Benchmark | [-] | 296. | |||||||||||||||
| CLM4 | [-] | 296. | 296. | 296. | 296. | 293. | -0.282 | 0.892 | 0.258 | 0.740 | 0.823 | 0.968 | 0.992 | 0.902 | 0.875 | ||
| CLM4.5 | [-] | 296. | 296. | 296. | 296. | 293. | -0.108 | 0.818 | 0.271 | 0.758 | 0.831 | 0.968 | 0.990 | 0.914 | 0.882 | ||
| CLM5 | [-] | 296. | 296. | 296. | 296. | 293. | 0.242 | 0.663 | 0.248 | 0.776 | 0.866 | 0.969 | 0.998 | 0.941 | 0.903 |
Download Data |
Period Mean (original grids) [K] |
Model Period Mean (intersection) [K] |
Model Period Mean (complement) [K] |
Benchmark Period Mean (intersection) [K] |
Benchmark Period Mean (complement) [K] |
Bias [K] |
RMSE [K] |
Phase Shift [months] |
Bias Score [1] |
RMSE Score [1] |
Seasonal Cycle Score [1] |
Spatial Distribution Score [1] |
Interannual Variability Score [1] |
Overall Score [1] |
|||
|---|---|---|---|---|---|---|---|---|---|---|---|---|---|---|---|---|---|
| Benchmark | [-] | 284. | |||||||||||||||
| CLM4 | [-] | 283. | 283. | 287. | 284. | 285. | -0.572 | 1.82 | 0.225 | 0.641 | 0.810 | 0.973 | 0.995 | 0.927 | 0.860 | ||
| CLM4.5 | [-] | 284. | 283. | 287. | 284. | 285. | -0.321 | 1.73 | 0.219 | 0.655 | 0.815 | 0.974 | 0.997 | 0.928 | 0.864 | ||
| CLM5 | [-] | 284. | 284. | 288. | 284. | 285. | 0.0843 | 1.53 | 0.206 | 0.670 | 0.855 | 0.975 | 0.999 | 0.942 | 0.883 |
Temporally integrated period mean