Mean State
Download Data |
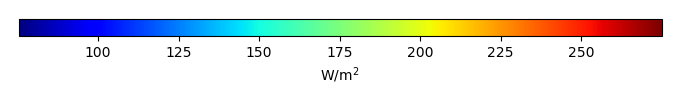
Period Mean (original grids) [W/m2] |
Model Period Mean (intersection) [W/m2] |
Model Period Mean (complement) [W/m2] |
Benchmark Period Mean (intersection) [W/m2] |
Benchmark Period Mean (complement) [W/m2] |
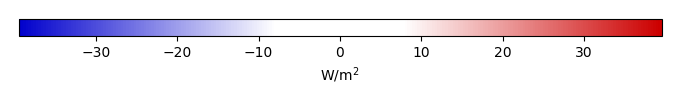
Bias [W/m2] |
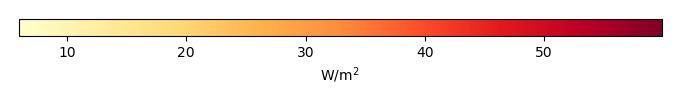
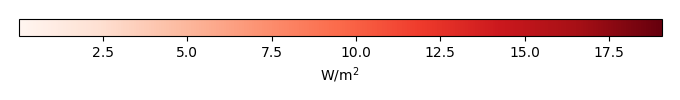
RMSE [W/m2] |
Phase Shift [months] |
Bias Score [1] |
RMSE Score [1] |
Seasonal Cycle Score [1] |
Spatial Distribution Score [1] |
Interannual Variability Score [1] |
Overall Score [1] |
|||
|---|---|---|---|---|---|---|---|---|---|---|---|---|---|---|---|---|---|
| Benchmark | [-] | 218. | |||||||||||||||
| CLM4 | [-] | 228. | 228. | 218. | 219. | 9.56 | 18.7 | 1.04 | 0.589 | 0.502 | 0.866 | 0.989 | 0.474 | 0.654 | |||
| CLM4.5 | [-] | 228. | 228. | 218. | 219. | 9.56 | 18.7 | 1.04 | 0.589 | 0.502 | 0.866 | 0.989 | 0.474 | 0.654 | |||
| CLM5 | [-] | 228. | 228. | 218. | 219. | 9.56 | 18.7 | 1.04 | 0.589 | 0.502 | 0.866 | 0.989 | 0.474 | 0.654 |
Download Data |
Period Mean (original grids) [W/m2] |
Model Period Mean (intersection) [W/m2] |
Model Period Mean (complement) [W/m2] |
Benchmark Period Mean (intersection) [W/m2] |
Benchmark Period Mean (complement) [W/m2] |
Bias [W/m2] |
RMSE [W/m2] |
Phase Shift [months] |
Bias Score [1] |
RMSE Score [1] |
Seasonal Cycle Score [1] |
Spatial Distribution Score [1] |
Interannual Variability Score [1] |
Overall Score [1] |
|||
|---|---|---|---|---|---|---|---|---|---|---|---|---|---|---|---|---|---|
| Benchmark | [-] | 243. | |||||||||||||||
| CLM4 | [-] | 245. | 245. | 243. | 228. | 2.40 | 20.3 | 0.724 | 0.586 | 0.543 | 0.930 | 0.972 | 0.739 | 0.719 | |||
| CLM4.5 | [-] | 245. | 245. | 243. | 228. | 2.40 | 20.3 | 0.724 | 0.586 | 0.543 | 0.930 | 0.972 | 0.739 | 0.719 | |||
| CLM5 | [-] | 245. | 245. | 243. | 228. | 2.40 | 20.3 | 0.724 | 0.586 | 0.543 | 0.930 | 0.972 | 0.739 | 0.719 |
Download Data |
Period Mean (original grids) [W/m2] |
Model Period Mean (intersection) [W/m2] |
Model Period Mean (complement) [W/m2] |
Benchmark Period Mean (intersection) [W/m2] |
Benchmark Period Mean (complement) [W/m2] |
Bias [W/m2] |
RMSE [W/m2] |
Phase Shift [months] |
Bias Score [1] |
RMSE Score [1] |
Seasonal Cycle Score [1] |
Spatial Distribution Score [1] |
Interannual Variability Score [1] |
Overall Score [1] |
|||
|---|---|---|---|---|---|---|---|---|---|---|---|---|---|---|---|---|---|
| Benchmark | [-] | 233. | |||||||||||||||
| CLM4 | [-] | 232. | 232. | 233. | 234. | -0.895 | 18.3 | 0.994 | 0.735 | 0.586 | 0.860 | 0.887 | 0.534 | 0.698 | |||
| CLM4.5 | [-] | 232. | 232. | 233. | 234. | -0.895 | 18.3 | 0.994 | 0.735 | 0.586 | 0.860 | 0.887 | 0.534 | 0.698 | |||
| CLM5 | [-] | 232. | 232. | 233. | 234. | -0.895 | 18.3 | 0.994 | 0.735 | 0.586 | 0.860 | 0.887 | 0.534 | 0.698 |
Download Data |
Period Mean (original grids) [W/m2] |
Model Period Mean (intersection) [W/m2] |
Model Period Mean (complement) [W/m2] |
Benchmark Period Mean (intersection) [W/m2] |
Benchmark Period Mean (complement) [W/m2] |
Bias [W/m2] |
RMSE [W/m2] |
Phase Shift [months] |
Bias Score [1] |
RMSE Score [1] |
Seasonal Cycle Score [1] |
Spatial Distribution Score [1] |
Interannual Variability Score [1] |
Overall Score [1] |
|||
|---|---|---|---|---|---|---|---|---|---|---|---|---|---|---|---|---|---|
| Benchmark | [-] | 111. | |||||||||||||||
| CLM4 | [-] | 112. | 112. | 112. | 108. | -0.236 | 22.5 | 0.895 | 0.956 | 0.783 | 0.937 | 0.976 | 0.589 | 0.837 | |||
| CLM4.5 | [-] | 112. | 112. | 112. | 108. | -0.236 | 22.5 | 0.895 | 0.956 | 0.783 | 0.937 | 0.976 | 0.589 | 0.837 | |||
| CLM5 | [-] | 112. | 112. | 112. | 108. | -0.236 | 22.5 | 0.895 | 0.956 | 0.783 | 0.937 | 0.976 | 0.589 | 0.837 |
Download Data |
Period Mean (original grids) [W/m2] |
Model Period Mean (intersection) [W/m2] |
Model Period Mean (complement) [W/m2] |
Benchmark Period Mean (intersection) [W/m2] |
Benchmark Period Mean (complement) [W/m2] |
Bias [W/m2] |
RMSE [W/m2] |
Phase Shift [months] |
Bias Score [1] |
RMSE Score [1] |
Seasonal Cycle Score [1] |
Spatial Distribution Score [1] |
Interannual Variability Score [1] |
Overall Score [1] |
|||
|---|---|---|---|---|---|---|---|---|---|---|---|---|---|---|---|---|---|
| Benchmark | [-] | 212. | |||||||||||||||
| CLM4 | [-] | 216. | 216. | 209. | 219. | 9.22 | 20.2 | 1.45 | 0.609 | 0.448 | 0.776 | 0.999 | 0.523 | 0.634 | |||
| CLM4.5 | [-] | 216. | 216. | 209. | 219. | 9.22 | 20.2 | 1.45 | 0.609 | 0.448 | 0.776 | 0.999 | 0.523 | 0.634 | |||
| CLM5 | [-] | 216. | 216. | 209. | 219. | 9.22 | 20.2 | 1.45 | 0.609 | 0.448 | 0.776 | 0.999 | 0.523 | 0.634 |
Download Data |
Period Mean (original grids) [W/m2] |
Model Period Mean (intersection) [W/m2] |
Model Period Mean (complement) [W/m2] |
Benchmark Period Mean (intersection) [W/m2] |
Benchmark Period Mean (complement) [W/m2] |
Bias [W/m2] |
RMSE [W/m2] |
Phase Shift [months] |
Bias Score [1] |
RMSE Score [1] |
Seasonal Cycle Score [1] |
Spatial Distribution Score [1] |
Interannual Variability Score [1] |
Overall Score [1] |
|||
|---|---|---|---|---|---|---|---|---|---|---|---|---|---|---|---|---|---|
| Benchmark | [-] | 126. | |||||||||||||||
| CLM4 | [-] | 134. | 134. | 126. | 139. | 8.17 | 22.1 | 0.380 | 0.887 | 0.785 | 0.969 | 0.987 | 0.676 | 0.848 | |||
| CLM4.5 | [-] | 134. | 134. | 126. | 139. | 8.17 | 22.1 | 0.380 | 0.887 | 0.785 | 0.969 | 0.987 | 0.676 | 0.848 | |||
| CLM5 | [-] | 134. | 134. | 126. | 139. | 8.17 | 22.1 | 0.380 | 0.887 | 0.785 | 0.969 | 0.987 | 0.676 | 0.848 |
Download Data |
Period Mean (original grids) [W/m2] |
Model Period Mean (intersection) [W/m2] |
Model Period Mean (complement) [W/m2] |
Benchmark Period Mean (intersection) [W/m2] |
Benchmark Period Mean (complement) [W/m2] |
Bias [W/m2] |
RMSE [W/m2] |
Phase Shift [months] |
Bias Score [1] |
RMSE Score [1] |
Seasonal Cycle Score [1] |
Spatial Distribution Score [1] |
Interannual Variability Score [1] |
Overall Score [1] |
|||
|---|---|---|---|---|---|---|---|---|---|---|---|---|---|---|---|---|---|
| Benchmark | [-] | 174. | |||||||||||||||
| CLM4 | [-] | 188. | 188. | 175. | 164. | 12.5 | 26.7 | 0.468 | 0.744 | 0.758 | 0.960 | 0.817 | 0.673 | 0.785 | |||
| CLM4.5 | [-] | 188. | 188. | 175. | 164. | 12.5 | 26.7 | 0.468 | 0.744 | 0.758 | 0.960 | 0.817 | 0.673 | 0.785 | |||
| CLM5 | [-] | 188. | 188. | 175. | 164. | 12.5 | 26.7 | 0.468 | 0.744 | 0.758 | 0.960 | 0.817 | 0.673 | 0.785 |
Download Data |
Period Mean (original grids) [W/m2] |
Model Period Mean (intersection) [W/m2] |
Model Period Mean (complement) [W/m2] |
Benchmark Period Mean (intersection) [W/m2] |
Benchmark Period Mean (complement) [W/m2] |
Bias [W/m2] |
RMSE [W/m2] |
Phase Shift [months] |
Bias Score [1] |
RMSE Score [1] |
Seasonal Cycle Score [1] |
Spatial Distribution Score [1] |
Interannual Variability Score [1] |
Overall Score [1] |
|||
|---|---|---|---|---|---|---|---|---|---|---|---|---|---|---|---|---|---|
| Benchmark | [-] | 210. | |||||||||||||||
| CLM4 | [-] | 230. | 231. | 210. | 218. | 19.8 | 28.8 | 0.321 | 0.574 | 0.616 | 0.975 | 0.988 | 0.665 | 0.739 | |||
| CLM4.5 | [-] | 230. | 231. | 210. | 218. | 19.8 | 28.8 | 0.321 | 0.574 | 0.616 | 0.975 | 0.988 | 0.665 | 0.739 | |||
| CLM5 | [-] | 230. | 231. | 210. | 218. | 19.8 | 28.8 | 0.321 | 0.574 | 0.616 | 0.975 | 0.988 | 0.665 | 0.739 |
Download Data |
Period Mean (original grids) [W/m2] |
Model Period Mean (intersection) [W/m2] |
Model Period Mean (complement) [W/m2] |
Benchmark Period Mean (intersection) [W/m2] |
Benchmark Period Mean (complement) [W/m2] |
Bias [W/m2] |
RMSE [W/m2] |
Phase Shift [months] |
Bias Score [1] |
RMSE Score [1] |
Seasonal Cycle Score [1] |
Spatial Distribution Score [1] |
Interannual Variability Score [1] |
Overall Score [1] |
|||
|---|---|---|---|---|---|---|---|---|---|---|---|---|---|---|---|---|---|
| Benchmark | [-] | 98.9 | |||||||||||||||
| CLM4 | [-] | 103. | 103. | 99.3 | 90.5 | 3.33 | 23.2 | 0.920 | 0.944 | 0.784 | 0.920 | 0.950 | 0.605 | 0.831 | |||
| CLM4.5 | [-] | 103. | 103. | 99.3 | 90.5 | 3.33 | 23.2 | 0.920 | 0.944 | 0.784 | 0.920 | 0.950 | 0.605 | 0.831 | |||
| CLM5 | [-] | 103. | 103. | 99.3 | 90.5 | 3.33 | 23.2 | 0.920 | 0.944 | 0.784 | 0.920 | 0.950 | 0.605 | 0.831 |
Download Data |
Period Mean (original grids) [W/m2] |
Model Period Mean (intersection) [W/m2] |
Model Period Mean (complement) [W/m2] |
Benchmark Period Mean (intersection) [W/m2] |
Benchmark Period Mean (complement) [W/m2] |
Bias [W/m2] |
RMSE [W/m2] |
Phase Shift [months] |
Bias Score [1] |
RMSE Score [1] |
Seasonal Cycle Score [1] |
Spatial Distribution Score [1] |
Interannual Variability Score [1] |
Overall Score [1] |
|||
|---|---|---|---|---|---|---|---|---|---|---|---|---|---|---|---|---|---|
| Benchmark | [-] | 235. | |||||||||||||||
| CLM4 | [-] | 237. | 237. | 237. | 210. | -2.50 | 15.4 | 0.485 | 0.880 | 0.786 | 0.966 | 0.965 | 0.682 | 0.844 | |||
| CLM4.5 | [-] | 237. | 237. | 237. | 210. | -2.50 | 15.4 | 0.485 | 0.880 | 0.786 | 0.966 | 0.965 | 0.682 | 0.844 | |||
| CLM5 | [-] | 237. | 237. | 237. | 210. | -2.50 | 15.4 | 0.485 | 0.880 | 0.786 | 0.966 | 0.965 | 0.682 | 0.844 |
Download Data |
Period Mean (original grids) [W/m2] |
Model Period Mean (intersection) [W/m2] |
Model Period Mean (complement) [W/m2] |
Benchmark Period Mean (intersection) [W/m2] |
Benchmark Period Mean (complement) [W/m2] |
Bias [W/m2] |
RMSE [W/m2] |
Phase Shift [months] |
Bias Score [1] |
RMSE Score [1] |
Seasonal Cycle Score [1] |
Spatial Distribution Score [1] |
Interannual Variability Score [1] |
Overall Score [1] |
|||
|---|---|---|---|---|---|---|---|---|---|---|---|---|---|---|---|---|---|
| Benchmark | [-] | 140. | |||||||||||||||
| CLM4 | [-] | 159. | 159. | 138. | 155. | 20.3 | 27.3 | 0.255 | 0.765 | 0.826 | 0.983 | 0.997 | 0.697 | 0.849 | |||
| CLM4.5 | [-] | 159. | 159. | 138. | 155. | 20.3 | 27.3 | 0.255 | 0.765 | 0.826 | 0.983 | 0.997 | 0.697 | 0.849 | |||
| CLM5 | [-] | 159. | 159. | 138. | 155. | 20.3 | 27.3 | 0.255 | 0.765 | 0.826 | 0.983 | 0.997 | 0.697 | 0.849 |
Download Data |
Period Mean (original grids) [W/m2] |
Model Period Mean (intersection) [W/m2] |
Model Period Mean (complement) [W/m2] |
Benchmark Period Mean (intersection) [W/m2] |
Benchmark Period Mean (complement) [W/m2] |
Bias [W/m2] |
RMSE [W/m2] |
Phase Shift [months] |
Bias Score [1] |
RMSE Score [1] |
Seasonal Cycle Score [1] |
Spatial Distribution Score [1] |
Interannual Variability Score [1] |
Overall Score [1] |
|||
|---|---|---|---|---|---|---|---|---|---|---|---|---|---|---|---|---|---|
| Benchmark | [-] | 187. | |||||||||||||||
| CLM4 | [-] | 191. | 191. | 186. | 187. | 3.66 | 21.8 | 0.562 | 0.783 | 0.720 | 0.941 | 0.997 | 0.586 | 0.791 | |||
| CLM4.5 | [-] | 191. | 191. | 186. | 187. | 3.66 | 21.8 | 0.562 | 0.783 | 0.720 | 0.941 | 0.997 | 0.586 | 0.791 | |||
| CLM5 | [-] | 191. | 191. | 186. | 187. | 3.66 | 21.8 | 0.562 | 0.783 | 0.720 | 0.941 | 0.997 | 0.586 | 0.791 |
Download Data |
Period Mean (original grids) [W/m2] |
Model Period Mean (intersection) [W/m2] |
Model Period Mean (complement) [W/m2] |
Benchmark Period Mean (intersection) [W/m2] |
Benchmark Period Mean (complement) [W/m2] |
Bias [W/m2] |
RMSE [W/m2] |
Phase Shift [months] |
Bias Score [1] |
RMSE Score [1] |
Seasonal Cycle Score [1] |
Spatial Distribution Score [1] |
Interannual Variability Score [1] |
Overall Score [1] |
|||
|---|---|---|---|---|---|---|---|---|---|---|---|---|---|---|---|---|---|
| Benchmark | [-] | 249. | |||||||||||||||
| CLM4 | [-] | 249. | 249. | 250. | 234. | -1.83 | 17.2 | 0.387 | 0.815 | 0.778 | 0.969 | 0.994 | 0.711 | 0.841 | |||
| CLM4.5 | [-] | 249. | 249. | 250. | 234. | -1.83 | 17.2 | 0.387 | 0.815 | 0.778 | 0.969 | 0.994 | 0.711 | 0.841 | |||
| CLM5 | [-] | 249. | 249. | 250. | 234. | -1.83 | 17.2 | 0.387 | 0.815 | 0.778 | 0.969 | 0.994 | 0.711 | 0.841 |
Download Data |
Period Mean (original grids) [W/m2] |
Model Period Mean (intersection) [W/m2] |
Model Period Mean (complement) [W/m2] |
Benchmark Period Mean (intersection) [W/m2] |
Benchmark Period Mean (complement) [W/m2] |
Bias [W/m2] |
RMSE [W/m2] |
Phase Shift [months] |
Bias Score [1] |
RMSE Score [1] |
Seasonal Cycle Score [1] |
Spatial Distribution Score [1] |
Interannual Variability Score [1] |
Overall Score [1] |
|||
|---|---|---|---|---|---|---|---|---|---|---|---|---|---|---|---|---|---|
| Benchmark | [-] | 116. | |||||||||||||||
| CLM4 | [-] | 118. | 117. | 116. | 114. | 0.677 | 23.1 | 0.623 | 0.950 | 0.788 | 0.955 | 0.960 | 0.448 | 0.815 | |||
| CLM4.5 | [-] | 118. | 117. | 116. | 114. | 0.677 | 23.1 | 0.623 | 0.950 | 0.788 | 0.955 | 0.960 | 0.448 | 0.815 | |||
| CLM5 | [-] | 118. | 117. | 116. | 114. | 0.677 | 23.1 | 0.623 | 0.950 | 0.788 | 0.955 | 0.960 | 0.448 | 0.815 |
Download Data |
Period Mean (original grids) [W/m2] |
Model Period Mean (intersection) [W/m2] |
Model Period Mean (complement) [W/m2] |
Benchmark Period Mean (intersection) [W/m2] |
Benchmark Period Mean (complement) [W/m2] |
Bias [W/m2] |
RMSE [W/m2] |
Phase Shift [months] |
Bias Score [1] |
RMSE Score [1] |
Seasonal Cycle Score [1] |
Spatial Distribution Score [1] |
Interannual Variability Score [1] |
Overall Score [1] |
|||
|---|---|---|---|---|---|---|---|---|---|---|---|---|---|---|---|---|---|
| Benchmark | [-] | 230. | |||||||||||||||
| CLM4 | [-] | 224. | 224. | 229. | 232. | -4.21 | 25.5 | 0.839 | 0.652 | 0.657 | 0.920 | 0.695 | 0.677 | 0.710 | |||
| CLM4.5 | [-] | 224. | 224. | 229. | 232. | -4.21 | 25.5 | 0.839 | 0.652 | 0.657 | 0.920 | 0.695 | 0.677 | 0.710 | |||
| CLM5 | [-] | 224. | 224. | 229. | 232. | -4.21 | 25.5 | 0.839 | 0.652 | 0.657 | 0.920 | 0.695 | 0.677 | 0.710 |
Download Data |
Period Mean (original grids) [W/m2] |
Model Period Mean (intersection) [W/m2] |
Model Period Mean (complement) [W/m2] |
Benchmark Period Mean (intersection) [W/m2] |
Benchmark Period Mean (complement) [W/m2] |
Bias [W/m2] |
RMSE [W/m2] |
Phase Shift [months] |
Bias Score [1] |
RMSE Score [1] |
Seasonal Cycle Score [1] |
Spatial Distribution Score [1] |
Interannual Variability Score [1] |
Overall Score [1] |
|||
|---|---|---|---|---|---|---|---|---|---|---|---|---|---|---|---|---|---|
| Benchmark | [-] | 177. | |||||||||||||||
| CLM4 | [-] | 185. | 185. | 176. | 204. | 10.0 | 19.0 | 0.369 | 0.852 | 0.795 | 0.976 | 0.973 | 0.479 | 0.812 | |||
| CLM4.5 | [-] | 185. | 185. | 176. | 204. | 10.0 | 19.0 | 0.369 | 0.852 | 0.795 | 0.976 | 0.973 | 0.479 | 0.812 | |||
| CLM5 | [-] | 185. | 185. | 176. | 204. | 10.0 | 19.0 | 0.369 | 0.852 | 0.795 | 0.976 | 0.973 | 0.479 | 0.812 |
Download Data |
Period Mean (original grids) [W/m2] |
Model Period Mean (intersection) [W/m2] |
Model Period Mean (complement) [W/m2] |
Benchmark Period Mean (intersection) [W/m2] |
Benchmark Period Mean (complement) [W/m2] |
Bias [W/m2] |
RMSE [W/m2] |
Phase Shift [months] |
Bias Score [1] |
RMSE Score [1] |
Seasonal Cycle Score [1] |
Spatial Distribution Score [1] |
Interannual Variability Score [1] |
Overall Score [1] |
|||
|---|---|---|---|---|---|---|---|---|---|---|---|---|---|---|---|---|---|
| Benchmark | [-] | 136. | |||||||||||||||
| CLM4 | [-] | 149. | 149. | 137. | 128. | 12.1 | 23.2 | 0.321 | 0.851 | 0.791 | 0.977 | 0.980 | 0.488 | 0.813 | |||
| CLM4.5 | [-] | 149. | 149. | 137. | 128. | 12.1 | 23.2 | 0.321 | 0.851 | 0.791 | 0.977 | 0.980 | 0.488 | 0.813 | |||
| CLM5 | [-] | 149. | 149. | 137. | 128. | 12.1 | 23.2 | 0.321 | 0.851 | 0.791 | 0.977 | 0.980 | 0.488 | 0.813 |
Download Data |
Period Mean (original grids) [W/m2] |
Model Period Mean (intersection) [W/m2] |
Model Period Mean (complement) [W/m2] |
Benchmark Period Mean (intersection) [W/m2] |
Benchmark Period Mean (complement) [W/m2] |
Bias [W/m2] |
RMSE [W/m2] |
Phase Shift [months] |
Bias Score [1] |
RMSE Score [1] |
Seasonal Cycle Score [1] |
Spatial Distribution Score [1] |
Interannual Variability Score [1] |
Overall Score [1] |
|||
|---|---|---|---|---|---|---|---|---|---|---|---|---|---|---|---|---|---|
| Benchmark | [-] | 199. | |||||||||||||||
| CLM4 | [-] | 190. | 190. | 200. | 176. | -10.0 | 19.6 | 0.240 | 0.867 | 0.816 | 0.984 | 0.929 | 0.522 | 0.822 | |||
| CLM4.5 | [-] | 190. | 190. | 200. | 176. | -10.0 | 19.6 | 0.240 | 0.867 | 0.816 | 0.984 | 0.929 | 0.522 | 0.822 | |||
| CLM5 | [-] | 190. | 190. | 200. | 176. | -10.0 | 19.6 | 0.240 | 0.867 | 0.816 | 0.984 | 0.929 | 0.522 | 0.822 |
Download Data |
Period Mean (original grids) [W/m2] |
Model Period Mean (intersection) [W/m2] |
Model Period Mean (complement) [W/m2] |
Benchmark Period Mean (intersection) [W/m2] |
Benchmark Period Mean (complement) [W/m2] |
Bias [W/m2] |
RMSE [W/m2] |
Phase Shift [months] |
Bias Score [1] |
RMSE Score [1] |
Seasonal Cycle Score [1] |
Spatial Distribution Score [1] |
Interannual Variability Score [1] |
Overall Score [1] |
|||
|---|---|---|---|---|---|---|---|---|---|---|---|---|---|---|---|---|---|
| Benchmark | [-] | 206. | |||||||||||||||
| CLM4 | [-] | 211. | 211. | 206. | 229. | 6.29 | 19.0 | 1.42 | 0.617 | 0.471 | 0.792 | 0.935 | 0.578 | 0.644 | |||
| CLM4.5 | [-] | 211. | 211. | 206. | 229. | 6.29 | 19.0 | 1.42 | 0.617 | 0.471 | 0.792 | 0.935 | 0.578 | 0.644 | |||
| CLM5 | [-] | 211. | 211. | 206. | 229. | 6.29 | 19.0 | 1.42 | 0.617 | 0.471 | 0.792 | 0.935 | 0.578 | 0.644 |
Download Data |
Period Mean (original grids) [W/m2] |
Model Period Mean (intersection) [W/m2] |
Model Period Mean (complement) [W/m2] |
Benchmark Period Mean (intersection) [W/m2] |
Benchmark Period Mean (complement) [W/m2] |
Bias [W/m2] |
RMSE [W/m2] |
Phase Shift [months] |
Bias Score [1] |
RMSE Score [1] |
Seasonal Cycle Score [1] |
Spatial Distribution Score [1] |
Interannual Variability Score [1] |
Overall Score [1] |
|||
|---|---|---|---|---|---|---|---|---|---|---|---|---|---|---|---|---|---|
| Benchmark | [-] | 216. | |||||||||||||||
| CLM4 | [-] | 219. | 219. | 216. | 214. | 2.76 | 22.3 | 0.857 | 0.708 | 0.635 | 0.904 | 0.824 | 0.515 | 0.704 | |||
| CLM4.5 | [-] | 219. | 219. | 216. | 214. | 2.76 | 22.3 | 0.857 | 0.708 | 0.635 | 0.904 | 0.824 | 0.515 | 0.704 | |||
| CLM5 | [-] | 219. | 219. | 216. | 214. | 2.76 | 22.3 | 0.857 | 0.708 | 0.635 | 0.904 | 0.824 | 0.515 | 0.704 |
Download Data |
Period Mean (original grids) [W/m2] |
Model Period Mean (intersection) [W/m2] |
Model Period Mean (complement) [W/m2] |
Benchmark Period Mean (intersection) [W/m2] |
Benchmark Period Mean (complement) [W/m2] |
Bias [W/m2] |
RMSE [W/m2] |
Phase Shift [months] |
Bias Score [1] |
RMSE Score [1] |
Seasonal Cycle Score [1] |
Spatial Distribution Score [1] |
Interannual Variability Score [1] |
Overall Score [1] |
|||
|---|---|---|---|---|---|---|---|---|---|---|---|---|---|---|---|---|---|
| Benchmark | [-] | 208. | |||||||||||||||
| CLM4 | [-] | 212. | 212. | 211. | 183. | -2.59 | 30.2 | 0.416 | 0.695 | 0.708 | 0.958 | 0.772 | 0.650 | 0.748 | |||
| CLM4.5 | [-] | 212. | 212. | 211. | 183. | -2.59 | 30.2 | 0.416 | 0.695 | 0.708 | 0.958 | 0.772 | 0.650 | 0.748 | |||
| CLM5 | [-] | 212. | 212. | 211. | 183. | -2.59 | 30.2 | 0.416 | 0.695 | 0.708 | 0.958 | 0.772 | 0.650 | 0.748 |
Temporally integrated period mean