Mean State
Download Data |
Period Mean (original grids) [W/m2] |
Model Period Mean (intersection) [W/m2] |
Model Period Mean (complement) [W/m2] |
Benchmark Period Mean (intersection) [W/m2] |
Benchmark Period Mean (complement) [W/m2] |
Bias [W/m2] |
RMSE [W/m2] |
Phase Shift [months] |
Bias Score [1] |
RMSE Score [1] |
Seasonal Cycle Score [1] |
Spatial Distribution Score [1] |
Interannual Variability Score [1] |
Overall Score [1] |
|||
|---|---|---|---|---|---|---|---|---|---|---|---|---|---|---|---|---|---|
| Benchmark | [-] | -56.1 | |||||||||||||||
| CLM4 | [-] | -50.6 | -50.2 | -56.5 | -49.8 | 6.74 | 17.3 | 2.37 | 0.408 | 0.416 | 0.623 | 0.852 | 0.527 | 0.540 | |||
| CLM4.5 | [-] | -54.5 | -54.5 | -56.5 | -49.8 | 2.79 | 17.3 | 2.22 | 0.405 | 0.414 | 0.652 | 0.850 | 0.531 | 0.544 | |||
| CLM5 | [-] | -55.9 | -55.7 | -56.5 | -49.8 | 1.45 | 15.5 | 2.25 | 0.492 | 0.419 | 0.647 | 0.894 | 0.515 | 0.564 |
Download Data |
Period Mean (original grids) [W/m2] |
Model Period Mean (intersection) [W/m2] |
Model Period Mean (complement) [W/m2] |
Benchmark Period Mean (intersection) [W/m2] |
Benchmark Period Mean (complement) [W/m2] |
Bias [W/m2] |
RMSE [W/m2] |
Phase Shift [months] |
Bias Score [1] |
RMSE Score [1] |
Seasonal Cycle Score [1] |
Spatial Distribution Score [1] |
Interannual Variability Score [1] |
Overall Score [1] |
|||
|---|---|---|---|---|---|---|---|---|---|---|---|---|---|---|---|---|---|
| Benchmark | [-] | -75.5 | |||||||||||||||
| CLM4 | [-] | -82.5 | -83.3 | -75.8 | -54.3 | -7.18 | 18.9 | 0.310 | 0.700 | 0.563 | 0.971 | 0.977 | 0.566 | 0.723 | |||
| CLM4.5 | [-] | -87.6 | -88.3 | -75.8 | -54.3 | -12.1 | 20.4 | 0.396 | 0.633 | 0.571 | 0.965 | 0.980 | 0.564 | 0.714 | |||
| CLM5 | [-] | -89.2 | -90.0 | -75.8 | -54.3 | -13.8 | 21.4 | 0.357 | 0.609 | 0.568 | 0.967 | 0.991 | 0.527 | 0.705 |
Download Data |
Period Mean (original grids) [W/m2] |
Model Period Mean (intersection) [W/m2] |
Model Period Mean (complement) [W/m2] |
Benchmark Period Mean (intersection) [W/m2] |
Benchmark Period Mean (complement) [W/m2] |
Bias [W/m2] |
RMSE [W/m2] |
Phase Shift [months] |
Bias Score [1] |
RMSE Score [1] |
Seasonal Cycle Score [1] |
Spatial Distribution Score [1] |
Interannual Variability Score [1] |
Overall Score [1] |
|||
|---|---|---|---|---|---|---|---|---|---|---|---|---|---|---|---|---|---|
| Benchmark | [-] | -76.3 | |||||||||||||||
| CLM4 | [-] | -76.5 | -76.6 | -77.0 | -61.8 | 1.94 | 17.3 | 1.63 | 0.679 | 0.502 | 0.772 | 0.976 | 0.525 | 0.659 | |||
| CLM4.5 | [-] | -82.1 | -82.2 | -77.0 | -61.8 | -3.07 | 17.9 | 1.59 | 0.660 | 0.497 | 0.778 | 0.990 | 0.540 | 0.660 | |||
| CLM5 | [-] | -80.4 | -80.6 | -77.0 | -61.8 | -1.62 | 18.1 | 1.36 | 0.666 | 0.486 | 0.821 | 0.986 | 0.491 | 0.656 |
Download Data |
Period Mean (original grids) [W/m2] |
Model Period Mean (intersection) [W/m2] |
Model Period Mean (complement) [W/m2] |
Benchmark Period Mean (intersection) [W/m2] |
Benchmark Period Mean (complement) [W/m2] |
Bias [W/m2] |
RMSE [W/m2] |
Phase Shift [months] |
Bias Score [1] |
RMSE Score [1] |
Seasonal Cycle Score [1] |
Spatial Distribution Score [1] |
Interannual Variability Score [1] |
Overall Score [1] |
|||
|---|---|---|---|---|---|---|---|---|---|---|---|---|---|---|---|---|---|
| Benchmark | [-] | -36.2 | |||||||||||||||
| CLM4 | [-] | -52.7 | -52.7 | -35.9 | -39.8 | -16.9 | 24.7 | 1.67 | 0.368 | 0.360 | 0.783 | 0.561 | 0.576 | 0.501 | |||
| CLM4.5 | [-] | -54.4 | -54.4 | -35.9 | -39.8 | -18.2 | 24.5 | 1.70 | 0.335 | 0.392 | 0.777 | 0.719 | 0.543 | 0.526 | |||
| CLM5 | [-] | -60.6 | -60.6 | -35.9 | -39.8 | -24.4 | 28.7 | 1.67 | 0.229 | 0.423 | 0.789 | 0.567 | 0.509 | 0.490 |
Download Data |
Period Mean (original grids) [W/m2] |
Model Period Mean (intersection) [W/m2] |
Model Period Mean (complement) [W/m2] |
Benchmark Period Mean (intersection) [W/m2] |
Benchmark Period Mean (complement) [W/m2] |
Bias [W/m2] |
RMSE [W/m2] |
Phase Shift [months] |
Bias Score [1] |
RMSE Score [1] |
Seasonal Cycle Score [1] |
Spatial Distribution Score [1] |
Interannual Variability Score [1] |
Overall Score [1] |
|||
|---|---|---|---|---|---|---|---|---|---|---|---|---|---|---|---|---|---|
| Benchmark | [-] | -46.4 | |||||||||||||||
| CLM4 | [-] | -22.8 | -22.8 | -45.1 | -51.0 | 22.5 | 24.7 | 2.38 | 0.0990 | 0.369 | 0.629 | 0.968 | 0.479 | 0.485 | |||
| CLM4.5 | [-] | -24.3 | -24.2 | -45.1 | -51.0 | 21.5 | 23.9 | 2.42 | 0.111 | 0.370 | 0.623 | 0.971 | 0.472 | 0.486 | |||
| CLM5 | [-] | -29.4 | -29.4 | -45.1 | -51.0 | 16.6 | 19.8 | 2.37 | 0.164 | 0.370 | 0.632 | 0.977 | 0.466 | 0.496 |
Download Data |
Period Mean (original grids) [W/m2] |
Model Period Mean (intersection) [W/m2] |
Model Period Mean (complement) [W/m2] |
Benchmark Period Mean (intersection) [W/m2] |
Benchmark Period Mean (complement) [W/m2] |
Bias [W/m2] |
RMSE [W/m2] |
Phase Shift [months] |
Bias Score [1] |
RMSE Score [1] |
Seasonal Cycle Score [1] |
Spatial Distribution Score [1] |
Interannual Variability Score [1] |
Overall Score [1] |
|||
|---|---|---|---|---|---|---|---|---|---|---|---|---|---|---|---|---|---|
| Benchmark | [-] | -44.2 | |||||||||||||||
| CLM4 | [-] | -58.7 | -58.6 | -44.1 | -53.1 | -14.7 | 18.6 | 0.991 | 0.388 | 0.494 | 0.886 | 0.566 | 0.563 | 0.565 | |||
| CLM4.5 | [-] | -59.2 | -59.1 | -44.1 | -53.1 | -15.1 | 19.4 | 1.06 | 0.371 | 0.473 | 0.879 | 0.681 | 0.582 | 0.576 | |||
| CLM5 | [-] | -65.5 | -65.5 | -44.1 | -53.1 | -21.5 | 24.5 | 1.42 | 0.243 | 0.463 | 0.829 | 0.528 | 0.539 | 0.511 |
Download Data |
Period Mean (original grids) [W/m2] |
Model Period Mean (intersection) [W/m2] |
Model Period Mean (complement) [W/m2] |
Benchmark Period Mean (intersection) [W/m2] |
Benchmark Period Mean (complement) [W/m2] |
Bias [W/m2] |
RMSE [W/m2] |
Phase Shift [months] |
Bias Score [1] |
RMSE Score [1] |
Seasonal Cycle Score [1] |
Spatial Distribution Score [1] |
Interannual Variability Score [1] |
Overall Score [1] |
|||
|---|---|---|---|---|---|---|---|---|---|---|---|---|---|---|---|---|---|
| Benchmark | [-] | -66.8 | |||||||||||||||
| CLM4 | [-] | -77.6 | -77.5 | -67.0 | -58.2 | -9.30 | 17.9 | 1.16 | 0.583 | 0.509 | 0.840 | 0.967 | 0.585 | 0.666 | |||
| CLM4.5 | [-] | -78.4 | -78.2 | -67.0 | -58.2 | -10.0 | 18.2 | 1.17 | 0.569 | 0.510 | 0.839 | 0.968 | 0.584 | 0.663 | |||
| CLM5 | [-] | -82.8 | -82.7 | -67.0 | -58.2 | -14.4 | 21.3 | 1.28 | 0.482 | 0.496 | 0.818 | 0.937 | 0.558 | 0.631 |
Download Data |
Period Mean (original grids) [W/m2] |
Model Period Mean (intersection) [W/m2] |
Model Period Mean (complement) [W/m2] |
Benchmark Period Mean (intersection) [W/m2] |
Benchmark Period Mean (complement) [W/m2] |
Bias [W/m2] |
RMSE [W/m2] |
Phase Shift [months] |
Bias Score [1] |
RMSE Score [1] |
Seasonal Cycle Score [1] |
Spatial Distribution Score [1] |
Interannual Variability Score [1] |
Overall Score [1] |
|||
|---|---|---|---|---|---|---|---|---|---|---|---|---|---|---|---|---|---|
| Benchmark | [-] | -60.6 | |||||||||||||||
| CLM4 | [-] | -66.2 | -66.3 | -61.3 | -51.8 | -0.639 | 20.2 | 1.14 | 0.599 | 0.515 | 0.862 | 0.919 | 0.546 | 0.660 | |||
| CLM4.5 | [-] | -70.3 | -70.4 | -61.3 | -51.8 | -4.27 | 21.2 | 1.12 | 0.570 | 0.517 | 0.866 | 0.918 | 0.542 | 0.655 | |||
| CLM5 | [-] | -72.2 | -72.2 | -61.3 | -51.8 | -6.24 | 21.0 | 1.16 | 0.580 | 0.520 | 0.854 | 0.933 | 0.499 | 0.651 |
Download Data |
Period Mean (original grids) [W/m2] |
Model Period Mean (intersection) [W/m2] |
Model Period Mean (complement) [W/m2] |
Benchmark Period Mean (intersection) [W/m2] |
Benchmark Period Mean (complement) [W/m2] |
Bias [W/m2] |
RMSE [W/m2] |
Phase Shift [months] |
Bias Score [1] |
RMSE Score [1] |
Seasonal Cycle Score [1] |
Spatial Distribution Score [1] |
Interannual Variability Score [1] |
Overall Score [1] |
|||
|---|---|---|---|---|---|---|---|---|---|---|---|---|---|---|---|---|---|
| Benchmark | [-] | -32.3 | |||||||||||||||
| CLM4 | [-] | -50.6 | -50.7 | -32.2 | -34.9 | -18.5 | 25.2 | 2.22 | 0.303 | 0.350 | 0.681 | 0.994 | 0.547 | 0.538 | |||
| CLM4.5 | [-] | -50.8 | -50.8 | -32.2 | -34.9 | -18.6 | 24.1 | 2.22 | 0.302 | 0.392 | 0.682 | 0.985 | 0.546 | 0.550 | |||
| CLM5 | [-] | -58.4 | -58.5 | -32.2 | -34.9 | -26.2 | 29.4 | 2.35 | 0.183 | 0.437 | 0.653 | 0.988 | 0.503 | 0.534 |
Download Data |
Period Mean (original grids) [W/m2] |
Model Period Mean (intersection) [W/m2] |
Model Period Mean (complement) [W/m2] |
Benchmark Period Mean (intersection) [W/m2] |
Benchmark Period Mean (complement) [W/m2] |
Bias [W/m2] |
RMSE [W/m2] |
Phase Shift [months] |
Bias Score [1] |
RMSE Score [1] |
Seasonal Cycle Score [1] |
Spatial Distribution Score [1] |
Interannual Variability Score [1] |
Overall Score [1] |
|||
|---|---|---|---|---|---|---|---|---|---|---|---|---|---|---|---|---|---|
| Benchmark | [-] | -88.6 | |||||||||||||||
| CLM4 | [-] | -94.7 | -94.8 | -90.4 | -66.1 | -1.24 | 13.7 | 0.783 | 0.743 | 0.519 | 0.885 | 0.998 | 0.577 | 0.707 | |||
| CLM4.5 | [-] | -95.0 | -95.1 | -90.4 | -66.1 | -1.53 | 13.9 | 0.783 | 0.742 | 0.516 | 0.887 | 0.997 | 0.586 | 0.707 | |||
| CLM5 | [-] | -97.1 | -97.2 | -90.4 | -66.1 | -3.37 | 15.1 | 0.861 | 0.695 | 0.499 | 0.869 | 0.998 | 0.533 | 0.682 |
Download Data |
Period Mean (original grids) [W/m2] |
Model Period Mean (intersection) [W/m2] |
Model Period Mean (complement) [W/m2] |
Benchmark Period Mean (intersection) [W/m2] |
Benchmark Period Mean (complement) [W/m2] |
Bias [W/m2] |
RMSE [W/m2] |
Phase Shift [months] |
Bias Score [1] |
RMSE Score [1] |
Seasonal Cycle Score [1] |
Spatial Distribution Score [1] |
Interannual Variability Score [1] |
Overall Score [1] |
|||
|---|---|---|---|---|---|---|---|---|---|---|---|---|---|---|---|---|---|
| Benchmark | [-] | -54.5 | |||||||||||||||
| CLM4 | [-] | -66.0 | -66.0 | -54.0 | -59.9 | -11.7 | 17.7 | 1.52 | 0.435 | 0.451 | 0.782 | 0.729 | 0.581 | 0.571 | |||
| CLM4.5 | [-] | -65.4 | -65.5 | -54.0 | -59.9 | -11.1 | 17.2 | 1.58 | 0.449 | 0.458 | 0.774 | 0.681 | 0.567 | 0.565 | |||
| CLM5 | [-] | -70.1 | -70.1 | -54.0 | -59.9 | -15.5 | 20.5 | 1.73 | 0.356 | 0.442 | 0.744 | 0.590 | 0.518 | 0.515 |
Download Data |
Period Mean (original grids) [W/m2] |
Model Period Mean (intersection) [W/m2] |
Model Period Mean (complement) [W/m2] |
Benchmark Period Mean (intersection) [W/m2] |
Benchmark Period Mean (complement) [W/m2] |
Bias [W/m2] |
RMSE [W/m2] |
Phase Shift [months] |
Bias Score [1] |
RMSE Score [1] |
Seasonal Cycle Score [1] |
Spatial Distribution Score [1] |
Interannual Variability Score [1] |
Overall Score [1] |
|||
|---|---|---|---|---|---|---|---|---|---|---|---|---|---|---|---|---|---|
| Benchmark | [-] | -53.4 | |||||||||||||||
| CLM4 | [-] | -66.7 | -66.7 | -61.2 | -49.6 | -3.99 | 18.7 | 1.52 | 0.539 | 0.475 | 0.777 | 0.978 | 0.525 | 0.628 | |||
| CLM4.5 | [-] | -68.1 | -68.1 | -61.2 | -49.6 | -5.23 | 18.7 | 1.47 | 0.531 | 0.481 | 0.790 | 0.978 | 0.527 | 0.631 | |||
| CLM5 | [-] | -71.6 | -71.6 | -61.2 | -49.6 | -8.53 | 20.5 | 1.53 | 0.487 | 0.472 | 0.780 | 0.970 | 0.498 | 0.613 |
Download Data |
Period Mean (original grids) [W/m2] |
Model Period Mean (intersection) [W/m2] |
Model Period Mean (complement) [W/m2] |
Benchmark Period Mean (intersection) [W/m2] |
Benchmark Period Mean (complement) [W/m2] |
Bias [W/m2] |
RMSE [W/m2] |
Phase Shift [months] |
Bias Score [1] |
RMSE Score [1] |
Seasonal Cycle Score [1] |
Spatial Distribution Score [1] |
Interannual Variability Score [1] |
Overall Score [1] |
|||
|---|---|---|---|---|---|---|---|---|---|---|---|---|---|---|---|---|---|
| Benchmark | [-] | -100. | |||||||||||||||
| CLM4 | [-] | -102. | -102. | -101. | -73.0 | 0.614 | 16.4 | 0.944 | 0.666 | 0.515 | 0.865 | 0.976 | 0.481 | 0.670 | |||
| CLM4.5 | [-] | -102. | -102. | -101. | -73.0 | 0.685 | 16.5 | 0.928 | 0.664 | 0.514 | 0.868 | 0.980 | 0.480 | 0.670 | |||
| CLM5 | [-] | -103. | -103. | -101. | -73.0 | -0.702 | 17.0 | 0.914 | 0.659 | 0.502 | 0.868 | 0.976 | 0.461 | 0.661 |
Download Data |
Period Mean (original grids) [W/m2] |
Model Period Mean (intersection) [W/m2] |
Model Period Mean (complement) [W/m2] |
Benchmark Period Mean (intersection) [W/m2] |
Benchmark Period Mean (complement) [W/m2] |
Bias [W/m2] |
RMSE [W/m2] |
Phase Shift [months] |
Bias Score [1] |
RMSE Score [1] |
Seasonal Cycle Score [1] |
Spatial Distribution Score [1] |
Interannual Variability Score [1] |
Overall Score [1] |
|||
|---|---|---|---|---|---|---|---|---|---|---|---|---|---|---|---|---|---|
| Benchmark | [-] | -33.5 | |||||||||||||||
| CLM4 | [-] | -53.3 | -53.3 | -33.5 | -34.8 | -19.6 | 24.5 | 1.69 | 0.311 | 0.435 | 0.771 | 0.987 | 0.497 | 0.573 | |||
| CLM4.5 | [-] | -53.8 | -53.8 | -33.5 | -34.8 | -20.0 | 24.6 | 1.73 | 0.302 | 0.436 | 0.764 | 0.983 | 0.500 | 0.570 | |||
| CLM5 | [-] | -60.2 | -60.2 | -33.5 | -34.8 | -26.3 | 29.9 | 1.77 | 0.202 | 0.435 | 0.754 | 0.970 | 0.481 | 0.546 |
Download Data |
Period Mean (original grids) [W/m2] |
Model Period Mean (intersection) [W/m2] |
Model Period Mean (complement) [W/m2] |
Benchmark Period Mean (intersection) [W/m2] |
Benchmark Period Mean (complement) [W/m2] |
Bias [W/m2] |
RMSE [W/m2] |
Phase Shift [months] |
Bias Score [1] |
RMSE Score [1] |
Seasonal Cycle Score [1] |
Spatial Distribution Score [1] |
Interannual Variability Score [1] |
Overall Score [1] |
|||
|---|---|---|---|---|---|---|---|---|---|---|---|---|---|---|---|---|---|
| Benchmark | [-] | -66.0 | |||||||||||||||
| CLM4 | [-] | -72.3 | -72.3 | -67.8 | -57.2 | 1.09 | 17.5 | 1.72 | 0.541 | 0.461 | 0.719 | 0.943 | 0.572 | 0.616 | |||
| CLM4.5 | [-] | -71.0 | -71.0 | -67.8 | -57.2 | 2.95 | 19.0 | 1.73 | 0.490 | 0.458 | 0.723 | 0.880 | 0.575 | 0.597 | |||
| CLM5 | [-] | -73.1 | -73.1 | -67.8 | -57.2 | 0.821 | 18.2 | 1.83 | 0.511 | 0.457 | 0.705 | 0.905 | 0.524 | 0.593 |
Download Data |
Period Mean (original grids) [W/m2] |
Model Period Mean (intersection) [W/m2] |
Model Period Mean (complement) [W/m2] |
Benchmark Period Mean (intersection) [W/m2] |
Benchmark Period Mean (complement) [W/m2] |
Bias [W/m2] |
RMSE [W/m2] |
Phase Shift [months] |
Bias Score [1] |
RMSE Score [1] |
Seasonal Cycle Score [1] |
Spatial Distribution Score [1] |
Interannual Variability Score [1] |
Overall Score [1] |
|||
|---|---|---|---|---|---|---|---|---|---|---|---|---|---|---|---|---|---|
| Benchmark | [-] | -51.6 | |||||||||||||||
| CLM4 | [-] | -59.0 | -58.8 | -51.4 | -56.8 | -6.64 | 15.7 | 2.62 | 0.520 | 0.352 | 0.561 | 0.697 | 0.654 | 0.523 | |||
| CLM4.5 | [-] | -60.3 | -60.0 | -51.4 | -56.8 | -7.74 | 16.1 | 2.53 | 0.483 | 0.364 | 0.587 | 0.678 | 0.663 | 0.523 | |||
| CLM5 | [-] | -66.2 | -66.0 | -51.4 | -56.8 | -13.7 | 19.7 | 2.99 | 0.330 | 0.350 | 0.514 | 0.724 | 0.613 | 0.480 |
Download Data |
Period Mean (original grids) [W/m2] |
Model Period Mean (intersection) [W/m2] |
Model Period Mean (complement) [W/m2] |
Benchmark Period Mean (intersection) [W/m2] |
Benchmark Period Mean (complement) [W/m2] |
Bias [W/m2] |
RMSE [W/m2] |
Phase Shift [months] |
Bias Score [1] |
RMSE Score [1] |
Seasonal Cycle Score [1] |
Spatial Distribution Score [1] |
Interannual Variability Score [1] |
Overall Score [1] |
|||
|---|---|---|---|---|---|---|---|---|---|---|---|---|---|---|---|---|---|
| Benchmark | [-] | -46.1 | |||||||||||||||
| CLM4 | [-] | -60.4 | -60.4 | -46.1 | -44.3 | -14.3 | 18.4 | 0.938 | 0.414 | 0.503 | 0.876 | 0.818 | 0.506 | 0.603 | |||
| CLM4.5 | [-] | -61.2 | -61.3 | -46.1 | -44.3 | -15.2 | 19.2 | 0.862 | 0.393 | 0.493 | 0.886 | 0.809 | 0.506 | 0.597 | |||
| CLM5 | [-] | -67.8 | -67.8 | -46.1 | -44.3 | -21.5 | 25.1 | 1.16 | 0.264 | 0.456 | 0.836 | 0.594 | 0.497 | 0.517 |
Download Data |
Period Mean (original grids) [W/m2] |
Model Period Mean (intersection) [W/m2] |
Model Period Mean (complement) [W/m2] |
Benchmark Period Mean (intersection) [W/m2] |
Benchmark Period Mean (complement) [W/m2] |
Bias [W/m2] |
RMSE [W/m2] |
Phase Shift [months] |
Bias Score [1] |
RMSE Score [1] |
Seasonal Cycle Score [1] |
Spatial Distribution Score [1] |
Interannual Variability Score [1] |
Overall Score [1] |
|||
|---|---|---|---|---|---|---|---|---|---|---|---|---|---|---|---|---|---|
| Benchmark | [-] | -78.8 | |||||||||||||||
| CLM4 | [-] | -85.6 | -85.4 | -79.2 | -53.1 | -5.83 | 15.9 | 1.13 | 0.666 | 0.558 | 0.847 | 0.875 | 0.575 | 0.680 | |||
| CLM4.5 | [-] | -86.3 | -86.1 | -79.2 | -53.1 | -6.44 | 16.0 | 1.16 | 0.654 | 0.563 | 0.843 | 0.873 | 0.578 | 0.679 | |||
| CLM5 | [-] | -90.7 | -90.4 | -79.2 | -53.1 | -10.7 | 18.7 | 1.15 | 0.579 | 0.544 | 0.842 | 0.823 | 0.537 | 0.645 |
Download Data |
Period Mean (original grids) [W/m2] |
Model Period Mean (intersection) [W/m2] |
Model Period Mean (complement) [W/m2] |
Benchmark Period Mean (intersection) [W/m2] |
Benchmark Period Mean (complement) [W/m2] |
Bias [W/m2] |
RMSE [W/m2] |
Phase Shift [months] |
Bias Score [1] |
RMSE Score [1] |
Seasonal Cycle Score [1] |
Spatial Distribution Score [1] |
Interannual Variability Score [1] |
Overall Score [1] |
|||
|---|---|---|---|---|---|---|---|---|---|---|---|---|---|---|---|---|---|
| Benchmark | [-] | -39.8 | |||||||||||||||
| CLM4 | [-] | -26.6 | -26.7 | -39.6 | -48.2 | 12.6 | 18.1 | 2.28 | 0.301 | 0.416 | 0.655 | 0.828 | 0.519 | 0.522 | |||
| CLM4.5 | [-] | -29.3 | -29.3 | -39.6 | -48.2 | 10.3 | 17.0 | 2.30 | 0.341 | 0.414 | 0.649 | 0.810 | 0.527 | 0.526 | |||
| CLM5 | [-] | -30.2 | -30.2 | -39.6 | -48.2 | 9.35 | 15.7 | 2.31 | 0.384 | 0.420 | 0.648 | 0.876 | 0.515 | 0.544 |
Download Data |
Period Mean (original grids) [W/m2] |
Model Period Mean (intersection) [W/m2] |
Model Period Mean (complement) [W/m2] |
Benchmark Period Mean (intersection) [W/m2] |
Benchmark Period Mean (complement) [W/m2] |
Bias [W/m2] |
RMSE [W/m2] |
Phase Shift [months] |
Bias Score [1] |
RMSE Score [1] |
Seasonal Cycle Score [1] |
Spatial Distribution Score [1] |
Interannual Variability Score [1] |
Overall Score [1] |
|||
|---|---|---|---|---|---|---|---|---|---|---|---|---|---|---|---|---|---|
| Benchmark | [-] | -63.6 | |||||||||||||||
| CLM4 | [-] | -58.6 | -59.0 | -63.7 | -59.9 | 5.43 | 18.2 | 1.48 | 0.510 | 0.477 | 0.795 | 0.737 | 0.561 | 0.593 | |||
| CLM4.5 | [-] | -61.3 | -61.7 | -63.7 | -59.9 | 2.92 | 16.8 | 1.37 | 0.576 | 0.477 | 0.818 | 0.799 | 0.572 | 0.620 | |||
| CLM5 | [-] | -63.0 | -63.3 | -63.7 | -59.9 | 1.27 | 16.2 | 1.18 | 0.633 | 0.477 | 0.847 | 0.795 | 0.516 | 0.624 |
Download Data |
Period Mean (original grids) [W/m2] |
Model Period Mean (intersection) [W/m2] |
Model Period Mean (complement) [W/m2] |
Benchmark Period Mean (intersection) [W/m2] |
Benchmark Period Mean (complement) [W/m2] |
Bias [W/m2] |
RMSE [W/m2] |
Phase Shift [months] |
Bias Score [1] |
RMSE Score [1] |
Seasonal Cycle Score [1] |
Spatial Distribution Score [1] |
Interannual Variability Score [1] |
Overall Score [1] |
|||
|---|---|---|---|---|---|---|---|---|---|---|---|---|---|---|---|---|---|
| Benchmark | [-] | -80.2 | |||||||||||||||
| CLM4 | [-] | -90.5 | -90.1 | -83.6 | -50.6 | -4.35 | 23.5 | 1.34 | 0.498 | 0.468 | 0.815 | 0.700 | 0.510 | 0.577 | |||
| CLM4.5 | [-] | -92.7 | -92.4 | -83.6 | -50.6 | -6.34 | 23.7 | 1.33 | 0.495 | 0.471 | 0.816 | 0.718 | 0.514 | 0.581 | |||
| CLM5 | [-] | -94.4 | -94.2 | -83.6 | -50.6 | -8.10 | 24.7 | 1.40 | 0.477 | 0.465 | 0.800 | 0.661 | 0.492 | 0.560 |
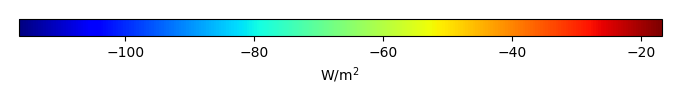
Temporally integrated period mean