Mean State
Download Data |
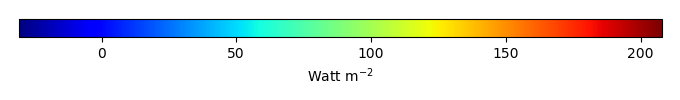
Period Mean (original grids) [Watt m-2] |
Model Period Mean (intersection) [Watt m-2] |
Model Period Mean (complement) [Watt m-2] |
Benchmark Period Mean (intersection) [Watt m-2] |
Benchmark Period Mean (complement) [Watt m-2] |
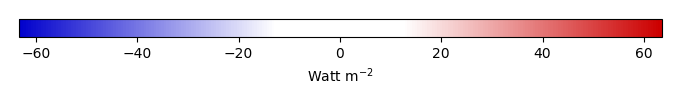
Bias [Watt m-2] |
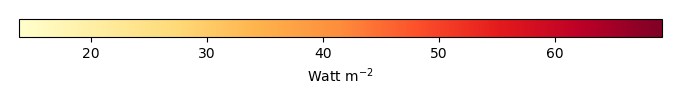
RMSE [Watt m-2] |
Phase Shift [months] |
Bias Score [1] |
RMSE Score [1] |
Seasonal Cycle Score [1] |
Spatial Distribution Score [1] |
Interannual Variability Score [1] |
Overall Score [1] |
|||
|---|---|---|---|---|---|---|---|---|---|---|---|---|---|---|---|---|---|
| Benchmark | [-] | 122. | |||||||||||||||
| CLM4 | [-] | 140. | 140. | 120. | 164. | 20.0 | 28.8 | 1.53 | 0.307 | 0.407 | 0.787 | 0.996 | 0.571 | 0.579 | |||
| CLM4.5 | [-] | 136. | 136. | 120. | 164. | 16.2 | 27.0 | 1.56 | 0.370 | 0.399 | 0.779 | 0.988 | 0.578 | 0.585 | |||
| CLM5 | [-] | 135. | 135. | 120. | 164. | 15.3 | 25.4 | 1.44 | 0.392 | 0.414 | 0.800 | 0.971 | 0.550 | 0.590 |
Download Data |
Period Mean (original grids) [Watt m-2] |
Model Period Mean (intersection) [Watt m-2] |
Model Period Mean (complement) [Watt m-2] |
Benchmark Period Mean (intersection) [Watt m-2] |
Benchmark Period Mean (complement) [Watt m-2] |
Bias [Watt m-2] |
RMSE [Watt m-2] |
Phase Shift [months] |
Bias Score [1] |
RMSE Score [1] |
Seasonal Cycle Score [1] |
Spatial Distribution Score [1] |
Interannual Variability Score [1] |
Overall Score [1] |
|||
|---|---|---|---|---|---|---|---|---|---|---|---|---|---|---|---|---|---|
| Benchmark | [-] | 102. | |||||||||||||||
| CLM4 | [-] | 113. | 112. | 101. | 165. | 11.6 | 25.8 | 1.39 | 0.587 | 0.446 | 0.801 | 0.988 | 0.658 | 0.654 | |||
| CLM4.5 | [-] | 108. | 108. | 101. | 165. | 7.52 | 24.3 | 1.44 | 0.634 | 0.449 | 0.800 | 0.984 | 0.663 | 0.663 | |||
| CLM5 | [-] | 108. | 107. | 101. | 165. | 6.68 | 23.4 | 1.50 | 0.648 | 0.461 | 0.780 | 0.991 | 0.617 | 0.660 |
Download Data |
Period Mean (original grids) [Watt m-2] |
Model Period Mean (intersection) [Watt m-2] |
Model Period Mean (complement) [Watt m-2] |
Benchmark Period Mean (intersection) [Watt m-2] |
Benchmark Period Mean (complement) [Watt m-2] |
Bias [Watt m-2] |
RMSE [Watt m-2] |
Phase Shift [months] |
Bias Score [1] |
RMSE Score [1] |
Seasonal Cycle Score [1] |
Spatial Distribution Score [1] |
Interannual Variability Score [1] |
Overall Score [1] |
|||
|---|---|---|---|---|---|---|---|---|---|---|---|---|---|---|---|---|---|
| Benchmark | [-] | 112. | |||||||||||||||
| CLM4 | [-] | 117. | 117. | 110. | 159. | 8.28 | 23.2 | 1.11 | 0.627 | 0.557 | 0.850 | 0.974 | 0.576 | 0.690 | |||
| CLM4.5 | [-] | 112. | 111. | 110. | 159. | 3.69 | 22.5 | 1.11 | 0.654 | 0.555 | 0.851 | 0.948 | 0.592 | 0.692 | |||
| CLM5 | [-] | 113. | 113. | 110. | 159. | 5.35 | 22.1 | 1.18 | 0.665 | 0.561 | 0.838 | 0.962 | 0.555 | 0.690 |
Download Data |
Period Mean (original grids) [Watt m-2] |
Model Period Mean (intersection) [Watt m-2] |
Model Period Mean (complement) [Watt m-2] |
Benchmark Period Mean (intersection) [Watt m-2] |
Benchmark Period Mean (complement) [Watt m-2] |
Bias [Watt m-2] |
RMSE [Watt m-2] |
Phase Shift [months] |
Bias Score [1] |
RMSE Score [1] |
Seasonal Cycle Score [1] |
Spatial Distribution Score [1] |
Interannual Variability Score [1] |
Overall Score [1] |
|||
|---|---|---|---|---|---|---|---|---|---|---|---|---|---|---|---|---|---|
| Benchmark | [-] | 43.3 | |||||||||||||||
| CLM4 | [-] | 13.9 | 14.0 | 43.2 | 44.3 | -29.8 | 36.0 | 0.644 | 0.587 | 0.661 | 0.957 | 0.897 | 0.677 | 0.740 | |||
| CLM4.5 | [-] | 18.2 | 18.3 | 43.2 | 44.3 | -26.3 | 31.3 | 0.427 | 0.629 | 0.701 | 0.972 | 0.782 | 0.643 | 0.738 | |||
| CLM5 | [-] | 14.6 | 14.7 | 43.2 | 44.3 | -29.9 | 33.5 | 0.368 | 0.589 | 0.703 | 0.976 | 0.758 | 0.638 | 0.728 |
Download Data |
Period Mean (original grids) [Watt m-2] |
Model Period Mean (intersection) [Watt m-2] |
Model Period Mean (complement) [Watt m-2] |
Benchmark Period Mean (intersection) [Watt m-2] |
Benchmark Period Mean (complement) [Watt m-2] |
Bias [Watt m-2] |
RMSE [Watt m-2] |
Phase Shift [months] |
Bias Score [1] |
RMSE Score [1] |
Seasonal Cycle Score [1] |
Spatial Distribution Score [1] |
Interannual Variability Score [1] |
Overall Score [1] |
|||
|---|---|---|---|---|---|---|---|---|---|---|---|---|---|---|---|---|---|
| Benchmark | [-] | 144. | |||||||||||||||
| CLM4 | [-] | 163. | 163. | 140. | 160. | 25.9 | 34.8 | 1.68 | 0.304 | 0.390 | 0.753 | 0.830 | 0.496 | 0.527 | |||
| CLM4.5 | [-] | 162. | 161. | 140. | 160. | 24.8 | 33.9 | 1.65 | 0.314 | 0.391 | 0.757 | 0.856 | 0.491 | 0.533 | |||
| CLM5 | [-] | 157. | 156. | 140. | 160. | 20.0 | 30.5 | 1.51 | 0.352 | 0.394 | 0.784 | 0.838 | 0.478 | 0.540 |
Download Data |
Period Mean (original grids) [Watt m-2] |
Model Period Mean (intersection) [Watt m-2] |
Model Period Mean (complement) [Watt m-2] |
Benchmark Period Mean (intersection) [Watt m-2] |
Benchmark Period Mean (complement) [Watt m-2] |
Bias [Watt m-2] |
RMSE [Watt m-2] |
Phase Shift [months] |
Bias Score [1] |
RMSE Score [1] |
Seasonal Cycle Score [1] |
Spatial Distribution Score [1] |
Interannual Variability Score [1] |
Overall Score [1] |
|||
|---|---|---|---|---|---|---|---|---|---|---|---|---|---|---|---|---|---|
| Benchmark | [-] | 62.5 | |||||||||||||||
| CLM4 | [-] | 48.7 | 48.6 | 62.3 | 75.7 | -13.6 | 27.3 | 0.293 | 0.790 | 0.672 | 0.980 | 0.763 | 0.651 | 0.755 | |||
| CLM4.5 | [-] | 46.3 | 46.3 | 62.3 | 75.7 | -15.9 | 29.4 | 0.271 | 0.765 | 0.662 | 0.981 | 0.702 | 0.656 | 0.738 | |||
| CLM5 | [-] | 42.4 | 42.4 | 62.3 | 75.7 | -19.8 | 31.9 | 0.344 | 0.710 | 0.651 | 0.976 | 0.876 | 0.660 | 0.754 |
Download Data |
Period Mean (original grids) [Watt m-2] |
Model Period Mean (intersection) [Watt m-2] |
Model Period Mean (complement) [Watt m-2] |
Benchmark Period Mean (intersection) [Watt m-2] |
Benchmark Period Mean (complement) [Watt m-2] |
Bias [Watt m-2] |
RMSE [Watt m-2] |
Phase Shift [months] |
Bias Score [1] |
RMSE Score [1] |
Seasonal Cycle Score [1] |
Spatial Distribution Score [1] |
Interannual Variability Score [1] |
Overall Score [1] |
|||
|---|---|---|---|---|---|---|---|---|---|---|---|---|---|---|---|---|---|
| Benchmark | [-] | 72.7 | |||||||||||||||
| CLM4 | [-] | 70.4 | 70.2 | 72.1 | 94.9 | -0.664 | 29.1 | 0.706 | 0.709 | 0.592 | 0.932 | 0.813 | 0.633 | 0.712 | |||
| CLM4.5 | [-] | 68.9 | 68.7 | 72.1 | 94.9 | -2.05 | 29.8 | 0.698 | 0.699 | 0.588 | 0.933 | 0.821 | 0.632 | 0.710 | |||
| CLM5 | [-] | 66.3 | 66.0 | 72.1 | 94.9 | -4.76 | 30.0 | 0.732 | 0.713 | 0.572 | 0.930 | 0.889 | 0.643 | 0.720 |
Download Data |
Period Mean (original grids) [Watt m-2] |
Model Period Mean (intersection) [Watt m-2] |
Model Period Mean (complement) [Watt m-2] |
Benchmark Period Mean (intersection) [Watt m-2] |
Benchmark Period Mean (complement) [Watt m-2] |
Bias [Watt m-2] |
RMSE [Watt m-2] |
Phase Shift [months] |
Bias Score [1] |
RMSE Score [1] |
Seasonal Cycle Score [1] |
Spatial Distribution Score [1] |
Interannual Variability Score [1] |
Overall Score [1] |
|||
|---|---|---|---|---|---|---|---|---|---|---|---|---|---|---|---|---|---|
| Benchmark | [-] | 109. | |||||||||||||||
| CLM4 | [-] | 126. | 126. | 105. | 157. | 24.5 | 37.0 | 0.934 | 0.407 | 0.486 | 0.892 | 0.992 | 0.578 | 0.640 | |||
| CLM4.5 | [-] | 122. | 122. | 105. | 157. | 21.4 | 34.9 | 0.926 | 0.450 | 0.485 | 0.893 | 0.992 | 0.565 | 0.645 | |||
| CLM5 | [-] | 121. | 121. | 105. | 157. | 20.0 | 33.3 | 0.825 | 0.463 | 0.500 | 0.916 | 0.990 | 0.522 | 0.649 |
Download Data |
Period Mean (original grids) [Watt m-2] |
Model Period Mean (intersection) [Watt m-2] |
Model Period Mean (complement) [Watt m-2] |
Benchmark Period Mean (intersection) [Watt m-2] |
Benchmark Period Mean (complement) [Watt m-2] |
Bias [Watt m-2] |
RMSE [Watt m-2] |
Phase Shift [months] |
Bias Score [1] |
RMSE Score [1] |
Seasonal Cycle Score [1] |
Spatial Distribution Score [1] |
Interannual Variability Score [1] |
Overall Score [1] |
|||
|---|---|---|---|---|---|---|---|---|---|---|---|---|---|---|---|---|---|
| Benchmark | [-] | 41.8 | |||||||||||||||
| CLM4 | [-] | 11.0 | 11.4 | 41.9 | 41.5 | -31.3 | 34.0 | 0.385 | 0.555 | 0.671 | 0.975 | 0.794 | 0.703 | 0.728 | |||
| CLM4.5 | [-] | 12.6 | 13.0 | 41.9 | 41.5 | -30.0 | 33.0 | 0.404 | 0.574 | 0.669 | 0.973 | 0.715 | 0.698 | 0.716 | |||
| CLM5 | [-] | 9.84 | 10.2 | 41.9 | 41.5 | -32.9 | 33.8 | 0.382 | 0.541 | 0.671 | 0.975 | 0.711 | 0.702 | 0.712 |
Download Data |
Period Mean (original grids) [Watt m-2] |
Model Period Mean (intersection) [Watt m-2] |
Model Period Mean (complement) [Watt m-2] |
Benchmark Period Mean (intersection) [Watt m-2] |
Benchmark Period Mean (complement) [Watt m-2] |
Bias [Watt m-2] |
RMSE [Watt m-2] |
Phase Shift [months] |
Bias Score [1] |
RMSE Score [1] |
Seasonal Cycle Score [1] |
Spatial Distribution Score [1] |
Interannual Variability Score [1] |
Overall Score [1] |
|||
|---|---|---|---|---|---|---|---|---|---|---|---|---|---|---|---|---|---|
| Benchmark | [-] | 96.5 | |||||||||||||||
| CLM4 | [-] | 98.7 | 98.7 | 93.2 | 138. | 6.87 | 22.9 | 0.598 | 0.715 | 0.649 | 0.952 | 0.916 | 0.592 | 0.746 | |||
| CLM4.5 | [-] | 98.5 | 98.4 | 93.2 | 138. | 6.64 | 22.9 | 0.621 | 0.720 | 0.647 | 0.948 | 0.899 | 0.603 | 0.744 | |||
| CLM5 | [-] | 97.5 | 97.5 | 93.2 | 138. | 5.79 | 23.2 | 0.580 | 0.720 | 0.643 | 0.954 | 0.928 | 0.604 | 0.749 |
Download Data |
Period Mean (original grids) [Watt m-2] |
Model Period Mean (intersection) [Watt m-2] |
Model Period Mean (complement) [Watt m-2] |
Benchmark Period Mean (intersection) [Watt m-2] |
Benchmark Period Mean (complement) [Watt m-2] |
Bias [Watt m-2] |
RMSE [Watt m-2] |
Phase Shift [months] |
Bias Score [1] |
RMSE Score [1] |
Seasonal Cycle Score [1] |
Spatial Distribution Score [1] |
Interannual Variability Score [1] |
Overall Score [1] |
|||
|---|---|---|---|---|---|---|---|---|---|---|---|---|---|---|---|---|---|
| Benchmark | [-] | 64.4 | |||||||||||||||
| CLM4 | [-] | 64.0 | 64.0 | 61.9 | 90.5 | 2.72 | 25.3 | 0.317 | 0.782 | 0.687 | 0.979 | 0.841 | 0.760 | 0.789 | |||
| CLM4.5 | [-] | 65.5 | 65.5 | 61.9 | 90.5 | 4.14 | 25.4 | 0.308 | 0.788 | 0.681 | 0.980 | 0.888 | 0.766 | 0.797 | |||
| CLM5 | [-] | 60.9 | 61.0 | 61.9 | 90.5 | -0.150 | 25.5 | 0.326 | 0.810 | 0.671 | 0.978 | 0.880 | 0.736 | 0.791 |
Download Data |
Period Mean (original grids) [Watt m-2] |
Model Period Mean (intersection) [Watt m-2] |
Model Period Mean (complement) [Watt m-2] |
Benchmark Period Mean (intersection) [Watt m-2] |
Benchmark Period Mean (complement) [Watt m-2] |
Bias [Watt m-2] |
RMSE [Watt m-2] |
Phase Shift [months] |
Bias Score [1] |
RMSE Score [1] |
Seasonal Cycle Score [1] |
Spatial Distribution Score [1] |
Interannual Variability Score [1] |
Overall Score [1] |
|||
|---|---|---|---|---|---|---|---|---|---|---|---|---|---|---|---|---|---|
| Benchmark | [-] | 115. | |||||||||||||||
| CLM4 | [-] | 74.6 | 74.6 | 77.4 | 133. | -0.847 | 29.1 | 0.799 | 0.585 | 0.565 | 0.907 | 0.865 | 0.574 | 0.677 | |||
| CLM4.5 | [-] | 73.7 | 73.7 | 77.4 | 133. | -1.61 | 28.6 | 0.797 | 0.599 | 0.565 | 0.907 | 0.883 | 0.575 | 0.682 | |||
| CLM5 | [-] | 71.5 | 71.5 | 77.4 | 133. | -4.18 | 29.2 | 0.799 | 0.588 | 0.564 | 0.907 | 0.864 | 0.564 | 0.675 |
Download Data |
Period Mean (original grids) [Watt m-2] |
Model Period Mean (intersection) [Watt m-2] |
Model Period Mean (complement) [Watt m-2] |
Benchmark Period Mean (intersection) [Watt m-2] |
Benchmark Period Mean (complement) [Watt m-2] |
Bias [Watt m-2] |
RMSE [Watt m-2] |
Phase Shift [months] |
Bias Score [1] |
RMSE Score [1] |
Seasonal Cycle Score [1] |
Spatial Distribution Score [1] |
Interannual Variability Score [1] |
Overall Score [1] |
|||
|---|---|---|---|---|---|---|---|---|---|---|---|---|---|---|---|---|---|
| Benchmark | [-] | 54.9 | |||||||||||||||
| CLM4 | [-] | 64.2 | 64.2 | 51.3 | 143. | 15.0 | 32.5 | 1.48 | 0.524 | 0.476 | 0.800 | 0.854 | 0.495 | 0.604 | |||
| CLM4.5 | [-] | 64.8 | 64.8 | 51.3 | 143. | 15.7 | 32.9 | 1.51 | 0.517 | 0.473 | 0.797 | 0.865 | 0.498 | 0.604 | |||
| CLM5 | [-] | 64.5 | 64.6 | 51.3 | 143. | 15.6 | 32.9 | 1.47 | 0.522 | 0.471 | 0.802 | 0.878 | 0.502 | 0.608 |
Download Data |
Period Mean (original grids) [Watt m-2] |
Model Period Mean (intersection) [Watt m-2] |
Model Period Mean (complement) [Watt m-2] |
Benchmark Period Mean (intersection) [Watt m-2] |
Benchmark Period Mean (complement) [Watt m-2] |
Bias [Watt m-2] |
RMSE [Watt m-2] |
Phase Shift [months] |
Bias Score [1] |
RMSE Score [1] |
Seasonal Cycle Score [1] |
Spatial Distribution Score [1] |
Interannual Variability Score [1] |
Overall Score [1] |
|||
|---|---|---|---|---|---|---|---|---|---|---|---|---|---|---|---|---|---|
| Benchmark | [-] | 44.9 | |||||||||||||||
| CLM4 | [-] | 19.2 | 19.0 | 44.8 | 45.6 | -27.4 | 32.4 | 0.234 | 0.615 | 0.695 | 0.984 | 0.805 | 0.654 | 0.741 | |||
| CLM4.5 | [-] | 20.5 | 20.3 | 44.8 | 45.6 | -26.3 | 31.1 | 0.217 | 0.627 | 0.702 | 0.985 | 0.788 | 0.634 | 0.740 | |||
| CLM5 | [-] | 15.2 | 15.0 | 44.8 | 45.6 | -31.6 | 35.1 | 0.181 | 0.569 | 0.700 | 0.988 | 0.751 | 0.638 | 0.724 |
Download Data |
Period Mean (original grids) [Watt m-2] |
Model Period Mean (intersection) [Watt m-2] |
Model Period Mean (complement) [Watt m-2] |
Benchmark Period Mean (intersection) [Watt m-2] |
Benchmark Period Mean (complement) [Watt m-2] |
Bias [Watt m-2] |
RMSE [Watt m-2] |
Phase Shift [months] |
Bias Score [1] |
RMSE Score [1] |
Seasonal Cycle Score [1] |
Spatial Distribution Score [1] |
Interannual Variability Score [1] |
Overall Score [1] |
|||
|---|---|---|---|---|---|---|---|---|---|---|---|---|---|---|---|---|---|
| Benchmark | [-] | 134. | |||||||||||||||
| CLM4 | [-] | 117. | 117. | 127. | 169. | -2.29 | 26.7 | 1.12 | 0.589 | 0.576 | 0.860 | 0.969 | 0.600 | 0.695 | |||
| CLM4.5 | [-] | 118. | 118. | 127. | 169. | -0.859 | 28.6 | 1.16 | 0.554 | 0.571 | 0.856 | 0.938 | 0.608 | 0.683 | |||
| CLM5 | [-] | 116. | 116. | 127. | 169. | -2.92 | 27.2 | 1.04 | 0.567 | 0.585 | 0.876 | 0.956 | 0.572 | 0.690 |
Download Data |
Period Mean (original grids) [Watt m-2] |
Model Period Mean (intersection) [Watt m-2] |
Model Period Mean (complement) [Watt m-2] |
Benchmark Period Mean (intersection) [Watt m-2] |
Benchmark Period Mean (complement) [Watt m-2] |
Bias [Watt m-2] |
RMSE [Watt m-2] |
Phase Shift [months] |
Bias Score [1] |
RMSE Score [1] |
Seasonal Cycle Score [1] |
Spatial Distribution Score [1] |
Interannual Variability Score [1] |
Overall Score [1] |
|||
|---|---|---|---|---|---|---|---|---|---|---|---|---|---|---|---|---|---|
| Benchmark | [-] | 99.6 | |||||||||||||||
| CLM4 | [-] | 98.2 | 98.6 | 97.8 | 136. | 2.49 | 24.7 | 0.466 | 0.814 | 0.640 | 0.965 | 0.809 | 0.617 | 0.748 | |||
| CLM4.5 | [-] | 96.1 | 96.5 | 97.8 | 136. | 0.486 | 24.8 | 0.425 | 0.815 | 0.640 | 0.968 | 0.793 | 0.624 | 0.747 | |||
| CLM5 | [-] | 89.4 | 89.7 | 97.8 | 136. | -6.20 | 25.6 | 0.491 | 0.810 | 0.631 | 0.964 | 0.811 | 0.585 | 0.739 |
Download Data |
Period Mean (original grids) [Watt m-2] |
Model Period Mean (intersection) [Watt m-2] |
Model Period Mean (complement) [Watt m-2] |
Benchmark Period Mean (intersection) [Watt m-2] |
Benchmark Period Mean (complement) [Watt m-2] |
Bias [Watt m-2] |
RMSE [Watt m-2] |
Phase Shift [months] |
Bias Score [1] |
RMSE Score [1] |
Seasonal Cycle Score [1] |
Spatial Distribution Score [1] |
Interannual Variability Score [1] |
Overall Score [1] |
|||
|---|---|---|---|---|---|---|---|---|---|---|---|---|---|---|---|---|---|
| Benchmark | [-] | 72.2 | |||||||||||||||
| CLM4 | [-] | 61.3 | 61.5 | 72.0 | 77.2 | -10.8 | 24.9 | 0.383 | 0.827 | 0.687 | 0.973 | 0.876 | 0.613 | 0.777 | |||
| CLM4.5 | [-] | 61.5 | 61.6 | 72.0 | 77.2 | -10.6 | 24.4 | 0.391 | 0.829 | 0.690 | 0.973 | 0.931 | 0.607 | 0.786 | |||
| CLM5 | [-] | 54.7 | 54.9 | 72.0 | 77.2 | -17.2 | 29.2 | 0.370 | 0.739 | 0.664 | 0.974 | 0.957 | 0.615 | 0.769 |
Download Data |
Period Mean (original grids) [Watt m-2] |
Model Period Mean (intersection) [Watt m-2] |
Model Period Mean (complement) [Watt m-2] |
Benchmark Period Mean (intersection) [Watt m-2] |
Benchmark Period Mean (complement) [Watt m-2] |
Bias [Watt m-2] |
RMSE [Watt m-2] |
Phase Shift [months] |
Bias Score [1] |
RMSE Score [1] |
Seasonal Cycle Score [1] |
Spatial Distribution Score [1] |
Interannual Variability Score [1] |
Overall Score [1] |
|||
|---|---|---|---|---|---|---|---|---|---|---|---|---|---|---|---|---|---|
| Benchmark | [-] | 81.6 | |||||||||||||||
| CLM4 | [-] | 68.2 | 68.7 | 81.1 | 116. | -11.7 | 23.0 | 0.511 | 0.748 | 0.693 | 0.960 | 0.981 | 0.638 | 0.786 | |||
| CLM4.5 | [-] | 66.3 | 66.8 | 81.1 | 116. | -13.5 | 24.3 | 0.497 | 0.726 | 0.690 | 0.961 | 0.973 | 0.636 | 0.779 | |||
| CLM5 | [-] | 64.3 | 64.9 | 81.1 | 116. | -15.5 | 26.1 | 0.532 | 0.704 | 0.677 | 0.959 | 0.986 | 0.634 | 0.773 |
Download Data |
Period Mean (original grids) [Watt m-2] |
Model Period Mean (intersection) [Watt m-2] |
Model Period Mean (complement) [Watt m-2] |
Benchmark Period Mean (intersection) [Watt m-2] |
Benchmark Period Mean (complement) [Watt m-2] |
Bias [Watt m-2] |
RMSE [Watt m-2] |
Phase Shift [months] |
Bias Score [1] |
RMSE Score [1] |
Seasonal Cycle Score [1] |
Spatial Distribution Score [1] |
Interannual Variability Score [1] |
Overall Score [1] |
|||
|---|---|---|---|---|---|---|---|---|---|---|---|---|---|---|---|---|---|
| Benchmark | [-] | 132. | |||||||||||||||
| CLM4 | [-] | 154. | 154. | 131. | 178. | 24.1 | 30.9 | 1.10 | 0.275 | 0.412 | 0.850 | 0.898 | 0.516 | 0.561 | |||
| CLM4.5 | [-] | 152. | 152. | 131. | 178. | 21.7 | 29.1 | 1.11 | 0.311 | 0.410 | 0.846 | 0.936 | 0.519 | 0.572 | |||
| CLM5 | [-] | 151. | 151. | 131. | 178. | 20.5 | 27.7 | 1.16 | 0.327 | 0.416 | 0.840 | 0.919 | 0.508 | 0.571 |
Download Data |
Period Mean (original grids) [Watt m-2] |
Model Period Mean (intersection) [Watt m-2] |
Model Period Mean (complement) [Watt m-2] |
Benchmark Period Mean (intersection) [Watt m-2] |
Benchmark Period Mean (complement) [Watt m-2] |
Bias [Watt m-2] |
RMSE [Watt m-2] |
Phase Shift [months] |
Bias Score [1] |
RMSE Score [1] |
Seasonal Cycle Score [1] |
Spatial Distribution Score [1] |
Interannual Variability Score [1] |
Overall Score [1] |
|||
|---|---|---|---|---|---|---|---|---|---|---|---|---|---|---|---|---|---|
| Benchmark | [-] | 117. | |||||||||||||||
| CLM4 | [-] | 127. | 126. | 117. | 145. | 10.3 | 24.7 | 0.910 | 0.628 | 0.535 | 0.892 | 0.935 | 0.589 | 0.686 | |||
| CLM4.5 | [-] | 123. | 123. | 117. | 145. | 7.33 | 23.1 | 0.870 | 0.691 | 0.537 | 0.901 | 0.964 | 0.603 | 0.706 | |||
| CLM5 | [-] | 121. | 121. | 117. | 145. | 5.09 | 21.7 | 1.01 | 0.712 | 0.547 | 0.879 | 0.926 | 0.548 | 0.693 |
Download Data |
Period Mean (original grids) [Watt m-2] |
Model Period Mean (intersection) [Watt m-2] |
Model Period Mean (complement) [Watt m-2] |
Benchmark Period Mean (intersection) [Watt m-2] |
Benchmark Period Mean (complement) [Watt m-2] |
Bias [Watt m-2] |
RMSE [Watt m-2] |
Phase Shift [months] |
Bias Score [1] |
RMSE Score [1] |
Seasonal Cycle Score [1] |
Spatial Distribution Score [1] |
Interannual Variability Score [1] |
Overall Score [1] |
|||
|---|---|---|---|---|---|---|---|---|---|---|---|---|---|---|---|---|---|
| Benchmark | [-] | 95.7 | |||||||||||||||
| CLM4 | [-] | 84.1 | 83.8 | 92.5 | 124. | -8.67 | 26.8 | 0.560 | 0.724 | 0.661 | 0.951 | 0.937 | 0.522 | 0.743 | |||
| CLM4.5 | [-] | 82.4 | 82.0 | 92.5 | 124. | -10.2 | 27.7 | 0.601 | 0.709 | 0.659 | 0.944 | 0.917 | 0.525 | 0.735 | |||
| CLM5 | [-] | 81.9 | 81.5 | 92.5 | 124. | -10.7 | 27.6 | 0.604 | 0.713 | 0.660 | 0.943 | 0.907 | 0.521 | 0.734 |
Temporally integrated period mean