Mean State
Download Data |
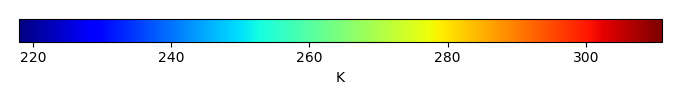
Period Mean (original grids) [K] |
Model Period Mean (intersection) [K] |
Model Period Mean (complement) [K] |
Benchmark Period Mean (intersection) [K] |
Benchmark Period Mean (complement) [K] |
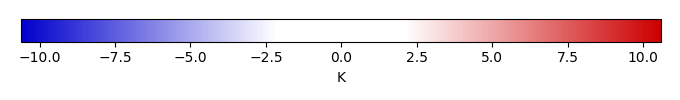
Bias [K] |
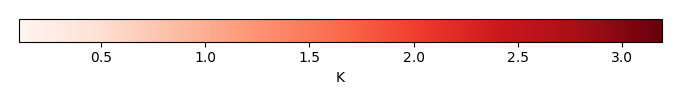
RMSE [K] |
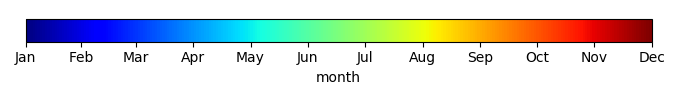
Phase Shift [months] |
Bias Score [1] |
RMSE Score [1] |
Seasonal Cycle Score [1] |
Spatial Distribution Score [1] |
Interannual Variability Score [1] |
Overall Score [1] |
|||
|---|---|---|---|---|---|---|---|---|---|---|---|---|---|---|---|---|---|
| Benchmark | [-] | 304. | |||||||||||||||
| CRUNCEPv7 | [-] | 303. | 303. | 303. | 304. | 304. | -0.232 | 1.36 | 0.663 | 0.640 | 0.511 | 0.909 | 0.995 | 0.757 | 0.720 | ||
| GSWP3v1 | [-] | 305. | 305. | 304. | 304. | 304. | 1.74 | 2.05 | 0.327 | 0.302 | 0.646 | 0.958 | 0.997 | 0.803 | 0.725 |
Download Data |
Period Mean (original grids) [K] |
Model Period Mean (intersection) [K] |
Model Period Mean (complement) [K] |
Benchmark Period Mean (intersection) [K] |
Benchmark Period Mean (complement) [K] |
Bias [K] |
RMSE [K] |
Phase Shift [months] |
Bias Score [1] |
RMSE Score [1] |
Seasonal Cycle Score [1] |
Spatial Distribution Score [1] |
Interannual Variability Score [1] |
Overall Score [1] |
|||
|---|---|---|---|---|---|---|---|---|---|---|---|---|---|---|---|---|---|
| Benchmark | [-] | 307. | |||||||||||||||
| CRUNCEPv7 | [-] | 307. | 307. | 305. | 307. | 305. | 0.364 | 1.90 | 0.228 | 0.735 | 0.574 | 0.983 | 0.996 | 0.696 | 0.760 | ||
| GSWP3v1 | [-] | 309. | 309. | 305. | 307. | 305. | 1.99 | 2.21 | 0.175 | 0.491 | 0.761 | 0.986 | 0.996 | 0.882 | 0.813 |
Download Data |
Period Mean (original grids) [K] |
Model Period Mean (intersection) [K] |
Model Period Mean (complement) [K] |
Benchmark Period Mean (intersection) [K] |
Benchmark Period Mean (complement) [K] |
Bias [K] |
RMSE [K] |
Phase Shift [months] |
Bias Score [1] |
RMSE Score [1] |
Seasonal Cycle Score [1] |
Spatial Distribution Score [1] |
Interannual Variability Score [1] |
Overall Score [1] |
|||
|---|---|---|---|---|---|---|---|---|---|---|---|---|---|---|---|---|---|
| Benchmark | [-] | 301. | |||||||||||||||
| CRUNCEPv7 | [-] | 302. | 302. | 300. | 301. | 302. | 0.706 | 1.89 | 0.645 | 0.602 | 0.576 | 0.920 | 0.997 | 0.858 | 0.755 | ||
| GSWP3v1 | [-] | 303. | 303. | 300. | 301. | 302. | 1.80 | 2.11 | 0.314 | 0.436 | 0.727 | 0.962 | 0.998 | 0.835 | 0.781 |
Download Data |
Period Mean (original grids) [K] |
Model Period Mean (intersection) [K] |
Model Period Mean (complement) [K] |
Benchmark Period Mean (intersection) [K] |
Benchmark Period Mean (complement) [K] |
Bias [K] |
RMSE [K] |
Phase Shift [months] |
Bias Score [1] |
RMSE Score [1] |
Seasonal Cycle Score [1] |
Spatial Distribution Score [1] |
Interannual Variability Score [1] |
Overall Score [1] |
|||
|---|---|---|---|---|---|---|---|---|---|---|---|---|---|---|---|---|---|
| Benchmark | [-] | 266. | |||||||||||||||
| CRUNCEPv7 | [-] | 263. | 263. | 266. | 266. | 269. | -2.27 | 2.97 | 0.0353 | 0.867 | 0.897 | 0.998 | 0.989 | 0.876 | 0.920 | ||
| GSWP3v1 | [-] | 266. | 266. | 270. | 266. | 269. | 0.485 | 1.77 | 0.0300 | 0.944 | 0.910 | 0.998 | 0.999 | 0.899 | 0.943 |
Download Data |
Period Mean (original grids) [K] |
Model Period Mean (intersection) [K] |
Model Period Mean (complement) [K] |
Benchmark Period Mean (intersection) [K] |
Benchmark Period Mean (complement) [K] |
Bias [K] |
RMSE [K] |
Phase Shift [months] |
Bias Score [1] |
RMSE Score [1] |
Seasonal Cycle Score [1] |
Spatial Distribution Score [1] |
Interannual Variability Score [1] |
Overall Score [1] |
|||
|---|---|---|---|---|---|---|---|---|---|---|---|---|---|---|---|---|---|
| Benchmark | [-] | 304. | |||||||||||||||
| CRUNCEPv7 | [-] | 301. | 301. | 301. | 304. | 303. | -2.52 | 2.60 | 1.48 | 0.0894 | 0.479 | 0.770 | 0.886 | 0.764 | 0.578 | ||
| GSWP3v1 | [-] | 305. | 305. | 304. | 304. | 303. | 1.24 | 1.78 | 1.04 | 0.173 | 0.514 | 0.845 | 0.904 | 0.810 | 0.627 |
Download Data |
Period Mean (original grids) [K] |
Model Period Mean (intersection) [K] |
Model Period Mean (complement) [K] |
Benchmark Period Mean (intersection) [K] |
Benchmark Period Mean (complement) [K] |
Bias [K] |
RMSE [K] |
Phase Shift [months] |
Bias Score [1] |
RMSE Score [1] |
Seasonal Cycle Score [1] |
Spatial Distribution Score [1] |
Interannual Variability Score [1] |
Overall Score [1] |
|||
|---|---|---|---|---|---|---|---|---|---|---|---|---|---|---|---|---|---|
| Benchmark | [-] | 276. | |||||||||||||||
| CRUNCEPv7 | [-] | 274. | 274. | 276. | 276. | 278. | -1.79 | 2.23 | 0.00705 | 0.887 | 0.922 | 1.00 | 0.992 | 0.967 | 0.948 | ||
| GSWP3v1 | [-] | 276. | 276. | 278. | 276. | 278. | 0.315 | 1.09 | 0.00657 | 0.961 | 0.944 | 1.00 | 1.00 | 0.972 | 0.970 |
Download Data |
Period Mean (original grids) [K] |
Model Period Mean (intersection) [K] |
Model Period Mean (complement) [K] |
Benchmark Period Mean (intersection) [K] |
Benchmark Period Mean (complement) [K] |
Bias [K] |
RMSE [K] |
Phase Shift [months] |
Bias Score [1] |
RMSE Score [1] |
Seasonal Cycle Score [1] |
Spatial Distribution Score [1] |
Interannual Variability Score [1] |
Overall Score [1] |
|||
|---|---|---|---|---|---|---|---|---|---|---|---|---|---|---|---|---|---|
| Benchmark | [-] | 286. | |||||||||||||||
| CRUNCEPv7 | [-] | 285. | 285. | 290. | 286. | 289. | -0.406 | 1.96 | 0.0844 | 0.869 | 0.888 | 0.994 | 0.993 | 0.937 | 0.928 | ||
| GSWP3v1 | [-] | 287. | 286. | 291. | 286. | 289. | 0.928 | 1.61 | 0.0534 | 0.870 | 0.927 | 0.996 | 1.00 | 0.944 | 0.944 |
Download Data |
Period Mean (original grids) [K] |
Model Period Mean (intersection) [K] |
Model Period Mean (complement) [K] |
Benchmark Period Mean (intersection) [K] |
Benchmark Period Mean (complement) [K] |
Bias [K] |
RMSE [K] |
Phase Shift [months] |
Bias Score [1] |
RMSE Score [1] |
Seasonal Cycle Score [1] |
Spatial Distribution Score [1] |
Interannual Variability Score [1] |
Overall Score [1] |
|||
|---|---|---|---|---|---|---|---|---|---|---|---|---|---|---|---|---|---|
| Benchmark | [-] | 302. | |||||||||||||||
| CRUNCEPv7 | [-] | 302. | 302. | 302. | 302. | 304. | -0.205 | 1.75 | 0.260 | 0.695 | 0.739 | 0.973 | 0.999 | 0.828 | 0.829 | ||
| GSWP3v1 | [-] | 304. | 304. | 304. | 302. | 304. | 1.33 | 1.91 | 0.185 | 0.602 | 0.814 | 0.981 | 0.999 | 0.915 | 0.854 |
Download Data |
Period Mean (original grids) [K] |
Model Period Mean (intersection) [K] |
Model Period Mean (complement) [K] |
Benchmark Period Mean (intersection) [K] |
Benchmark Period Mean (complement) [K] |
Bias [K] |
RMSE [K] |
Phase Shift [months] |
Bias Score [1] |
RMSE Score [1] |
Seasonal Cycle Score [1] |
Spatial Distribution Score [1] |
Interannual Variability Score [1] |
Overall Score [1] |
|||
|---|---|---|---|---|---|---|---|---|---|---|---|---|---|---|---|---|---|
| Benchmark | [-] | 268. | |||||||||||||||
| CRUNCEPv7 | [-] | 265. | 265. | 265. | 268. | 268. | -2.53 | 3.11 | 0.0363 | 0.850 | 0.893 | 0.998 | 0.992 | 0.910 | 0.922 | ||
| GSWP3v1 | [-] | 267. | 267. | 269. | 268. | 268. | -0.295 | 1.48 | 0.0122 | 0.962 | 0.918 | 0.999 | 1.00 | 0.912 | 0.951 |
Download Data |
Period Mean (original grids) [K] |
Model Period Mean (intersection) [K] |
Model Period Mean (complement) [K] |
Benchmark Period Mean (intersection) [K] |
Benchmark Period Mean (complement) [K] |
Bias [K] |
RMSE [K] |
Phase Shift [months] |
Bias Score [1] |
RMSE Score [1] |
Seasonal Cycle Score [1] |
Spatial Distribution Score [1] |
Interannual Variability Score [1] |
Overall Score [1] |
|||
|---|---|---|---|---|---|---|---|---|---|---|---|---|---|---|---|---|---|
| Benchmark | [-] | 301. | |||||||||||||||
| CRUNCEPv7 | [-] | 302. | 302. | 296. | 301. | 299. | 0.303 | 1.79 | 0.148 | 0.740 | 0.825 | 0.989 | 0.981 | 0.878 | 0.873 | ||
| GSWP3v1 | [-] | 303. | 303. | 297. | 301. | 299. | 1.80 | 2.04 | 0.119 | 0.668 | 0.878 | 0.991 | 0.997 | 0.906 | 0.886 |
Download Data |
Period Mean (original grids) [K] |
Model Period Mean (intersection) [K] |
Model Period Mean (complement) [K] |
Benchmark Period Mean (intersection) [K] |
Benchmark Period Mean (complement) [K] |
Bias [K] |
RMSE [K] |
Phase Shift [months] |
Bias Score [1] |
RMSE Score [1] |
Seasonal Cycle Score [1] |
Spatial Distribution Score [1] |
Interannual Variability Score [1] |
Overall Score [1] |
|||
|---|---|---|---|---|---|---|---|---|---|---|---|---|---|---|---|---|---|
| Benchmark | [-] | 286. | |||||||||||||||
| CRUNCEPv7 | [-] | 284. | 284. | 286. | 286. | 289. | -1.17 | 1.79 | 0.267 | 0.823 | 0.889 | 0.982 | 0.995 | 0.925 | 0.917 | ||
| GSWP3v1 | [-] | 286. | 286. | 287. | 286. | 289. | 0.500 | 1.28 | 0.156 | 0.881 | 0.906 | 0.989 | 0.997 | 0.943 | 0.937 |
Download Data |
Period Mean (original grids) [K] |
Model Period Mean (intersection) [K] |
Model Period Mean (complement) [K] |
Benchmark Period Mean (intersection) [K] |
Benchmark Period Mean (complement) [K] |
Bias [K] |
RMSE [K] |
Phase Shift [months] |
Bias Score [1] |
RMSE Score [1] |
Seasonal Cycle Score [1] |
Spatial Distribution Score [1] |
Interannual Variability Score [1] |
Overall Score [1] |
|||
|---|---|---|---|---|---|---|---|---|---|---|---|---|---|---|---|---|---|
| Benchmark | [-] | 292. | |||||||||||||||
| CRUNCEPv7 | [-] | 287. | 292. | 247. | 292. | 295. | -0.605 | 2.14 | 0.280 | 0.732 | 0.767 | 0.966 | 0.992 | 0.865 | 0.848 | ||
| GSWP3v1 | [-] | 289. | 293. | 252. | 292. | 295. | 1.14 | 1.82 | 0.164 | 0.688 | 0.837 | 0.982 | 0.997 | 0.910 | 0.875 |
Download Data |
Period Mean (original grids) [K] |
Model Period Mean (intersection) [K] |
Model Period Mean (complement) [K] |
Benchmark Period Mean (intersection) [K] |
Benchmark Period Mean (complement) [K] |
Bias [K] |
RMSE [K] |
Phase Shift [months] |
Bias Score [1] |
RMSE Score [1] |
Seasonal Cycle Score [1] |
Spatial Distribution Score [1] |
Interannual Variability Score [1] |
Overall Score [1] |
|||
|---|---|---|---|---|---|---|---|---|---|---|---|---|---|---|---|---|---|
| Benchmark | [-] | 303. | |||||||||||||||
| CRUNCEPv7 | [-] | 304. | 304. | 301. | 303. | 303. | 1.50 | 2.34 | 0.200 | 0.746 | 0.824 | 0.983 | 0.988 | 0.826 | 0.865 | ||
| GSWP3v1 | [-] | 304. | 304. | 301. | 303. | 303. | 1.71 | 2.09 | 0.112 | 0.736 | 0.893 | 0.991 | 0.998 | 0.912 | 0.904 |
Download Data |
Period Mean (original grids) [K] |
Model Period Mean (intersection) [K] |
Model Period Mean (complement) [K] |
Benchmark Period Mean (intersection) [K] |
Benchmark Period Mean (complement) [K] |
Bias [K] |
RMSE [K] |
Phase Shift [months] |
Bias Score [1] |
RMSE Score [1] |
Seasonal Cycle Score [1] |
Spatial Distribution Score [1] |
Interannual Variability Score [1] |
Overall Score [1] |
|||
|---|---|---|---|---|---|---|---|---|---|---|---|---|---|---|---|---|---|
| Benchmark | [-] | 268. | |||||||||||||||
| CRUNCEPv7 | [-] | 267. | 267. | 264. | 268. | 270. | -1.79 | 2.60 | 0.0185 | 0.869 | 0.875 | 0.999 | 1.00 | 0.889 | 0.918 | ||
| GSWP3v1 | [-] | 269. | 269. | 268. | 268. | 270. | 0.304 | 1.58 | 0.0152 | 0.942 | 0.902 | 0.999 | 1.00 | 0.911 | 0.943 |
Download Data |
Period Mean (original grids) [K] |
Model Period Mean (intersection) [K] |
Model Period Mean (complement) [K] |
Benchmark Period Mean (intersection) [K] |
Benchmark Period Mean (complement) [K] |
Bias [K] |
RMSE [K] |
Phase Shift [months] |
Bias Score [1] |
RMSE Score [1] |
Seasonal Cycle Score [1] |
Spatial Distribution Score [1] |
Interannual Variability Score [1] |
Overall Score [1] |
|||
|---|---|---|---|---|---|---|---|---|---|---|---|---|---|---|---|---|---|
| Benchmark | [-] | 302. | |||||||||||||||
| CRUNCEPv7 | [-] | 300. | 299. | 301. | 302. | 303. | -2.32 | 2.81 | 0.278 | 0.426 | 0.699 | 0.974 | 1.00 | 0.865 | 0.777 | ||
| GSWP3v1 | [-] | 303. | 303. | 303. | 302. | 303. | 1.40 | 2.07 | 0.283 | 0.533 | 0.743 | 0.973 | 0.986 | 0.906 | 0.814 |
Download Data |
Period Mean (original grids) [K] |
Model Period Mean (intersection) [K] |
Model Period Mean (complement) [K] |
Benchmark Period Mean (intersection) [K] |
Benchmark Period Mean (complement) [K] |
Bias [K] |
RMSE [K] |
Phase Shift [months] |
Bias Score [1] |
RMSE Score [1] |
Seasonal Cycle Score [1] |
Spatial Distribution Score [1] |
Interannual Variability Score [1] |
Overall Score [1] |
|||
|---|---|---|---|---|---|---|---|---|---|---|---|---|---|---|---|---|---|
| Benchmark | [-] | 292. | |||||||||||||||
| CRUNCEPv7 | [-] | 290. | 290. | 296. | 292. | 297. | -1.79 | 2.01 | 0.0675 | 0.813 | 0.908 | 0.995 | 1.00 | 0.930 | 0.926 | ||
| GSWP3v1 | [-] | 293. | 293. | 299. | 292. | 297. | 0.963 | 1.27 | 0.0711 | 0.882 | 0.934 | 0.995 | 0.997 | 0.963 | 0.951 |
Download Data |
Period Mean (original grids) [K] |
Model Period Mean (intersection) [K] |
Model Period Mean (complement) [K] |
Benchmark Period Mean (intersection) [K] |
Benchmark Period Mean (complement) [K] |
Bias [K] |
RMSE [K] |
Phase Shift [months] |
Bias Score [1] |
RMSE Score [1] |
Seasonal Cycle Score [1] |
Spatial Distribution Score [1] |
Interannual Variability Score [1] |
Overall Score [1] |
|||
|---|---|---|---|---|---|---|---|---|---|---|---|---|---|---|---|---|---|
| Benchmark | [-] | 279. | |||||||||||||||
| CRUNCEPv7 | [-] | 278. | 278. | 279. | 279. | 282. | -1.67 | 2.11 | 0.0338 | 0.859 | 0.906 | 0.998 | 0.997 | 0.940 | 0.934 | ||
| GSWP3v1 | [-] | 280. | 280. | 281. | 279. | 282. | 0.566 | 1.19 | 0.0362 | 0.930 | 0.926 | 0.998 | 0.998 | 0.959 | 0.956 |
Download Data |
Period Mean (original grids) [K] |
Model Period Mean (intersection) [K] |
Model Period Mean (complement) [K] |
Benchmark Period Mean (intersection) [K] |
Benchmark Period Mean (complement) [K] |
Bias [K] |
RMSE [K] |
Phase Shift [months] |
Bias Score [1] |
RMSE Score [1] |
Seasonal Cycle Score [1] |
Spatial Distribution Score [1] |
Interannual Variability Score [1] |
Overall Score [1] |
|||
|---|---|---|---|---|---|---|---|---|---|---|---|---|---|---|---|---|---|
| Benchmark | [-] | 291. | |||||||||||||||
| CRUNCEPv7 | [-] | 290. | 290. | 291. | 291. | 292. | -1.07 | 2.13 | 0.0518 | 0.846 | 0.858 | 0.996 | 0.997 | 0.935 | 0.915 | ||
| GSWP3v1 | [-] | 292. | 292. | 293. | 291. | 292. | 1.22 | 1.73 | 0.0461 | 0.847 | 0.907 | 0.997 | 0.999 | 0.940 | 0.933 |
Download Data |
Period Mean (original grids) [K] |
Model Period Mean (intersection) [K] |
Model Period Mean (complement) [K] |
Benchmark Period Mean (intersection) [K] |
Benchmark Period Mean (complement) [K] |
Bias [K] |
RMSE [K] |
Phase Shift [months] |
Bias Score [1] |
RMSE Score [1] |
Seasonal Cycle Score [1] |
Spatial Distribution Score [1] |
Interannual Variability Score [1] |
Overall Score [1] |
|||
|---|---|---|---|---|---|---|---|---|---|---|---|---|---|---|---|---|---|
| Benchmark | [-] | 304. | |||||||||||||||
| CRUNCEPv7 | [-] | 303. | 303. | 302. | 304. | 304. | -0.756 | 1.40 | 0.719 | 0.519 | 0.524 | 0.901 | 0.986 | 0.832 | 0.714 | ||
| GSWP3v1 | [-] | 306. | 306. | 304. | 304. | 304. | 1.64 | 1.95 | 0.380 | 0.246 | 0.646 | 0.949 | 1.00 | 0.903 | 0.732 |
Download Data |
Period Mean (original grids) [K] |
Model Period Mean (intersection) [K] |
Model Period Mean (complement) [K] |
Benchmark Period Mean (intersection) [K] |
Benchmark Period Mean (complement) [K] |
Bias [K] |
RMSE [K] |
Phase Shift [months] |
Bias Score [1] |
RMSE Score [1] |
Seasonal Cycle Score [1] |
Spatial Distribution Score [1] |
Interannual Variability Score [1] |
Overall Score [1] |
|||
|---|---|---|---|---|---|---|---|---|---|---|---|---|---|---|---|---|---|
| Benchmark | [-] | 301. | |||||||||||||||
| CRUNCEPv7 | [-] | 301. | 301. | 298. | 301. | 297. | -0.000935 | 1.50 | 0.766 | 0.717 | 0.611 | 0.887 | 0.999 | 0.791 | 0.769 | ||
| GSWP3v1 | [-] | 303. | 303. | 300. | 301. | 297. | 1.71 | 1.87 | 0.285 | 0.484 | 0.775 | 0.964 | 0.999 | 0.917 | 0.819 |
Download Data |
Period Mean (original grids) [K] |
Model Period Mean (intersection) [K] |
Model Period Mean (complement) [K] |
Benchmark Period Mean (intersection) [K] |
Benchmark Period Mean (complement) [K] |
Bias [K] |
RMSE [K] |
Phase Shift [months] |
Bias Score [1] |
RMSE Score [1] |
Seasonal Cycle Score [1] |
Spatial Distribution Score [1] |
Interannual Variability Score [1] |
Overall Score [1] |
|||
|---|---|---|---|---|---|---|---|---|---|---|---|---|---|---|---|---|---|
| Benchmark | [-] | 290. | |||||||||||||||
| CRUNCEPv7 | [-] | 290. | 290. | 291. | 290. | 289. | -0.559 | 2.32 | 0.378 | 0.583 | 0.703 | 0.951 | 0.996 | 0.864 | 0.800 | ||
| GSWP3v1 | [-] | 292. | 292. | 293. | 290. | 289. | 1.67 | 2.39 | 0.277 | 0.556 | 0.761 | 0.964 | 0.995 | 0.916 | 0.826 |
Temporally integrated period mean