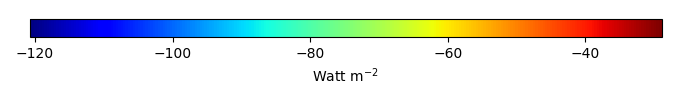
Mean State
Download Data |
Period Mean (original grids) [Watt m-2] |
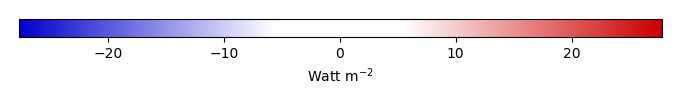
Bias [Watt m-2] |
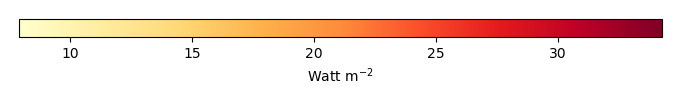
RMSE [Watt m-2] |
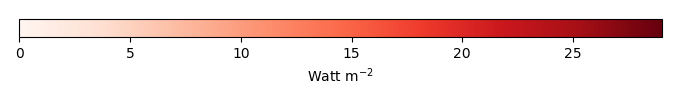
Phase Shift [months] |
Bias Score [1] |
RMSE Score [1] |
Seasonal Cycle Score [1] |
Interannual Variability Score [1] |
Overall Score [1] |
|||
|---|---|---|---|---|---|---|---|---|---|---|---|---|
| Benchmark | [-] | -49.2 | ||||||||||
| CRUNCEPv7 | [-] | -69.7 | -18.5 | 28.0 | 1.03 | 0.114 | 0.429 | 0.930 | 0.495 | 0.480 | ||
| GSWP3v1 | [-] | -57.7 | -4.65 | 22.8 | 0.00 | 0.160 | 0.435 | 1.00 | 0.575 | 0.521 | ||
| WFDEI | [-] | -66.2 | -14.7 | 27.1 | 1.03 | 0.138 | 0.402 | 0.930 | 0.495 | 0.473 |
Download Data |
Period Mean (original grids) [Watt m-2] |
Bias [Watt m-2] |
RMSE [Watt m-2] |
Phase Shift [months] |
Bias Score [1] |
RMSE Score [1] |
Seasonal Cycle Score [1] |
Interannual Variability Score [1] |
Overall Score [1] |
|||
|---|---|---|---|---|---|---|---|---|---|---|---|---|
| Benchmark | [-] | -64.6 | ||||||||||
| CRUNCEPv7 | [-] | -70.4 | -12.8 | 20.6 | 2.77 | 0.133 | 0.427 | 0.556 | 0.723 | 0.453 | ||
| GSWP3v1 | [-] | -66.8 | -5.02 | 13.7 | 1.02 | 0.199 | 0.478 | 0.861 | 0.775 | 0.558 | ||
| WFDEI | [-] | -68.4 | -11.4 | 19.4 | 2.50 | 0.150 | 0.396 | 0.611 | 0.753 | 0.461 |
Download Data |
Period Mean (original grids) [Watt m-2] |
Bias [Watt m-2] |
RMSE [Watt m-2] |
Phase Shift [months] |
Bias Score [1] |
RMSE Score [1] |
Seasonal Cycle Score [1] |
Interannual Variability Score [1] |
Overall Score [1] |
|||
|---|---|---|---|---|---|---|---|---|---|---|---|---|
| Benchmark | [-] | -109. | ||||||||||
| CRUNCEPv7 | [-] | -112. | -6.89 | 11.6 | 0.00 | 0.236 | 0.644 | 1.00 | 0.923 | 0.689 | ||
| GSWP3v1 | [-] | -112. | -4.78 | 12.8 | 1.03 | 0.262 | 0.586 | 0.930 | 0.783 | 0.630 | ||
| WFDEI | [-] | -111. | -7.10 | 13.2 | 0.00 | 0.233 | 0.587 | 1.00 | 0.925 | 0.667 |
Download Data |
Period Mean (original grids) [Watt m-2] |
Bias [Watt m-2] |
RMSE [Watt m-2] |
Phase Shift [months] |
Bias Score [1] |
RMSE Score [1] |
Seasonal Cycle Score [1] |
Interannual Variability Score [1] |
Overall Score [1] |
|||
|---|---|---|---|---|---|---|---|---|---|---|---|---|
| Benchmark | [-] | -31.3 | ||||||||||
| CRUNCEPv7 | [-] | -55.8 | -28.2 | 32.4 | 3.07 | 0.0307 | 0.217 | 0.494 | 0.651 | 0.322 | ||
| GSWP3v1 | [-] | -37.9 | -5.43 | 20.1 | 4.05 | 0.292 | 0.145 | 0.251 | 0.408 | 0.248 | ||
| WFDEI | [-] | -50.0 | -23.0 | 26.0 | 4.05 | 0.0513 | 0.308 | 0.251 | 0.770 | 0.338 |
Download Data |
Period Mean (original grids) [Watt m-2] |
Bias [Watt m-2] |
RMSE [Watt m-2] |
Phase Shift [months] |
Bias Score [1] |
RMSE Score [1] |
Seasonal Cycle Score [1] |
Interannual Variability Score [1] |
Overall Score [1] |
|||
|---|---|---|---|---|---|---|---|---|---|---|---|---|
| Benchmark | [-] | -54.8 | ||||||||||
| CRUNCEPv7 | [-] | -69.6 | -14.2 | 19.3 | 4.64 | 0.201 | 0.315 | 0.213 | 0.772 | 0.363 | ||
| GSWP3v1 | [-] | -63.7 | -7.14 | 11.9 | 0.620 | 0.394 | 0.454 | 0.958 | 0.827 | 0.618 | ||
| WFDEI | [-] | -67.4 | -11.9 | 17.5 | 4.02 | 0.244 | 0.297 | 0.375 | 0.762 | 0.395 |
Download Data |
Period Mean (original grids) [Watt m-2] |
Bias [Watt m-2] |
RMSE [Watt m-2] |
Phase Shift [months] |
Bias Score [1] |
RMSE Score [1] |
Seasonal Cycle Score [1] |
Interannual Variability Score [1] |
Overall Score [1] |
|||
|---|---|---|---|---|---|---|---|---|---|---|---|---|
| Benchmark | [-] | -88.8 | ||||||||||
| CRUNCEPv7 | [-] | -90.6 | -1.83 | 13.5 | 0.517 | 0.624 | 0.563 | 0.965 | 0.746 | 0.692 | ||
| GSWP3v1 | [-] | -88.9 | -0.107 | 9.83 | 0.258 | 0.785 | 0.585 | 0.983 | 0.898 | 0.767 | ||
| WFDEI | [-] | -91.9 | -3.14 | 14.5 | 0.517 | 0.712 | 0.492 | 0.965 | 0.825 | 0.697 |
Temporally integrated period mean