Mean State
Download Data |
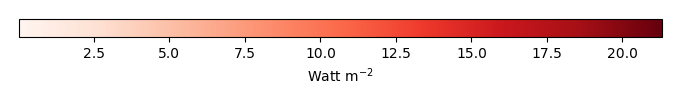
Period Mean (original grids) [Watt m-2] |
Model Period Mean (intersection) [Watt m-2] |
Model Period Mean (complement) [Watt m-2] |
Benchmark Period Mean (intersection) [Watt m-2] |
Benchmark Period Mean (complement) [Watt m-2] |
Bias [Watt m-2] |
RMSE [Watt m-2] |
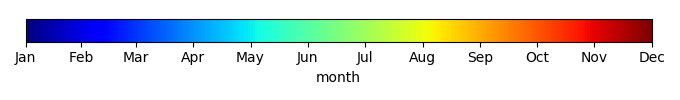
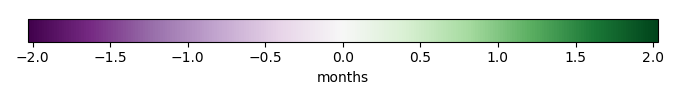
Phase Shift [months] |
Bias Score [1] |
RMSE Score [1] |
Seasonal Cycle Score [1] |
Spatial Distribution Score [1] |
Interannual Variability Score [1] |
Overall Score [1] |
|||
|---|---|---|---|---|---|---|---|---|---|---|---|---|---|---|---|---|---|
| Benchmark | [-] | 179. | |||||||||||||||
| CRUNCEPv7 | [-] | 192. | 192. | 177. | 216. | 14.5 | 24.4 | 1.07 | 0.429 | 0.451 | 0.858 | 0.933 | 0.511 | 0.606 | |||
| GSWP3v1 | [-] | 183. | 183. | 177. | 216. | 5.93 | 16.8 | 0.514 | 0.620 | 0.524 | 0.935 | 0.921 | 0.727 | 0.709 | |||
| WFDEI | [-] | 168. | 167. | 177. | 216. | -9.51 | 24.0 | 1.07 | 0.502 | 0.434 | 0.845 | 0.947 | 0.692 | 0.642 |
Download Data |
Period Mean (original grids) [Watt m-2] |
Model Period Mean (intersection) [Watt m-2] |
Model Period Mean (complement) [Watt m-2] |
Benchmark Period Mean (intersection) [Watt m-2] |
Benchmark Period Mean (complement) [Watt m-2] |
Bias [Watt m-2] |
RMSE [Watt m-2] |
Phase Shift [months] |
Bias Score [1] |
RMSE Score [1] |
Seasonal Cycle Score [1] |
Spatial Distribution Score [1] |
Interannual Variability Score [1] |
Overall Score [1] |
|||
|---|---|---|---|---|---|---|---|---|---|---|---|---|---|---|---|---|---|
| Benchmark | [-] | 189. | |||||||||||||||
| CRUNCEPv7 | [-] | 198. | 198. | 188. | 224. | 9.44 | 22.6 | 1.61 | 0.570 | 0.465 | 0.761 | 0.888 | 0.638 | 0.631 | |||
| GSWP3v1 | [-] | 195. | 195. | 188. | 224. | 6.39 | 16.2 | 0.423 | 0.672 | 0.536 | 0.965 | 0.999 | 0.767 | 0.746 | |||
| WFDEI | [-] | 190. | 190. | 188. | 224. | 2.13 | 19.5 | 0.534 | 0.613 | 0.504 | 0.940 | 0.997 | 0.737 | 0.716 |
Download Data |
Period Mean (original grids) [Watt m-2] |
Model Period Mean (intersection) [Watt m-2] |
Model Period Mean (complement) [Watt m-2] |
Benchmark Period Mean (intersection) [Watt m-2] |
Benchmark Period Mean (complement) [Watt m-2] |
Bias [Watt m-2] |
RMSE [Watt m-2] |
Phase Shift [months] |
Bias Score [1] |
RMSE Score [1] |
Seasonal Cycle Score [1] |
Spatial Distribution Score [1] |
Interannual Variability Score [1] |
Overall Score [1] |
|||
|---|---|---|---|---|---|---|---|---|---|---|---|---|---|---|---|---|---|
| Benchmark | [-] | 194. | |||||||||||||||
| CRUNCEPv7 | [-] | 195. | 195. | 192. | 221. | 2.95 | 22.4 | 1.07 | 0.693 | 0.503 | 0.861 | 0.735 | 0.528 | 0.637 | |||
| GSWP3v1 | [-] | 197. | 197. | 192. | 221. | 4.44 | 18.6 | 0.496 | 0.707 | 0.567 | 0.932 | 0.960 | 0.665 | 0.733 | |||
| WFDEI | [-] | 196. | 196. | 192. | 221. | 3.85 | 22.6 | 0.807 | 0.691 | 0.495 | 0.905 | 0.998 | 0.633 | 0.703 |
Download Data |
Period Mean (original grids) [Watt m-2] |
Model Period Mean (intersection) [Watt m-2] |
Model Period Mean (complement) [Watt m-2] |
Benchmark Period Mean (intersection) [Watt m-2] |
Benchmark Period Mean (complement) [Watt m-2] |
Bias [Watt m-2] |
RMSE [Watt m-2] |
Phase Shift [months] |
Bias Score [1] |
RMSE Score [1] |
Seasonal Cycle Score [1] |
Spatial Distribution Score [1] |
Interannual Variability Score [1] |
Overall Score [1] |
|||
|---|---|---|---|---|---|---|---|---|---|---|---|---|---|---|---|---|---|
| Benchmark | [-] | 81.3 | |||||||||||||||
| CRUNCEPv7 | [-] | 72.0 | 72.1 | 80.9 | 86.2 | -10.0 | 23.5 | 0.275 | 0.861 | 0.719 | 0.982 | 0.940 | 0.639 | 0.810 | |||
| GSWP3v1 | [-] | 69.8 | 69.9 | 80.9 | 86.2 | -11.6 | 21.8 | 0.200 | 0.843 | 0.740 | 0.987 | 0.945 | 0.720 | 0.829 | |||
| WFDEI | [-] | 60.1 | 60.3 | 80.9 | 86.2 | -21.0 | 29.0 | 0.271 | 0.736 | 0.715 | 0.982 | 0.916 | 0.788 | 0.808 |
Download Data |
Period Mean (original grids) [Watt m-2] |
Model Period Mean (intersection) [Watt m-2] |
Model Period Mean (complement) [Watt m-2] |
Benchmark Period Mean (intersection) [Watt m-2] |
Benchmark Period Mean (complement) [Watt m-2] |
Bias [Watt m-2] |
RMSE [Watt m-2] |
Phase Shift [months] |
Bias Score [1] |
RMSE Score [1] |
Seasonal Cycle Score [1] |
Spatial Distribution Score [1] |
Interannual Variability Score [1] |
Overall Score [1] |
|||
|---|---|---|---|---|---|---|---|---|---|---|---|---|---|---|---|---|---|
| Benchmark | [-] | 189. | |||||||||||||||
| CRUNCEPv7 | [-] | 187. | 187. | 183. | 210. | 6.23 | 26.2 | 1.53 | 0.481 | 0.411 | 0.774 | 0.548 | 0.466 | 0.515 | |||
| GSWP3v1 | [-] | 178. | 178. | 183. | 210. | -1.23 | 20.6 | 0.686 | 0.600 | 0.455 | 0.906 | 0.730 | 0.715 | 0.643 | |||
| WFDEI | [-] | 165. | 165. | 183. | 210. | -14.0 | 27.6 | 1.32 | 0.502 | 0.406 | 0.806 | 0.923 | 0.576 | 0.603 |
Download Data |
Period Mean (original grids) [Watt m-2] |
Model Period Mean (intersection) [Watt m-2] |
Model Period Mean (complement) [Watt m-2] |
Benchmark Period Mean (intersection) [Watt m-2] |
Benchmark Period Mean (complement) [Watt m-2] |
Bias [Watt m-2] |
RMSE [Watt m-2] |
Phase Shift [months] |
Bias Score [1] |
RMSE Score [1] |
Seasonal Cycle Score [1] |
Spatial Distribution Score [1] |
Interannual Variability Score [1] |
Overall Score [1] |
|||
|---|---|---|---|---|---|---|---|---|---|---|---|---|---|---|---|---|---|
| Benchmark | [-] | 105. | |||||||||||||||
| CRUNCEPv7 | [-] | 109. | 109. | 104. | 127. | 4.44 | 20.7 | 0.171 | 0.899 | 0.761 | 0.989 | 0.978 | 0.599 | 0.831 | |||
| GSWP3v1 | [-] | 102. | 102. | 104. | 127. | -2.18 | 14.9 | 0.0819 | 0.947 | 0.812 | 0.995 | 0.998 | 0.630 | 0.866 | |||
| WFDEI | [-] | 94.5 | 94.5 | 104. | 127. | -9.36 | 20.8 | 0.202 | 0.873 | 0.770 | 0.986 | 0.958 | 0.736 | 0.849 |
Download Data |
Period Mean (original grids) [Watt m-2] |
Model Period Mean (intersection) [Watt m-2] |
Model Period Mean (complement) [Watt m-2] |
Benchmark Period Mean (intersection) [Watt m-2] |
Benchmark Period Mean (complement) [Watt m-2] |
Bias [Watt m-2] |
RMSE [Watt m-2] |
Phase Shift [months] |
Bias Score [1] |
RMSE Score [1] |
Seasonal Cycle Score [1] |
Spatial Distribution Score [1] |
Interannual Variability Score [1] |
Overall Score [1] |
|||
|---|---|---|---|---|---|---|---|---|---|---|---|---|---|---|---|---|---|
| Benchmark | [-] | 140. | |||||||||||||||
| CRUNCEPv7 | [-] | 149. | 149. | 139. | 154. | 9.39 | 26.6 | 0.561 | 0.743 | 0.691 | 0.956 | 0.969 | 0.643 | 0.782 | |||
| GSWP3v1 | [-] | 136. | 136. | 139. | 154. | -3.31 | 17.0 | 0.232 | 0.890 | 0.743 | 0.981 | 0.998 | 0.628 | 0.831 | |||
| WFDEI | [-] | 142. | 141. | 139. | 154. | 1.92 | 24.5 | 0.553 | 0.825 | 0.657 | 0.952 | 0.964 | 0.722 | 0.796 |
Download Data |
Period Mean (original grids) [Watt m-2] |
Model Period Mean (intersection) [Watt m-2] |
Model Period Mean (complement) [Watt m-2] |
Benchmark Period Mean (intersection) [Watt m-2] |
Benchmark Period Mean (complement) [Watt m-2] |
Bias [Watt m-2] |
RMSE [Watt m-2] |
Phase Shift [months] |
Bias Score [1] |
RMSE Score [1] |
Seasonal Cycle Score [1] |
Spatial Distribution Score [1] |
Interannual Variability Score [1] |
Overall Score [1] |
|||
|---|---|---|---|---|---|---|---|---|---|---|---|---|---|---|---|---|---|
| Benchmark | [-] | 180. | |||||||||||||||
| CRUNCEPv7 | [-] | 195. | 195. | 178. | 210. | 16.4 | 31.7 | 0.424 | 0.528 | 0.539 | 0.970 | 0.965 | 0.532 | 0.679 | |||
| GSWP3v1 | [-] | 175. | 175. | 178. | 210. | -1.06 | 18.7 | 0.290 | 0.800 | 0.620 | 0.980 | 0.929 | 0.635 | 0.764 | |||
| WFDEI | [-] | 175. | 175. | 178. | 210. | -2.52 | 25.9 | 0.402 | 0.689 | 0.546 | 0.970 | 0.998 | 0.626 | 0.729 |
Download Data |
Period Mean (original grids) [Watt m-2] |
Model Period Mean (intersection) [Watt m-2] |
Model Period Mean (complement) [Watt m-2] |
Benchmark Period Mean (intersection) [Watt m-2] |
Benchmark Period Mean (complement) [Watt m-2] |
Bias [Watt m-2] |
RMSE [Watt m-2] |
Phase Shift [months] |
Bias Score [1] |
RMSE Score [1] |
Seasonal Cycle Score [1] |
Spatial Distribution Score [1] |
Interannual Variability Score [1] |
Overall Score [1] |
|||
|---|---|---|---|---|---|---|---|---|---|---|---|---|---|---|---|---|---|
| Benchmark | [-] | 74.6 | |||||||||||||||
| CRUNCEPv7 | [-] | 63.7 | 64.1 | 74.6 | 74.8 | -11.5 | 22.8 | 0.244 | 0.833 | 0.701 | 0.984 | 0.867 | 0.646 | 0.789 | |||
| GSWP3v1 | [-] | 60.5 | 60.9 | 74.6 | 74.8 | -14.4 | 20.3 | 0.228 | 0.801 | 0.735 | 0.985 | 0.911 | 0.679 | 0.808 | |||
| WFDEI | [-] | 50.8 | 51.3 | 74.6 | 74.8 | -24.0 | 28.6 | 0.237 | 0.693 | 0.708 | 0.984 | 0.939 | 0.763 | 0.799 |
Download Data |
Period Mean (original grids) [Watt m-2] |
Model Period Mean (intersection) [Watt m-2] |
Model Period Mean (complement) [Watt m-2] |
Benchmark Period Mean (intersection) [Watt m-2] |
Benchmark Period Mean (complement) [Watt m-2] |
Bias [Watt m-2] |
RMSE [Watt m-2] |
Phase Shift [months] |
Bias Score [1] |
RMSE Score [1] |
Seasonal Cycle Score [1] |
Spatial Distribution Score [1] |
Interannual Variability Score [1] |
Overall Score [1] |
|||
|---|---|---|---|---|---|---|---|---|---|---|---|---|---|---|---|---|---|
| Benchmark | [-] | 193. | |||||||||||||||
| CRUNCEPv7 | [-] | 193. | 193. | 193. | 202. | -1.42 | 20.6 | 0.505 | 0.825 | 0.679 | 0.965 | 0.942 | 0.582 | 0.779 | |||
| GSWP3v1 | [-] | 190. | 190. | 193. | 202. | -3.35 | 18.2 | 0.157 | 0.850 | 0.706 | 0.988 | 0.998 | 0.606 | 0.809 | |||
| WFDEI | [-] | 194. | 194. | 193. | 202. | -0.299 | 23.6 | 0.286 | 0.831 | 0.629 | 0.979 | 0.991 | 0.690 | 0.791 |
Download Data |
Period Mean (original grids) [Watt m-2] |
Model Period Mean (intersection) [Watt m-2] |
Model Period Mean (complement) [Watt m-2] |
Benchmark Period Mean (intersection) [Watt m-2] |
Benchmark Period Mean (complement) [Watt m-2] |
Bias [Watt m-2] |
RMSE [Watt m-2] |
Phase Shift [months] |
Bias Score [1] |
RMSE Score [1] |
Seasonal Cycle Score [1] |
Spatial Distribution Score [1] |
Interannual Variability Score [1] |
Overall Score [1] |
|||
|---|---|---|---|---|---|---|---|---|---|---|---|---|---|---|---|---|---|
| Benchmark | [-] | 120. | |||||||||||||||
| CRUNCEPv7 | [-] | 132. | 132. | 117. | 151. | 15.4 | 28.2 | 0.236 | 0.736 | 0.746 | 0.984 | 0.994 | 0.643 | 0.808 | |||
| GSWP3v1 | [-] | 113. | 113. | 117. | 151. | -1.04 | 16.2 | 0.267 | 0.906 | 0.803 | 0.981 | 0.998 | 0.620 | 0.852 | |||
| WFDEI | [-] | 113. | 113. | 117. | 151. | -1.91 | 23.0 | 0.292 | 0.866 | 0.734 | 0.979 | 0.974 | 0.741 | 0.838 |
Download Data |
Period Mean (original grids) [Watt m-2] |
Model Period Mean (intersection) [Watt m-2] |
Model Period Mean (complement) [Watt m-2] |
Benchmark Period Mean (intersection) [Watt m-2] |
Benchmark Period Mean (complement) [Watt m-2] |
Bias [Watt m-2] |
RMSE [Watt m-2] |
Phase Shift [months] |
Bias Score [1] |
RMSE Score [1] |
Seasonal Cycle Score [1] |
Spatial Distribution Score [1] |
Interannual Variability Score [1] |
Overall Score [1] |
|||
|---|---|---|---|---|---|---|---|---|---|---|---|---|---|---|---|---|---|
| Benchmark | [-] | 168. | |||||||||||||||
| CRUNCEPv7 | [-] | 143. | 143. | 143. | 180. | 0.159 | 24.0 | 0.587 | 0.710 | 0.631 | 0.935 | 0.954 | 0.552 | 0.736 | |||
| GSWP3v1 | [-] | 137. | 137. | 143. | 180. | -5.71 | 18.9 | 0.261 | 0.786 | 0.673 | 0.974 | 0.966 | 0.623 | 0.783 | |||
| WFDEI | [-] | 136. | 136. | 143. | 180. | -6.95 | 24.3 | 0.483 | 0.723 | 0.619 | 0.950 | 0.959 | 0.655 | 0.754 |
Download Data |
Period Mean (original grids) [Watt m-2] |
Model Period Mean (intersection) [Watt m-2] |
Model Period Mean (complement) [Watt m-2] |
Benchmark Period Mean (intersection) [Watt m-2] |
Benchmark Period Mean (complement) [Watt m-2] |
Bias [Watt m-2] |
RMSE [Watt m-2] |
Phase Shift [months] |
Bias Score [1] |
RMSE Score [1] |
Seasonal Cycle Score [1] |
Spatial Distribution Score [1] |
Interannual Variability Score [1] |
Overall Score [1] |
|||
|---|---|---|---|---|---|---|---|---|---|---|---|---|---|---|---|---|---|
| Benchmark | [-] | 175. | |||||||||||||||
| CRUNCEPv7 | [-] | 168. | 168. | 173. | 224. | -4.36 | 21.7 | 0.385 | 0.706 | 0.696 | 0.967 | 0.996 | 0.590 | 0.775 | |||
| GSWP3v1 | [-] | 162. | 162. | 173. | 224. | -10.2 | 19.6 | 0.295 | 0.716 | 0.729 | 0.974 | 0.990 | 0.578 | 0.786 | |||
| WFDEI | [-] | 172. | 172. | 173. | 224. | -0.873 | 20.7 | 0.465 | 0.741 | 0.690 | 0.961 | 0.994 | 0.561 | 0.773 |
Download Data |
Period Mean (original grids) [Watt m-2] |
Model Period Mean (intersection) [Watt m-2] |
Model Period Mean (complement) [Watt m-2] |
Benchmark Period Mean (intersection) [Watt m-2] |
Benchmark Period Mean (complement) [Watt m-2] |
Bias [Watt m-2] |
RMSE [Watt m-2] |
Phase Shift [months] |
Bias Score [1] |
RMSE Score [1] |
Seasonal Cycle Score [1] |
Spatial Distribution Score [1] |
Interannual Variability Score [1] |
Overall Score [1] |
|||
|---|---|---|---|---|---|---|---|---|---|---|---|---|---|---|---|---|---|
| Benchmark | [-] | 80.0 | |||||||||||||||
| CRUNCEPv7 | [-] | 74.2 | 74.0 | 79.8 | 82.9 | -7.97 | 22.3 | 0.115 | 0.858 | 0.726 | 0.992 | 0.814 | 0.631 | 0.791 | |||
| GSWP3v1 | [-] | 69.1 | 69.0 | 79.8 | 82.9 | -12.2 | 20.7 | 0.0842 | 0.827 | 0.753 | 0.994 | 0.910 | 0.736 | 0.829 | |||
| WFDEI | [-] | 62.1 | 62.0 | 79.8 | 82.9 | -19.3 | 28.1 | 0.176 | 0.748 | 0.712 | 0.988 | 0.853 | 0.770 | 0.797 |
Download Data |
Period Mean (original grids) [Watt m-2] |
Model Period Mean (intersection) [Watt m-2] |
Model Period Mean (complement) [Watt m-2] |
Benchmark Period Mean (intersection) [Watt m-2] |
Benchmark Period Mean (complement) [Watt m-2] |
Bias [Watt m-2] |
RMSE [Watt m-2] |
Phase Shift [months] |
Bias Score [1] |
RMSE Score [1] |
Seasonal Cycle Score [1] |
Spatial Distribution Score [1] |
Interannual Variability Score [1] |
Overall Score [1] |
|||
|---|---|---|---|---|---|---|---|---|---|---|---|---|---|---|---|---|---|
| Benchmark | [-] | 205. | |||||||||||||||
| CRUNCEPv7 | [-] | 189. | 190. | 200. | 227. | -8.91 | 28.6 | 0.818 | 0.608 | 0.590 | 0.916 | 0.661 | 0.524 | 0.648 | |||
| GSWP3v1 | [-] | 192. | 192. | 200. | 227. | -6.02 | 20.0 | 0.221 | 0.770 | 0.638 | 0.977 | 0.896 | 0.625 | 0.757 | |||
| WFDEI | [-] | 193. | 194. | 200. | 227. | -6.84 | 25.3 | 0.303 | 0.692 | 0.599 | 0.969 | 0.963 | 0.601 | 0.737 |
Download Data |
Period Mean (original grids) [Watt m-2] |
Model Period Mean (intersection) [Watt m-2] |
Model Period Mean (complement) [Watt m-2] |
Benchmark Period Mean (intersection) [Watt m-2] |
Benchmark Period Mean (complement) [Watt m-2] |
Bias [Watt m-2] |
RMSE [Watt m-2] |
Phase Shift [months] |
Bias Score [1] |
RMSE Score [1] |
Seasonal Cycle Score [1] |
Spatial Distribution Score [1] |
Interannual Variability Score [1] |
Overall Score [1] |
|||
|---|---|---|---|---|---|---|---|---|---|---|---|---|---|---|---|---|---|
| Benchmark | [-] | 153. | |||||||||||||||
| CRUNCEPv7 | [-] | 157. | 157. | 151. | 194. | 6.76 | 19.6 | 0.445 | 0.845 | 0.744 | 0.971 | 0.999 | 0.546 | 0.808 | |||
| GSWP3v1 | [-] | 144. | 144. | 151. | 194. | -4.68 | 15.8 | 0.124 | 0.913 | 0.772 | 0.992 | 0.999 | 0.618 | 0.844 | |||
| WFDEI | [-] | 150. | 150. | 151. | 194. | 0.713 | 22.8 | 0.281 | 0.908 | 0.679 | 0.980 | 0.992 | 0.755 | 0.832 |
Download Data |
Period Mean (original grids) [Watt m-2] |
Model Period Mean (intersection) [Watt m-2] |
Model Period Mean (complement) [Watt m-2] |
Benchmark Period Mean (intersection) [Watt m-2] |
Benchmark Period Mean (complement) [Watt m-2] |
Bias [Watt m-2] |
RMSE [Watt m-2] |
Phase Shift [months] |
Bias Score [1] |
RMSE Score [1] |
Seasonal Cycle Score [1] |
Spatial Distribution Score [1] |
Interannual Variability Score [1] |
Overall Score [1] |
|||
|---|---|---|---|---|---|---|---|---|---|---|---|---|---|---|---|---|---|
| Benchmark | [-] | 115. | |||||||||||||||
| CRUNCEPv7 | [-] | 123. | 123. | 114. | 123. | 8.11 | 20.5 | 0.210 | 0.869 | 0.778 | 0.986 | 0.970 | 0.578 | 0.827 | |||
| GSWP3v1 | [-] | 112. | 112. | 114. | 123. | -2.84 | 14.6 | 0.0871 | 0.926 | 0.826 | 0.994 | 0.999 | 0.637 | 0.868 | |||
| WFDEI | [-] | 111. | 111. | 114. | 123. | -3.11 | 19.9 | 0.148 | 0.913 | 0.767 | 0.990 | 0.937 | 0.790 | 0.861 |
Download Data |
Period Mean (original grids) [Watt m-2] |
Model Period Mean (intersection) [Watt m-2] |
Model Period Mean (complement) [Watt m-2] |
Benchmark Period Mean (intersection) [Watt m-2] |
Benchmark Period Mean (complement) [Watt m-2] |
Bias [Watt m-2] |
RMSE [Watt m-2] |
Phase Shift [months] |
Bias Score [1] |
RMSE Score [1] |
Seasonal Cycle Score [1] |
Spatial Distribution Score [1] |
Interannual Variability Score [1] |
Overall Score [1] |
|||
|---|---|---|---|---|---|---|---|---|---|---|---|---|---|---|---|---|---|
| Benchmark | [-] | 162. | |||||||||||||||
| CRUNCEPv7 | [-] | 156. | 156. | 162. | 171. | -5.22 | 17.5 | 0.262 | 0.903 | 0.792 | 0.982 | 0.985 | 0.613 | 0.844 | |||
| GSWP3v1 | [-] | 160. | 160. | 162. | 171. | -1.80 | 14.7 | 0.134 | 0.934 | 0.813 | 0.991 | 1.00 | 0.649 | 0.867 | |||
| WFDEI | [-] | 169. | 169. | 162. | 171. | 7.04 | 23.3 | 0.259 | 0.884 | 0.729 | 0.983 | 0.980 | 0.805 | 0.852 |
Download Data |
Period Mean (original grids) [Watt m-2] |
Model Period Mean (intersection) [Watt m-2] |
Model Period Mean (complement) [Watt m-2] |
Benchmark Period Mean (intersection) [Watt m-2] |
Benchmark Period Mean (complement) [Watt m-2] |
Bias [Watt m-2] |
RMSE [Watt m-2] |
Phase Shift [months] |
Bias Score [1] |
RMSE Score [1] |
Seasonal Cycle Score [1] |
Spatial Distribution Score [1] |
Interannual Variability Score [1] |
Overall Score [1] |
|||
|---|---|---|---|---|---|---|---|---|---|---|---|---|---|---|---|---|---|
| Benchmark | [-] | 176. | |||||||||||||||
| CRUNCEPv7 | [-] | 183. | 183. | 174. | 226. | 9.20 | 22.7 | 1.44 | 0.623 | 0.431 | 0.791 | 0.796 | 0.476 | 0.592 | |||
| GSWP3v1 | [-] | 174. | 174. | 174. | 226. | 0.816 | 17.1 | 0.475 | 0.829 | 0.468 | 0.940 | 0.948 | 0.646 | 0.716 | |||
| WFDEI | [-] | 160. | 160. | 174. | 226. | -14.4 | 26.8 | 1.44 | 0.495 | 0.405 | 0.805 | 0.998 | 0.533 | 0.607 |
Download Data |
Period Mean (original grids) [Watt m-2] |
Model Period Mean (intersection) [Watt m-2] |
Model Period Mean (complement) [Watt m-2] |
Benchmark Period Mean (intersection) [Watt m-2] |
Benchmark Period Mean (complement) [Watt m-2] |
Bias [Watt m-2] |
RMSE [Watt m-2] |
Phase Shift [months] |
Bias Score [1] |
RMSE Score [1] |
Seasonal Cycle Score [1] |
Spatial Distribution Score [1] |
Interannual Variability Score [1] |
Overall Score [1] |
|||
|---|---|---|---|---|---|---|---|---|---|---|---|---|---|---|---|---|---|
| Benchmark | [-] | 182. | |||||||||||||||
| CRUNCEPv7 | [-] | 185. | 185. | 181. | 201. | 3.85 | 23.1 | 0.998 | 0.788 | 0.533 | 0.877 | 0.909 | 0.467 | 0.684 | |||
| GSWP3v1 | [-] | 181. | 182. | 181. | 201. | 0.0675 | 19.0 | 0.293 | 0.888 | 0.574 | 0.965 | 0.999 | 0.613 | 0.769 | |||
| WFDEI | [-] | 175. | 175. | 181. | 201. | -6.25 | 24.9 | 0.569 | 0.772 | 0.506 | 0.942 | 0.998 | 0.675 | 0.733 |
Download Data |
Period Mean (original grids) [Watt m-2] |
Model Period Mean (intersection) [Watt m-2] |
Model Period Mean (complement) [Watt m-2] |
Benchmark Period Mean (intersection) [Watt m-2] |
Benchmark Period Mean (complement) [Watt m-2] |
Bias [Watt m-2] |
RMSE [Watt m-2] |
Phase Shift [months] |
Bias Score [1] |
RMSE Score [1] |
Seasonal Cycle Score [1] |
Spatial Distribution Score [1] |
Interannual Variability Score [1] |
Overall Score [1] |
|||
|---|---|---|---|---|---|---|---|---|---|---|---|---|---|---|---|---|---|
| Benchmark | [-] | 176. | |||||||||||||||
| CRUNCEPv7 | [-] | 177. | 176. | 176. | 178. | -1.34 | 28.1 | 0.536 | 0.721 | 0.664 | 0.950 | 0.815 | 0.510 | 0.721 | |||
| GSWP3v1 | [-] | 178. | 176. | 176. | 178. | -2.72 | 20.8 | 0.309 | 0.840 | 0.697 | 0.970 | 0.998 | 0.605 | 0.801 | |||
| WFDEI | [-] | 181. | 181. | 176. | 178. | 1.90 | 28.3 | 0.698 | 0.753 | 0.647 | 0.923 | 0.979 | 0.615 | 0.761 |
Temporally integrated period mean