Mean State
Download Data |
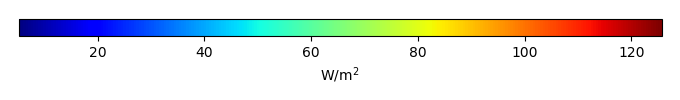
Period Mean (original grids) [W/m2] |
Model Period Mean (intersection) [W/m2] |
Model Period Mean (complement) [W/m2] |
Benchmark Period Mean (intersection) [W/m2] |
Benchmark Period Mean (complement) [W/m2] |
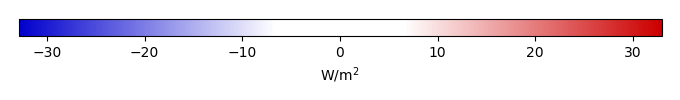
Bias [W/m2] |
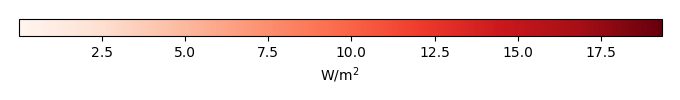
RMSE [W/m2] |
Phase Shift [months] |
Bias Score [1] |
RMSE Score [1] |
Seasonal Cycle Score [1] |
Spatial Distribution Score [1] |
Interannual Variability Score [1] |
Overall Score [1] |
|||
|---|---|---|---|---|---|---|---|---|---|---|---|---|---|---|---|---|---|
| Benchmark | [-] | 31.3 | |||||||||||||||
| CRUNCEPv7 | [-] | 35.9 | 35.6 | 32.3 | 12.4 | 3.93 | 7.37 | 1.61 | 0.356 | 0.402 | 0.775 | 0.979 | 0.468 | 0.564 | |||
| GSWP3v1 | [-] | 33.6 | 33.3 | 32.3 | 12.4 | 1.64 | 7.15 | 1.87 | 0.459 | 0.342 | 0.730 | 0.948 | 0.660 | 0.580 | |||
| WFDEI | [-] | 31.4 | 31.1 | 32.3 | 12.4 | -0.531 | 7.61 | 2.06 | 0.464 | 0.287 | 0.702 | 0.975 | 0.677 | 0.565 |
Download Data |
Period Mean (original grids) [W/m2] |
Model Period Mean (intersection) [W/m2] |
Model Period Mean (complement) [W/m2] |
Benchmark Period Mean (intersection) [W/m2] |
Benchmark Period Mean (complement) [W/m2] |
Bias [W/m2] |
RMSE [W/m2] |
Phase Shift [months] |
Bias Score [1] |
RMSE Score [1] |
Seasonal Cycle Score [1] |
Spatial Distribution Score [1] |
Interannual Variability Score [1] |
Overall Score [1] |
|||
|---|---|---|---|---|---|---|---|---|---|---|---|---|---|---|---|---|---|
| Benchmark | [-] | 44.7 | |||||||||||||||
| CRUNCEPv7 | [-] | 47.1 | 47.6 | 45.1 | 13.9 | 2.30 | 8.28 | 1.11 | 0.471 | 0.422 | 0.870 | 0.984 | 0.591 | 0.627 | |||
| GSWP3v1 | [-] | 45.8 | 46.4 | 45.1 | 13.9 | 0.978 | 8.24 | 1.01 | 0.530 | 0.361 | 0.878 | 0.984 | 0.640 | 0.626 | |||
| WFDEI | [-] | 46.0 | 46.6 | 45.1 | 13.9 | 1.27 | 9.57 | 1.08 | 0.532 | 0.297 | 0.869 | 0.993 | 0.651 | 0.606 |
Download Data |
Period Mean (original grids) [W/m2] |
Model Period Mean (intersection) [W/m2] |
Model Period Mean (complement) [W/m2] |
Benchmark Period Mean (intersection) [W/m2] |
Benchmark Period Mean (complement) [W/m2] |
Bias [W/m2] |
RMSE [W/m2] |
Phase Shift [months] |
Bias Score [1] |
RMSE Score [1] |
Seasonal Cycle Score [1] |
Spatial Distribution Score [1] |
Interannual Variability Score [1] |
Overall Score [1] |
|||
|---|---|---|---|---|---|---|---|---|---|---|---|---|---|---|---|---|---|
| Benchmark | [-] | 33.4 | |||||||||||||||
| CRUNCEPv7 | [-] | 36.1 | 36.1 | 34.3 | 15.0 | 1.97 | 7.61 | 1.18 | 0.561 | 0.485 | 0.843 | 0.932 | 0.535 | 0.640 | |||
| GSWP3v1 | [-] | 35.9 | 35.9 | 34.3 | 15.0 | 1.64 | 7.77 | 1.43 | 0.596 | 0.430 | 0.803 | 0.920 | 0.655 | 0.639 | |||
| WFDEI | [-] | 36.3 | 36.4 | 34.3 | 15.0 | 2.17 | 8.07 | 1.34 | 0.604 | 0.410 | 0.815 | 0.979 | 0.667 | 0.647 |
Download Data |
Period Mean (original grids) [W/m2] |
Model Period Mean (intersection) [W/m2] |
Model Period Mean (complement) [W/m2] |
Benchmark Period Mean (intersection) [W/m2] |
Benchmark Period Mean (complement) [W/m2] |
Bias [W/m2] |
RMSE [W/m2] |
Phase Shift [months] |
Bias Score [1] |
RMSE Score [1] |
Seasonal Cycle Score [1] |
Spatial Distribution Score [1] |
Interannual Variability Score [1] |
Overall Score [1] |
|||
|---|---|---|---|---|---|---|---|---|---|---|---|---|---|---|---|---|---|
| Benchmark | [-] | 40.8 | |||||||||||||||
| CRUNCEPv7 | [-] | 39.0 | 39.0 | 41.2 | 35.6 | -1.36 | 18.6 | 0.224 | 0.861 | 0.694 | 0.985 | 0.983 | 0.682 | 0.817 | |||
| GSWP3v1 | [-] | 36.2 | 36.2 | 41.2 | 35.6 | -4.63 | 19.4 | 0.186 | 0.848 | 0.686 | 0.987 | 0.766 | 0.700 | 0.779 | |||
| WFDEI | [-] | 41.5 | 41.4 | 41.2 | 35.6 | 0.694 | 19.2 | 0.265 | 0.873 | 0.678 | 0.982 | 0.963 | 0.765 | 0.823 |
Download Data |
Period Mean (original grids) [W/m2] |
Model Period Mean (intersection) [W/m2] |
Model Period Mean (complement) [W/m2] |
Benchmark Period Mean (intersection) [W/m2] |
Benchmark Period Mean (complement) [W/m2] |
Bias [W/m2] |
RMSE [W/m2] |
Phase Shift [months] |
Bias Score [1] |
RMSE Score [1] |
Seasonal Cycle Score [1] |
Spatial Distribution Score [1] |
Interannual Variability Score [1] |
Overall Score [1] |
|||
|---|---|---|---|---|---|---|---|---|---|---|---|---|---|---|---|---|---|
| Benchmark | [-] | 17.7 | |||||||||||||||
| CRUNCEPv7 | [-] | 28.5 | 28.5 | 19.3 | 12.3 | 9.74 | 11.0 | 2.11 | 0.245 | 0.395 | 0.653 | 0.329 | 0.468 | 0.414 | |||
| GSWP3v1 | [-] | 26.6 | 26.5 | 19.3 | 12.3 | 7.96 | 9.93 | 1.49 | 0.287 | 0.372 | 0.772 | 0.360 | 0.684 | 0.475 | |||
| WFDEI | [-] | 24.9 | 24.9 | 19.3 | 12.3 | 6.27 | 9.36 | 1.49 | 0.268 | 0.362 | 0.782 | 0.523 | 0.621 | 0.486 |
Download Data |
Period Mean (original grids) [W/m2] |
Model Period Mean (intersection) [W/m2] |
Model Period Mean (complement) [W/m2] |
Benchmark Period Mean (intersection) [W/m2] |
Benchmark Period Mean (complement) [W/m2] |
Bias [W/m2] |
RMSE [W/m2] |
Phase Shift [months] |
Bias Score [1] |
RMSE Score [1] |
Seasonal Cycle Score [1] |
Spatial Distribution Score [1] |
Interannual Variability Score [1] |
Overall Score [1] |
|||
|---|---|---|---|---|---|---|---|---|---|---|---|---|---|---|---|---|---|
| Benchmark | [-] | 28.1 | |||||||||||||||
| CRUNCEPv7 | [-] | 25.3 | 25.1 | 28.2 | 21.3 | -3.06 | 11.5 | 0.210 | 0.802 | 0.622 | 0.985 | 0.962 | 0.609 | 0.767 | |||
| GSWP3v1 | [-] | 23.7 | 23.6 | 28.2 | 21.3 | -4.57 | 11.7 | 0.267 | 0.787 | 0.623 | 0.982 | 0.927 | 0.650 | 0.765 | |||
| WFDEI | [-] | 24.1 | 23.9 | 28.2 | 21.3 | -4.22 | 12.5 | 0.349 | 0.779 | 0.591 | 0.977 | 0.986 | 0.636 | 0.760 |
Download Data |
Period Mean (original grids) [W/m2] |
Model Period Mean (intersection) [W/m2] |
Model Period Mean (complement) [W/m2] |
Benchmark Period Mean (intersection) [W/m2] |
Benchmark Period Mean (complement) [W/m2] |
Bias [W/m2] |
RMSE [W/m2] |
Phase Shift [months] |
Bias Score [1] |
RMSE Score [1] |
Seasonal Cycle Score [1] |
Spatial Distribution Score [1] |
Interannual Variability Score [1] |
Overall Score [1] |
|||
|---|---|---|---|---|---|---|---|---|---|---|---|---|---|---|---|---|---|
| Benchmark | [-] | 35.8 | |||||||||||||||
| CRUNCEPv7 | [-] | 38.7 | 38.6 | 36.5 | 15.2 | 1.38 | 12.5 | 1.04 | 0.621 | 0.514 | 0.863 | 0.923 | 0.657 | 0.682 | |||
| GSWP3v1 | [-] | 34.7 | 34.7 | 36.5 | 15.2 | -2.49 | 11.0 | 0.929 | 0.692 | 0.542 | 0.880 | 0.909 | 0.679 | 0.707 | |||
| WFDEI | [-] | 38.3 | 38.2 | 36.5 | 15.2 | 0.967 | 14.4 | 1.05 | 0.670 | 0.436 | 0.857 | 0.984 | 0.696 | 0.680 |
Download Data |
Period Mean (original grids) [W/m2] |
Model Period Mean (intersection) [W/m2] |
Model Period Mean (complement) [W/m2] |
Benchmark Period Mean (intersection) [W/m2] |
Benchmark Period Mean (complement) [W/m2] |
Bias [W/m2] |
RMSE [W/m2] |
Phase Shift [months] |
Bias Score [1] |
RMSE Score [1] |
Seasonal Cycle Score [1] |
Spatial Distribution Score [1] |
Interannual Variability Score [1] |
Overall Score [1] |
|||
|---|---|---|---|---|---|---|---|---|---|---|---|---|---|---|---|---|---|
| Benchmark | [-] | 29.2 | |||||||||||||||
| CRUNCEPv7 | [-] | 36.4 | 36.4 | 30.4 | 12.7 | 5.18 | 10.1 | 0.949 | 0.469 | 0.456 | 0.890 | 0.915 | 0.598 | 0.631 | |||
| GSWP3v1 | [-] | 32.5 | 32.5 | 30.4 | 12.7 | 1.55 | 9.29 | 1.01 | 0.553 | 0.432 | 0.880 | 0.829 | 0.648 | 0.629 | |||
| WFDEI | [-] | 32.6 | 32.6 | 30.4 | 12.7 | 1.57 | 10.1 | 1.00 | 0.512 | 0.376 | 0.880 | 0.965 | 0.629 | 0.623 |
Download Data |
Period Mean (original grids) [W/m2] |
Model Period Mean (intersection) [W/m2] |
Model Period Mean (complement) [W/m2] |
Benchmark Period Mean (intersection) [W/m2] |
Benchmark Period Mean (complement) [W/m2] |
Bias [W/m2] |
RMSE [W/m2] |
Phase Shift [months] |
Bias Score [1] |
RMSE Score [1] |
Seasonal Cycle Score [1] |
Spatial Distribution Score [1] |
Interannual Variability Score [1] |
Overall Score [1] |
|||
|---|---|---|---|---|---|---|---|---|---|---|---|---|---|---|---|---|---|
| Benchmark | [-] | 36.1 | |||||||||||||||
| CRUNCEPv7 | [-] | 38.9 | 38.7 | 36.1 | 36.1 | 3.04 | 17.3 | 0.196 | 0.889 | 0.708 | 0.987 | 0.961 | 0.662 | 0.819 | |||
| GSWP3v1 | [-] | 34.8 | 34.6 | 36.1 | 36.1 | -1.12 | 16.8 | 0.180 | 0.901 | 0.711 | 0.988 | 0.835 | 0.734 | 0.813 | |||
| WFDEI | [-] | 39.0 | 38.8 | 36.1 | 36.1 | 3.01 | 20.0 | 0.200 | 0.891 | 0.657 | 0.987 | 0.951 | 0.705 | 0.808 |
Download Data |
Period Mean (original grids) [W/m2] |
Model Period Mean (intersection) [W/m2] |
Model Period Mean (complement) [W/m2] |
Benchmark Period Mean (intersection) [W/m2] |
Benchmark Period Mean (complement) [W/m2] |
Bias [W/m2] |
RMSE [W/m2] |
Phase Shift [months] |
Bias Score [1] |
RMSE Score [1] |
Seasonal Cycle Score [1] |
Spatial Distribution Score [1] |
Interannual Variability Score [1] |
Overall Score [1] |
|||
|---|---|---|---|---|---|---|---|---|---|---|---|---|---|---|---|---|---|
| Benchmark | [-] | 36.6 | |||||||||||||||
| CRUNCEPv7 | [-] | 42.6 | 42.6 | 38.5 | 12.8 | 2.82 | 8.25 | 0.663 | 0.660 | 0.577 | 0.943 | 0.926 | 0.668 | 0.725 | |||
| GSWP3v1 | [-] | 41.1 | 41.2 | 38.5 | 12.8 | 1.47 | 8.23 | 0.639 | 0.659 | 0.579 | 0.940 | 0.905 | 0.685 | 0.724 | |||
| WFDEI | [-] | 42.4 | 42.5 | 38.5 | 12.8 | 2.64 | 9.65 | 0.687 | 0.651 | 0.489 | 0.940 | 0.941 | 0.749 | 0.710 |
Download Data |
Period Mean (original grids) [W/m2] |
Model Period Mean (intersection) [W/m2] |
Model Period Mean (complement) [W/m2] |
Benchmark Period Mean (intersection) [W/m2] |
Benchmark Period Mean (complement) [W/m2] |
Bias [W/m2] |
RMSE [W/m2] |
Phase Shift [months] |
Bias Score [1] |
RMSE Score [1] |
Seasonal Cycle Score [1] |
Spatial Distribution Score [1] |
Interannual Variability Score [1] |
Overall Score [1] |
|||
|---|---|---|---|---|---|---|---|---|---|---|---|---|---|---|---|---|---|
| Benchmark | [-] | 19.6 | |||||||||||||||
| CRUNCEPv7 | [-] | 25.8 | 25.9 | 20.5 | 10.1 | 4.78 | 9.13 | 0.782 | 0.643 | 0.585 | 0.911 | 0.951 | 0.654 | 0.722 | |||
| GSWP3v1 | [-] | 21.5 | 21.5 | 20.5 | 10.1 | 0.863 | 8.58 | 0.775 | 0.684 | 0.580 | 0.906 | 0.794 | 0.635 | 0.696 | |||
| WFDEI | [-] | 23.3 | 23.3 | 20.5 | 10.1 | 2.46 | 10.5 | 1.15 | 0.695 | 0.492 | 0.845 | 0.948 | 0.706 | 0.696 |
Download Data |
Period Mean (original grids) [W/m2] |
Model Period Mean (intersection) [W/m2] |
Model Period Mean (complement) [W/m2] |
Benchmark Period Mean (intersection) [W/m2] |
Benchmark Period Mean (complement) [W/m2] |
Bias [W/m2] |
RMSE [W/m2] |
Phase Shift [months] |
Bias Score [1] |
RMSE Score [1] |
Seasonal Cycle Score [1] |
Spatial Distribution Score [1] |
Interannual Variability Score [1] |
Overall Score [1] |
|||
|---|---|---|---|---|---|---|---|---|---|---|---|---|---|---|---|---|---|
| Benchmark | [-] | 24.0 | |||||||||||||||
| CRUNCEPv7 | [-] | 47.5 | 47.5 | 44.8 | 14.0 | 1.82 | 12.5 | 0.789 | 0.636 | 0.567 | 0.904 | 0.990 | 0.583 | 0.708 | |||
| GSWP3v1 | [-] | 44.8 | 44.8 | 44.8 | 14.0 | -0.878 | 12.3 | 0.759 | 0.654 | 0.557 | 0.907 | 0.991 | 0.671 | 0.723 | |||
| WFDEI | [-] | 47.5 | 47.5 | 44.8 | 14.0 | 1.89 | 12.9 | 0.836 | 0.641 | 0.516 | 0.895 | 0.992 | 0.656 | 0.703 |
Download Data |
Period Mean (original grids) [W/m2] |
Model Period Mean (intersection) [W/m2] |
Model Period Mean (complement) [W/m2] |
Benchmark Period Mean (intersection) [W/m2] |
Benchmark Period Mean (complement) [W/m2] |
Bias [W/m2] |
RMSE [W/m2] |
Phase Shift [months] |
Bias Score [1] |
RMSE Score [1] |
Seasonal Cycle Score [1] |
Spatial Distribution Score [1] |
Interannual Variability Score [1] |
Overall Score [1] |
|||
|---|---|---|---|---|---|---|---|---|---|---|---|---|---|---|---|---|---|
| Benchmark | [-] | 72.5 | |||||||||||||||
| CRUNCEPv7 | [-] | 81.3 | 81.1 | 74.7 | 16.4 | 4.39 | 13.7 | 0.716 | 0.576 | 0.592 | 0.930 | 0.985 | 0.711 | 0.731 | |||
| GSWP3v1 | [-] | 78.5 | 78.3 | 74.7 | 16.4 | 1.72 | 13.9 | 0.707 | 0.592 | 0.561 | 0.928 | 0.982 | 0.704 | 0.721 | |||
| WFDEI | [-] | 82.8 | 82.6 | 74.7 | 16.4 | 5.77 | 14.5 | 0.759 | 0.574 | 0.566 | 0.919 | 0.988 | 0.686 | 0.716 |
Download Data |
Period Mean (original grids) [W/m2] |
Model Period Mean (intersection) [W/m2] |
Model Period Mean (complement) [W/m2] |
Benchmark Period Mean (intersection) [W/m2] |
Benchmark Period Mean (complement) [W/m2] |
Bias [W/m2] |
RMSE [W/m2] |
Phase Shift [months] |
Bias Score [1] |
RMSE Score [1] |
Seasonal Cycle Score [1] |
Spatial Distribution Score [1] |
Interannual Variability Score [1] |
Overall Score [1] |
|||
|---|---|---|---|---|---|---|---|---|---|---|---|---|---|---|---|---|---|
| Benchmark | [-] | 46.1 | |||||||||||||||
| CRUNCEPv7 | [-] | 43.4 | 43.3 | 46.3 | 43.2 | -1.47 | 22.8 | 0.362 | 0.855 | 0.661 | 0.972 | 0.981 | 0.594 | 0.787 | |||
| GSWP3v1 | [-] | 38.7 | 38.7 | 46.3 | 43.2 | -6.61 | 22.0 | 0.202 | 0.852 | 0.680 | 0.984 | 0.931 | 0.700 | 0.804 | |||
| WFDEI | [-] | 45.0 | 44.9 | 46.3 | 43.2 | 0.0277 | 23.0 | 0.262 | 0.866 | 0.651 | 0.981 | 0.973 | 0.713 | 0.806 |
Download Data |
Period Mean (original grids) [W/m2] |
Model Period Mean (intersection) [W/m2] |
Model Period Mean (complement) [W/m2] |
Benchmark Period Mean (intersection) [W/m2] |
Benchmark Period Mean (complement) [W/m2] |
Bias [W/m2] |
RMSE [W/m2] |
Phase Shift [months] |
Bias Score [1] |
RMSE Score [1] |
Seasonal Cycle Score [1] |
Spatial Distribution Score [1] |
Interannual Variability Score [1] |
Overall Score [1] |
|||
|---|---|---|---|---|---|---|---|---|---|---|---|---|---|---|---|---|---|
| Benchmark | [-] | 26.3 | |||||||||||||||
| CRUNCEPv7 | [-] | 34.1 | 34.0 | 28.9 | 13.2 | 4.48 | 10.8 | 0.987 | 0.418 | 0.505 | 0.884 | 0.595 | 0.610 | 0.586 | |||
| GSWP3v1 | [-] | 33.8 | 33.8 | 28.9 | 13.2 | 4.32 | 10.3 | 0.711 | 0.446 | 0.500 | 0.912 | 0.684 | 0.672 | 0.619 | |||
| WFDEI | [-] | 34.5 | 34.5 | 28.9 | 13.2 | 4.52 | 10.1 | 0.798 | 0.467 | 0.464 | 0.900 | 0.847 | 0.661 | 0.634 |
Download Data |
Period Mean (original grids) [W/m2] |
Model Period Mean (intersection) [W/m2] |
Model Period Mean (complement) [W/m2] |
Benchmark Period Mean (intersection) [W/m2] |
Benchmark Period Mean (complement) [W/m2] |
Bias [W/m2] |
RMSE [W/m2] |
Phase Shift [months] |
Bias Score [1] |
RMSE Score [1] |
Seasonal Cycle Score [1] |
Spatial Distribution Score [1] |
Interannual Variability Score [1] |
Overall Score [1] |
|||
|---|---|---|---|---|---|---|---|---|---|---|---|---|---|---|---|---|---|
| Benchmark | [-] | 26.9 | |||||||||||||||
| CRUNCEPv7 | [-] | 29.8 | 29.7 | 27.6 | 12.3 | 1.79 | 8.79 | 1.16 | 0.723 | 0.520 | 0.821 | 0.909 | 0.596 | 0.681 | |||
| GSWP3v1 | [-] | 27.0 | 26.8 | 27.6 | 12.3 | -0.918 | 8.37 | 0.999 | 0.687 | 0.542 | 0.848 | 0.832 | 0.643 | 0.682 | |||
| WFDEI | [-] | 31.5 | 31.3 | 27.6 | 12.3 | 3.26 | 12.8 | 1.61 | 0.669 | 0.399 | 0.732 | 0.978 | 0.658 | 0.639 |
Download Data |
Period Mean (original grids) [W/m2] |
Model Period Mean (intersection) [W/m2] |
Model Period Mean (complement) [W/m2] |
Benchmark Period Mean (intersection) [W/m2] |
Benchmark Period Mean (complement) [W/m2] |
Bias [W/m2] |
RMSE [W/m2] |
Phase Shift [months] |
Bias Score [1] |
RMSE Score [1] |
Seasonal Cycle Score [1] |
Spatial Distribution Score [1] |
Interannual Variability Score [1] |
Overall Score [1] |
|||
|---|---|---|---|---|---|---|---|---|---|---|---|---|---|---|---|---|---|
| Benchmark | [-] | 26.3 | |||||||||||||||
| CRUNCEPv7 | [-] | 26.2 | 26.3 | 26.9 | 10.9 | -0.571 | 12.6 | 0.436 | 0.743 | 0.560 | 0.952 | 0.981 | 0.584 | 0.730 | |||
| GSWP3v1 | [-] | 23.4 | 23.6 | 26.9 | 10.9 | -3.43 | 12.3 | 0.404 | 0.727 | 0.573 | 0.953 | 0.955 | 0.613 | 0.732 | |||
| WFDEI | [-] | 25.7 | 25.9 | 26.9 | 10.9 | -1.06 | 13.9 | 0.455 | 0.751 | 0.520 | 0.955 | 0.982 | 0.652 | 0.730 |
Download Data |
Period Mean (original grids) [W/m2] |
Model Period Mean (intersection) [W/m2] |
Model Period Mean (complement) [W/m2] |
Benchmark Period Mean (intersection) [W/m2] |
Benchmark Period Mean (complement) [W/m2] |
Bias [W/m2] |
RMSE [W/m2] |
Phase Shift [months] |
Bias Score [1] |
RMSE Score [1] |
Seasonal Cycle Score [1] |
Spatial Distribution Score [1] |
Interannual Variability Score [1] |
Overall Score [1] |
|||
|---|---|---|---|---|---|---|---|---|---|---|---|---|---|---|---|---|---|
| Benchmark | [-] | 38.3 | |||||||||||||||
| CRUNCEPv7 | [-] | 34.9 | 34.9 | 38.7 | 12.8 | -4.21 | 10.3 | 1.02 | 0.695 | 0.565 | 0.850 | 0.993 | 0.688 | 0.726 | |||
| GSWP3v1 | [-] | 33.6 | 33.7 | 38.7 | 12.8 | -5.41 | 10.3 | 0.981 | 0.657 | 0.589 | 0.851 | 0.989 | 0.723 | 0.733 | |||
| WFDEI | [-] | 39.5 | 39.5 | 38.7 | 12.8 | 0.284 | 12.9 | 1.44 | 0.732 | 0.461 | 0.777 | 0.983 | 0.714 | 0.688 |
Download Data |
Period Mean (original grids) [W/m2] |
Model Period Mean (intersection) [W/m2] |
Model Period Mean (complement) [W/m2] |
Benchmark Period Mean (intersection) [W/m2] |
Benchmark Period Mean (complement) [W/m2] |
Bias [W/m2] |
RMSE [W/m2] |
Phase Shift [months] |
Bias Score [1] |
RMSE Score [1] |
Seasonal Cycle Score [1] |
Spatial Distribution Score [1] |
Interannual Variability Score [1] |
Overall Score [1] |
|||
|---|---|---|---|---|---|---|---|---|---|---|---|---|---|---|---|---|---|
| Benchmark | [-] | 27.6 | |||||||||||||||
| CRUNCEPv7 | [-] | 27.9 | 27.9 | 28.0 | 11.7 | 0.0787 | 5.00 | 1.27 | 0.570 | 0.455 | 0.831 | 0.613 | 0.481 | 0.568 | |||
| GSWP3v1 | [-] | 26.4 | 26.4 | 28.0 | 11.7 | -1.43 | 5.27 | 1.14 | 0.488 | 0.454 | 0.860 | 0.711 | 0.619 | 0.598 | |||
| WFDEI | [-] | 24.2 | 24.2 | 28.0 | 11.7 | -3.63 | 6.61 | 1.27 | 0.314 | 0.447 | 0.840 | 0.843 | 0.526 | 0.569 |
Download Data |
Period Mean (original grids) [W/m2] |
Model Period Mean (intersection) [W/m2] |
Model Period Mean (complement) [W/m2] |
Benchmark Period Mean (intersection) [W/m2] |
Benchmark Period Mean (complement) [W/m2] |
Bias [W/m2] |
RMSE [W/m2] |
Phase Shift [months] |
Bias Score [1] |
RMSE Score [1] |
Seasonal Cycle Score [1] |
Spatial Distribution Score [1] |
Interannual Variability Score [1] |
Overall Score [1] |
|||
|---|---|---|---|---|---|---|---|---|---|---|---|---|---|---|---|---|---|
| Benchmark | [-] | 31.2 | |||||||||||||||
| CRUNCEPv7 | [-] | 31.9 | 31.9 | 31.8 | 11.7 | 0.102 | 6.14 | 0.910 | 0.630 | 0.546 | 0.895 | 0.478 | 0.507 | 0.600 | |||
| GSWP3v1 | [-] | 30.6 | 30.6 | 31.8 | 11.7 | -1.25 | 6.35 | 1.08 | 0.634 | 0.515 | 0.864 | 0.658 | 0.631 | 0.636 | |||
| WFDEI | [-] | 29.3 | 29.2 | 31.8 | 11.7 | -2.57 | 7.31 | 0.882 | 0.542 | 0.485 | 0.889 | 0.616 | 0.685 | 0.617 |
Download Data |
Period Mean (original grids) [W/m2] |
Model Period Mean (intersection) [W/m2] |
Model Period Mean (complement) [W/m2] |
Benchmark Period Mean (intersection) [W/m2] |
Benchmark Period Mean (complement) [W/m2] |
Bias [W/m2] |
RMSE [W/m2] |
Phase Shift [months] |
Bias Score [1] |
RMSE Score [1] |
Seasonal Cycle Score [1] |
Spatial Distribution Score [1] |
Interannual Variability Score [1] |
Overall Score [1] |
|||
|---|---|---|---|---|---|---|---|---|---|---|---|---|---|---|---|---|---|
| Benchmark | [-] | 30.1 | |||||||||||||||
| CRUNCEPv7 | [-] | 33.2 | 33.2 | 32.0 | 13.9 | 0.919 | 10.6 | 0.764 | 0.524 | 0.531 | 0.916 | 0.835 | 0.659 | 0.666 | |||
| GSWP3v1 | [-] | 32.2 | 32.2 | 32.0 | 13.9 | -0.193 | 9.94 | 0.876 | 0.555 | 0.534 | 0.902 | 0.958 | 0.712 | 0.699 | |||
| WFDEI | [-] | 33.8 | 33.9 | 32.0 | 13.9 | 1.63 | 10.9 | 0.722 | 0.552 | 0.507 | 0.923 | 0.975 | 0.712 | 0.696 |
Temporally integrated period mean