Mean State
Download Data |
Period Mean (original grids) [Pg] |
Model Period Mean (intersection) [Pg] |
Model Period Mean (complement) [Pg] |
Benchmark Period Mean (intersection) [Pg] |
Benchmark Period Mean (complement) [Pg] |
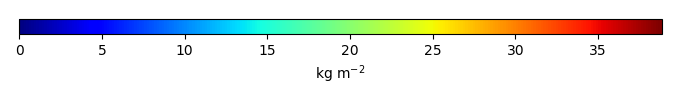
Bias [kg m-2] |
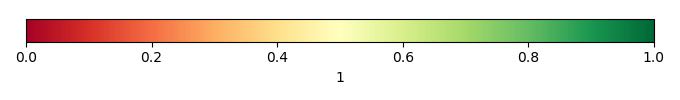
Bias Score [1] |
Spatial Distribution Score [1] |
Overall Score [1] |
|||
|---|---|---|---|---|---|---|---|---|---|---|---|---|
| Benchmark | [-] | 26.2 | ||||||||||
| CLM4.5_CRUNCEPv7 | [-] | 560. | 24.1 | 536. | 26.1 | 0.0878 | 0.0184 | 0.615 | 0.873 | 0.744 | ||
| CLM4.5_GSWP3v1 | [-] | 453. | 17.9 | 435. | 26.1 | 0.0878 | -0.765 | 0.608 | 0.822 | 0.715 | ||
| CLM4_CRUNCEPv7 | [-] | 582. | 21.9 | 560. | 26.1 | 0.0878 | -0.299 | 0.634 | 0.853 | 0.743 | ||
| CLM4_GSWP3v1 | [-] | 467. | 17.5 | 449. | 26.1 | 0.0878 | -0.871 | 0.620 | 0.709 | 0.664 | ||
| CLM5_CRUNCEPv7 | [-] | 589. | 21.7 | 567. | 26.1 | 0.0878 | -0.243 | 0.616 | 0.874 | 0.745 | ||
| CLM5_GSWP3v1 | [-] | 487. | 15.3 | 472. | 26.1 | 0.0878 | -1.07 | 0.599 | 0.789 | 0.694 |
Download Data |
Period Mean (original grids) [Pg] |
Model Period Mean (intersection) [Pg] |
Model Period Mean (complement) [Pg] |
Benchmark Period Mean (intersection) [Pg] |
Benchmark Period Mean (complement) [Pg] |
Bias [kg m-2] |
Bias Score [1] |
Spatial Distribution Score [1] |
Overall Score [1] |
|||
|---|---|---|---|---|---|---|---|---|---|---|---|---|
| Benchmark | [-] | 0.00338 | ||||||||||
| CLM4.5_CRUNCEPv7 | [-] | 11.4 | 0.0180 | 11.1 | 0.00338 | 0.232 | 0.361 | 0.296 | 0.328 | |||
| CLM4.5_GSWP3v1 | [-] | 8.49 | 0.0216 | 8.21 | 0.00338 | 0.274 | 0.258 | 0.330 | 0.294 | |||
| CLM4_CRUNCEPv7 | [-] | 5.39 | 0.00986 | 5.08 | 0.00338 | 0.0933 | 0.616 | 0.679 | 0.647 | |||
| CLM4_GSWP3v1 | [-] | 4.65 | 0.0142 | 4.37 | 0.00338 | 0.136 | 0.566 | 0.637 | 0.602 | |||
| CLM5_CRUNCEPv7 | [-] | 11.9 | 0.0255 | 11.6 | 0.00338 | 0.302 | 0.360 | 0.401 | 0.380 | |||
| CLM5_GSWP3v1 | [-] | 10.2 | 0.0260 | 9.91 | 0.00338 | 0.333 | 0.269 | 0.365 | 0.317 |
Download Data |
Period Mean (original grids) [Pg] |
Model Period Mean (intersection) [Pg] |
Model Period Mean (complement) [Pg] |
Benchmark Period Mean (intersection) [Pg] |
Benchmark Period Mean (complement) [Pg] |
Bias [kg m-2] |
Bias Score [1] |
Spatial Distribution Score [1] |
Overall Score [1] |
|||
|---|---|---|---|---|---|---|---|---|---|---|---|---|
| Benchmark | [-] | 17.5 | ||||||||||
| CLM4.5_CRUNCEPv7 | [-] | 20.4 | 19.9 | 0.326 | 17.4 | 0.0333 | 0.973 | 0.680 | 0.896 | 0.788 | ||
| CLM4.5_GSWP3v1 | [-] | 14.7 | 14.3 | 0.264 | 17.4 | 0.0333 | -0.452 | 0.672 | 0.921 | 0.797 | ||
| CLM4_CRUNCEPv7 | [-] | 16.4 | 16.0 | 0.266 | 17.4 | 0.0333 | -0.0421 | 0.666 | 0.908 | 0.787 | ||
| CLM4_GSWP3v1 | [-] | 13.4 | 13.1 | 0.201 | 17.4 | 0.0333 | -0.810 | 0.665 | 0.847 | 0.756 | ||
| CLM5_CRUNCEPv7 | [-] | 17.8 | 17.4 | 0.303 | 17.4 | 0.0333 | 0.386 | 0.671 | 0.907 | 0.789 | ||
| CLM5_GSWP3v1 | [-] | 12.0 | 11.6 | 0.234 | 17.4 | 0.0333 | -1.09 | 0.649 | 0.883 | 0.766 |
Download Data |
Period Mean (original grids) [Pg] |
Model Period Mean (intersection) [Pg] |
Model Period Mean (complement) [Pg] |
Benchmark Period Mean (intersection) [Pg] |
Benchmark Period Mean (complement) [Pg] |
Bias [kg m-2] |
Bias Score [1] |
Spatial Distribution Score [1] |
Overall Score [1] |
|||
|---|---|---|---|---|---|---|---|---|---|---|---|---|
| Benchmark | [-] | 0.222 | ||||||||||
| CLM4.5_CRUNCEPv7 | [-] | 34.8 | 0.804 | 34.2 | 0.222 | 6.81 | 0.333 | 0.460 | 0.396 | |||
| CLM4.5_GSWP3v1 | [-] | 28.1 | 0.645 | 27.6 | 0.222 | 5.00 | 0.395 | 0.574 | 0.485 | |||
| CLM4_CRUNCEPv7 | [-] | 25.1 | 0.735 | 24.5 | 0.222 | 6.06 | 0.353 | 0.395 | 0.374 | |||
| CLM4_GSWP3v1 | [-] | 16.3 | 0.426 | 16.0 | 0.222 | 2.45 | 0.537 | 0.610 | 0.573 | |||
| CLM5_CRUNCEPv7 | [-] | 56.8 | 0.907 | 56.1 | 0.222 | 8.04 | 0.289 | 0.391 | 0.340 | |||
| CLM5_GSWP3v1 | [-] | 43.6 | 0.598 | 43.2 | 0.222 | 4.61 | 0.414 | 0.642 | 0.528 |
Download Data |
Period Mean (original grids) [Pg] |
Model Period Mean (intersection) [Pg] |
Model Period Mean (complement) [Pg] |
Benchmark Period Mean (intersection) [Pg] |
Benchmark Period Mean (complement) [Pg] |
Bias [kg m-2] |
Bias Score [1] |
Spatial Distribution Score [1] |
Overall Score [1] |
|||
|---|---|---|---|---|---|---|---|---|---|---|---|---|
| Benchmark | [-] | 8.47 | ||||||||||
| CLM4.5_CRUNCEPv7 | [-] | 3.42 | 3.42 | 0.0387 | 8.42 | 0.0520 | -1.16 | 0.489 | 0.369 | 0.429 | ||
| CLM4.5_GSWP3v1 | [-] | 2.99 | 3.00 | 0.0350 | 8.42 | 0.0520 | -1.26 | 0.479 | 0.302 | 0.390 | ||
| CLM4_CRUNCEPv7 | [-] | 5.11 | 5.12 | 0.0325 | 8.42 | 0.0520 | -0.736 | 0.573 | 0.571 | 0.572 | ||
| CLM4_GSWP3v1 | [-] | 4.00 | 4.02 | 0.0255 | 8.42 | 0.0520 | -1.04 | 0.527 | 0.330 | 0.428 | ||
| CLM5_CRUNCEPv7 | [-] | 3.49 | 3.46 | 0.0505 | 8.42 | 0.0520 | -1.12 | 0.507 | 0.698 | 0.603 | ||
| CLM5_GSWP3v1 | [-] | 3.04 | 3.04 | 0.0355 | 8.42 | 0.0520 | -1.23 | 0.500 | 0.546 | 0.523 |
Temporally integrated period mean