Mean State
Download Data |
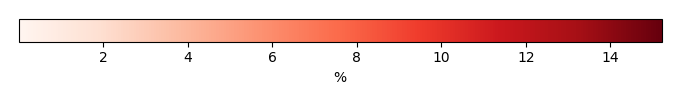
Period Mean (original grids) [%] |
Model Period Mean (intersection) [%] |
Model Period Mean (complement) [%] |
Benchmark Period Mean (intersection) [%] |
Benchmark Period Mean (complement) [%] |
Bias [%] |
RMSE [%] |
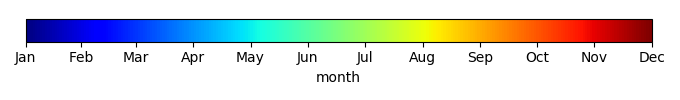
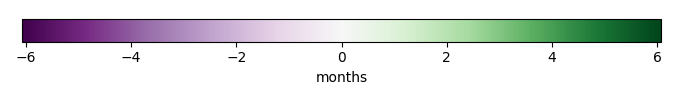
Phase Shift [months] |
Bias Score [1] |
RMSE Score [1] |
Seasonal Cycle Score [1] |
Spatial Distribution Score [1] |
Interannual Variability Score [1] |
Overall Score [1] |
|||
|---|---|---|---|---|---|---|---|---|---|---|---|---|---|---|---|---|---|
| Benchmark | [-] | 77.9 | |||||||||||||||
| CLM4.5_CRUNCEPv7 | [-] | 74.5 | 74.5 | 77.8 | 80.3 | -3.06 | 8.09 | 1.52 | 0.442 | 0.449 | 0.794 | 0.963 | 0.573 | 0.612 | |||
| CLM4.5_GSWP3v1 | [-] | 70.5 | 70.7 | 77.8 | 80.3 | -6.51 | 12.4 | 1.88 | 0.352 | 0.258 | 0.732 | 0.995 | 0.553 | 0.525 | |||
| CLM4_CRUNCEPv7 | [-] | 75.3 | 75.4 | 77.8 | 80.3 | -2.24 | 7.42 | 1.47 | 0.495 | 0.451 | 0.800 | 0.972 | 0.595 | 0.627 | |||
| CLM4_GSWP3v1 | [-] | 71.0 | 71.2 | 77.8 | 80.3 | -5.99 | 12.5 | 1.92 | 0.368 | 0.249 | 0.723 | 0.989 | 0.521 | 0.516 | |||
| CLM5_CRUNCEPv7 | [-] | 72.1 | 72.1 | 77.8 | 80.3 | -5.40 | 10.0 | 1.78 | 0.324 | 0.444 | 0.747 | 0.900 | 0.600 | 0.576 | |||
| CLM5_GSWP3v1 | [-] | 68.7 | 68.9 | 77.8 | 80.3 | -8.28 | 14.1 | 1.93 | 0.336 | 0.234 | 0.722 | 0.997 | 0.484 | 0.501 |
Download Data |
Period Mean (original grids) [%] |
Model Period Mean (intersection) [%] |
Model Period Mean (complement) [%] |
Benchmark Period Mean (intersection) [%] |
Benchmark Period Mean (complement) [%] |
Bias [%] |
RMSE [%] |
Phase Shift [months] |
Bias Score [1] |
RMSE Score [1] |
Seasonal Cycle Score [1] |
Spatial Distribution Score [1] |
Interannual Variability Score [1] |
Overall Score [1] |
|||
|---|---|---|---|---|---|---|---|---|---|---|---|---|---|---|---|---|---|
| Benchmark | [-] | 53.6 | |||||||||||||||
| CLM4.5_CRUNCEPv7 | [-] | 52.1 | 51.5 | 53.2 | 77.5 | -1.48 | 10.7 | 0.266 | 0.744 | 0.633 | 0.961 | 0.931 | 0.568 | 0.745 | |||
| CLM4.5_GSWP3v1 | [-] | 52.2 | 51.7 | 53.2 | 77.5 | -1.33 | 11.8 | 0.545 | 0.732 | 0.595 | 0.928 | 0.966 | 0.834 | 0.775 | |||
| CLM4_CRUNCEPv7 | [-] | 53.1 | 52.5 | 53.2 | 77.5 | -0.553 | 9.97 | 0.219 | 0.775 | 0.642 | 0.967 | 0.975 | 0.572 | 0.762 | |||
| CLM4_GSWP3v1 | [-] | 52.9 | 52.4 | 53.2 | 77.5 | -0.675 | 11.6 | 0.538 | 0.746 | 0.593 | 0.929 | 0.986 | 0.835 | 0.780 | |||
| CLM5_CRUNCEPv7 | [-] | 50.6 | 50.1 | 53.2 | 77.5 | -2.88 | 10.7 | 0.255 | 0.722 | 0.638 | 0.962 | 0.930 | 0.550 | 0.740 | |||
| CLM5_GSWP3v1 | [-] | 51.0 | 50.5 | 53.2 | 77.5 | -2.52 | 11.8 | 0.548 | 0.733 | 0.592 | 0.929 | 0.969 | 0.837 | 0.775 |
Download Data |
Period Mean (original grids) [%] |
Model Period Mean (intersection) [%] |
Model Period Mean (complement) [%] |
Benchmark Period Mean (intersection) [%] |
Benchmark Period Mean (complement) [%] |
Bias [%] |
RMSE [%] |
Phase Shift [months] |
Bias Score [1] |
RMSE Score [1] |
Seasonal Cycle Score [1] |
Spatial Distribution Score [1] |
Interannual Variability Score [1] |
Overall Score [1] |
|||
|---|---|---|---|---|---|---|---|---|---|---|---|---|---|---|---|---|---|
| Benchmark | [-] | 64.2 | |||||||||||||||
| CLM4.5_CRUNCEPv7 | [-] | 62.3 | 62.2 | 63.5 | 77.8 | 0.0313 | 9.81 | 1.04 | 0.636 | 0.501 | 0.856 | 0.958 | 0.567 | 0.670 | |||
| CLM4.5_GSWP3v1 | [-] | 61.9 | 61.9 | 63.5 | 77.8 | -0.262 | 11.4 | 1.17 | 0.579 | 0.442 | 0.839 | 0.974 | 0.768 | 0.674 | |||
| CLM4_CRUNCEPv7 | [-] | 63.5 | 63.5 | 63.5 | 77.8 | 1.05 | 9.19 | 1.09 | 0.668 | 0.511 | 0.845 | 0.969 | 0.565 | 0.678 | |||
| CLM4_GSWP3v1 | [-] | 62.8 | 62.7 | 63.5 | 77.8 | 0.403 | 11.4 | 1.20 | 0.588 | 0.437 | 0.833 | 0.982 | 0.776 | 0.676 | |||
| CLM5_CRUNCEPv7 | [-] | 61.2 | 61.1 | 63.5 | 77.8 | -1.03 | 10.0 | 0.996 | 0.623 | 0.497 | 0.864 | 0.951 | 0.543 | 0.663 | |||
| CLM5_GSWP3v1 | [-] | 61.1 | 61.1 | 63.5 | 77.8 | -1.12 | 11.5 | 1.17 | 0.595 | 0.435 | 0.837 | 0.971 | 0.749 | 0.670 |
Download Data |
Period Mean (original grids) [%] |
Model Period Mean (intersection) [%] |
Model Period Mean (complement) [%] |
Benchmark Period Mean (intersection) [%] |
Benchmark Period Mean (complement) [%] |
Bias [%] |
RMSE [%] |
Phase Shift [months] |
Bias Score [1] |
RMSE Score [1] |
Seasonal Cycle Score [1] |
Spatial Distribution Score [1] |
Interannual Variability Score [1] |
Overall Score [1] |
|||
|---|---|---|---|---|---|---|---|---|---|---|---|---|---|---|---|---|---|
| Benchmark | [-] | 77.6 | |||||||||||||||
| CLM4.5_CRUNCEPv7 | [-] | 80.9 | 80.8 | 77.1 | 83.4 | 5.31 | 14.8 | 2.79 | 0.305 | 0.120 | 0.536 | 0.667 | 0.356 | 0.351 | |||
| CLM4.5_GSWP3v1 | [-] | 89.7 | 89.7 | 77.1 | 83.4 | 12.9 | 18.4 | 2.36 | 0.0880 | 0.0806 | 0.638 | 0.650 | 0.682 | 0.370 | |||
| CLM4_CRUNCEPv7 | [-] | 80.1 | 80.0 | 77.1 | 83.4 | 4.52 | 15.5 | 3.18 | 0.303 | 0.106 | 0.460 | 0.622 | 0.328 | 0.321 | |||
| CLM4_GSWP3v1 | [-] | 89.4 | 89.4 | 77.1 | 83.4 | 12.5 | 18.5 | 2.94 | 0.0947 | 0.0754 | 0.520 | 0.668 | 0.659 | 0.349 | |||
| CLM5_CRUNCEPv7 | [-] | 74.8 | 74.7 | 77.1 | 83.4 | -0.231 | 17.2 | 2.92 | 0.278 | 0.0954 | 0.509 | 0.434 | 0.245 | 0.276 | |||
| CLM5_GSWP3v1 | [-] | 88.5 | 88.5 | 77.1 | 83.4 | 11.6 | 17.7 | 2.76 | 0.114 | 0.0792 | 0.549 | 0.727 | 0.555 | 0.350 |
Download Data |
Period Mean (original grids) [%] |
Model Period Mean (intersection) [%] |
Model Period Mean (complement) [%] |
Benchmark Period Mean (intersection) [%] |
Benchmark Period Mean (complement) [%] |
Bias [%] |
RMSE [%] |
Phase Shift [months] |
Bias Score [1] |
RMSE Score [1] |
Seasonal Cycle Score [1] |
Spatial Distribution Score [1] |
Interannual Variability Score [1] |
Overall Score [1] |
|||
|---|---|---|---|---|---|---|---|---|---|---|---|---|---|---|---|---|---|
| Benchmark | [-] | 84.2 | |||||||||||||||
| CLM4.5_CRUNCEPv7 | [-] | 86.8 | 86.8 | 85.0 | 81.2 | 1.68 | 5.11 | 1.51 | 0.428 | 0.408 | 0.791 | 0.986 | 0.611 | 0.605 | |||
| CLM4.5_GSWP3v1 | [-] | 87.2 | 87.3 | 85.0 | 81.2 | 1.64 | 5.01 | 1.54 | 0.535 | 0.285 | 0.776 | 0.989 | 0.641 | 0.585 | |||
| CLM4_CRUNCEPv7 | [-] | 87.4 | 87.4 | 85.0 | 81.2 | 2.09 | 5.14 | 1.49 | 0.422 | 0.407 | 0.793 | 0.970 | 0.627 | 0.604 | |||
| CLM4_GSWP3v1 | [-] | 88.2 | 88.3 | 85.0 | 81.2 | 2.30 | 5.31 | 1.53 | 0.488 | 0.270 | 0.779 | 0.998 | 0.605 | 0.568 | |||
| CLM5_CRUNCEPv7 | [-] | 83.2 | 83.2 | 85.0 | 81.2 | -1.66 | 5.15 | 1.75 | 0.441 | 0.407 | 0.739 | 0.940 | 0.580 | 0.586 | |||
| CLM5_GSWP3v1 | [-] | 85.2 | 85.2 | 85.0 | 81.2 | -0.688 | 5.23 | 1.42 | 0.587 | 0.237 | 0.797 | 0.998 | 0.516 | 0.562 |
Download Data |
Period Mean (original grids) [%] |
Model Period Mean (intersection) [%] |
Model Period Mean (complement) [%] |
Benchmark Period Mean (intersection) [%] |
Benchmark Period Mean (complement) [%] |
Bias [%] |
RMSE [%] |
Phase Shift [months] |
Bias Score [1] |
RMSE Score [1] |
Seasonal Cycle Score [1] |
Spatial Distribution Score [1] |
Interannual Variability Score [1] |
Overall Score [1] |
|||
|---|---|---|---|---|---|---|---|---|---|---|---|---|---|---|---|---|---|
| Benchmark | [-] | 72.3 | |||||||||||||||
| CLM4.5_CRUNCEPv7 | [-] | 80.6 | 80.7 | 72.2 | 78.9 | 8.49 | 12.3 | 1.67 | 0.372 | 0.434 | 0.772 | 0.807 | 0.676 | 0.583 | |||
| CLM4.5_GSWP3v1 | [-] | 84.5 | 84.6 | 72.2 | 78.9 | 12.3 | 18.6 | 1.41 | 0.256 | 0.220 | 0.811 | 0.975 | 0.726 | 0.535 | |||
| CLM4_CRUNCEPv7 | [-] | 80.2 | 80.2 | 72.2 | 78.9 | 8.06 | 12.0 | 1.74 | 0.378 | 0.434 | 0.760 | 0.803 | 0.683 | 0.582 | |||
| CLM4_GSWP3v1 | [-] | 84.0 | 84.1 | 72.2 | 78.9 | 11.8 | 18.3 | 1.49 | 0.273 | 0.215 | 0.792 | 0.971 | 0.706 | 0.529 | |||
| CLM5_CRUNCEPv7 | [-] | 75.6 | 75.6 | 72.2 | 78.9 | 3.46 | 11.1 | 1.85 | 0.482 | 0.407 | 0.736 | 0.603 | 0.631 | 0.544 | |||
| CLM5_GSWP3v1 | [-] | 82.6 | 82.6 | 72.2 | 78.9 | 10.4 | 17.9 | 2.16 | 0.321 | 0.199 | 0.684 | 0.974 | 0.573 | 0.492 |
Download Data |
Period Mean (original grids) [%] |
Model Period Mean (intersection) [%] |
Model Period Mean (complement) [%] |
Benchmark Period Mean (intersection) [%] |
Benchmark Period Mean (complement) [%] |
Bias [%] |
RMSE [%] |
Phase Shift [months] |
Bias Score [1] |
RMSE Score [1] |
Seasonal Cycle Score [1] |
Spatial Distribution Score [1] |
Interannual Variability Score [1] |
Overall Score [1] |
|||
|---|---|---|---|---|---|---|---|---|---|---|---|---|---|---|---|---|---|
| Benchmark | [-] | 61.3 | |||||||||||||||
| CLM4.5_CRUNCEPv7 | [-] | 59.2 | 59.3 | 61.0 | 71.3 | -0.460 | 13.0 | 1.32 | 0.498 | 0.528 | 0.819 | 0.882 | 0.797 | 0.676 | |||
| CLM4.5_GSWP3v1 | [-] | 66.6 | 66.9 | 61.0 | 71.3 | 6.53 | 16.4 | 1.91 | 0.488 | 0.336 | 0.714 | 0.988 | 0.827 | 0.615 | |||
| CLM4_CRUNCEPv7 | [-] | 59.6 | 59.8 | 61.0 | 71.3 | -0.0660 | 12.7 | 1.33 | 0.511 | 0.526 | 0.818 | 0.903 | 0.814 | 0.683 | |||
| CLM4_GSWP3v1 | [-] | 66.6 | 66.8 | 61.0 | 71.3 | 6.48 | 16.8 | 1.88 | 0.484 | 0.328 | 0.718 | 0.988 | 0.818 | 0.611 | |||
| CLM5_CRUNCEPv7 | [-] | 56.0 | 56.2 | 61.0 | 71.3 | -3.57 | 13.4 | 1.41 | 0.531 | 0.521 | 0.804 | 0.893 | 0.817 | 0.681 | |||
| CLM5_GSWP3v1 | [-] | 65.2 | 65.4 | 61.0 | 71.3 | 5.02 | 16.2 | 1.97 | 0.540 | 0.322 | 0.705 | 0.994 | 0.756 | 0.606 |
Download Data |
Period Mean (original grids) [%] |
Model Period Mean (intersection) [%] |
Model Period Mean (complement) [%] |
Benchmark Period Mean (intersection) [%] |
Benchmark Period Mean (complement) [%] |
Bias [%] |
RMSE [%] |
Phase Shift [months] |
Bias Score [1] |
RMSE Score [1] |
Seasonal Cycle Score [1] |
Spatial Distribution Score [1] |
Interannual Variability Score [1] |
Overall Score [1] |
|||
|---|---|---|---|---|---|---|---|---|---|---|---|---|---|---|---|---|---|
| Benchmark | [-] | 69.0 | |||||||||||||||
| CLM4.5_CRUNCEPv7 | [-] | 62.6 | 62.7 | 68.3 | 79.0 | -3.26 | 9.20 | 0.817 | 0.622 | 0.526 | 0.887 | 0.983 | 0.669 | 0.702 | |||
| CLM4.5_GSWP3v1 | [-] | 63.9 | 63.6 | 68.3 | 79.0 | -2.26 | 10.8 | 0.982 | 0.615 | 0.410 | 0.866 | 0.939 | 0.701 | 0.657 | |||
| CLM4_CRUNCEPv7 | [-] | 63.4 | 63.4 | 68.3 | 79.0 | -2.65 | 8.72 | 0.803 | 0.648 | 0.528 | 0.888 | 0.981 | 0.677 | 0.708 | |||
| CLM4_GSWP3v1 | [-] | 64.5 | 64.2 | 68.3 | 79.0 | -1.74 | 11.0 | 0.966 | 0.626 | 0.398 | 0.868 | 0.929 | 0.676 | 0.649 | |||
| CLM5_CRUNCEPv7 | [-] | 60.3 | 60.4 | 68.3 | 79.0 | -5.50 | 10.3 | 0.730 | 0.550 | 0.530 | 0.901 | 0.984 | 0.646 | 0.690 | |||
| CLM5_GSWP3v1 | [-] | 62.1 | 61.8 | 68.3 | 79.0 | -4.10 | 11.5 | 0.920 | 0.608 | 0.395 | 0.875 | 0.943 | 0.655 | 0.645 |
Download Data |
Period Mean (original grids) [%] |
Model Period Mean (intersection) [%] |
Model Period Mean (complement) [%] |
Benchmark Period Mean (intersection) [%] |
Benchmark Period Mean (complement) [%] |
Bias [%] |
RMSE [%] |
Phase Shift [months] |
Bias Score [1] |
RMSE Score [1] |
Seasonal Cycle Score [1] |
Spatial Distribution Score [1] |
Interannual Variability Score [1] |
Overall Score [1] |
|||
|---|---|---|---|---|---|---|---|---|---|---|---|---|---|---|---|---|---|
| Benchmark | [-] | 78.8 | |||||||||||||||
| CLM4.5_CRUNCEPv7 | [-] | 85.7 | 85.7 | 78.5 | 84.9 | 7.75 | 13.4 | 2.69 | 0.231 | 0.177 | 0.550 | 0.855 | 0.489 | 0.413 | |||
| CLM4.5_GSWP3v1 | [-] | 89.8 | 89.8 | 78.5 | 84.9 | 11.4 | 16.9 | 1.61 | 0.123 | 0.101 | 0.788 | 0.742 | 0.636 | 0.415 | |||
| CLM4_CRUNCEPv7 | [-] | 84.7 | 84.7 | 78.5 | 84.9 | 6.83 | 13.9 | 2.74 | 0.257 | 0.155 | 0.536 | 0.808 | 0.461 | 0.395 | |||
| CLM4_GSWP3v1 | [-] | 89.2 | 89.2 | 78.5 | 84.9 | 10.8 | 17.2 | 1.99 | 0.139 | 0.0891 | 0.710 | 0.797 | 0.601 | 0.404 | |||
| CLM5_CRUNCEPv7 | [-] | 81.3 | 81.3 | 78.5 | 84.9 | 3.61 | 13.4 | 2.66 | 0.326 | 0.159 | 0.551 | 0.615 | 0.365 | 0.363 | |||
| CLM5_GSWP3v1 | [-] | 88.9 | 88.9 | 78.5 | 84.9 | 10.5 | 16.2 | 3.05 | 0.149 | 0.102 | 0.497 | 0.827 | 0.518 | 0.366 |
Download Data |
Period Mean (original grids) [%] |
Model Period Mean (intersection) [%] |
Model Period Mean (complement) [%] |
Benchmark Period Mean (intersection) [%] |
Benchmark Period Mean (complement) [%] |
Bias [%] |
RMSE [%] |
Phase Shift [months] |
Bias Score [1] |
RMSE Score [1] |
Seasonal Cycle Score [1] |
Spatial Distribution Score [1] |
Interannual Variability Score [1] |
Overall Score [1] |
|||
|---|---|---|---|---|---|---|---|---|---|---|---|---|---|---|---|---|---|
| Benchmark | [-] | 53.1 | |||||||||||||||
| CLM4.5_CRUNCEPv7 | [-] | 52.8 | 52.8 | 51.3 | 74.6 | 3.79 | 8.93 | 0.451 | 0.586 | 0.526 | 0.916 | 0.951 | 0.613 | 0.686 | |||
| CLM4.5_GSWP3v1 | [-] | 51.3 | 51.3 | 51.3 | 74.6 | 2.57 | 7.42 | 0.514 | 0.687 | 0.518 | 0.910 | 0.997 | 0.806 | 0.739 | |||
| CLM4_CRUNCEPv7 | [-] | 52.4 | 52.4 | 51.3 | 74.6 | 3.36 | 8.71 | 0.448 | 0.595 | 0.528 | 0.917 | 0.955 | 0.609 | 0.688 | |||
| CLM4_GSWP3v1 | [-] | 50.8 | 50.8 | 51.3 | 74.6 | 2.11 | 7.29 | 0.517 | 0.703 | 0.514 | 0.910 | 0.998 | 0.807 | 0.741 | |||
| CLM5_CRUNCEPv7 | [-] | 51.1 | 51.0 | 51.3 | 74.6 | 2.10 | 8.87 | 0.507 | 0.594 | 0.516 | 0.910 | 0.947 | 0.588 | 0.679 | |||
| CLM5_GSWP3v1 | [-] | 50.0 | 50.0 | 51.3 | 74.6 | 1.27 | 6.95 | 0.506 | 0.738 | 0.518 | 0.913 | 0.997 | 0.801 | 0.748 |
Download Data |
Period Mean (original grids) [%] |
Model Period Mean (intersection) [%] |
Model Period Mean (complement) [%] |
Benchmark Period Mean (intersection) [%] |
Benchmark Period Mean (complement) [%] |
Bias [%] |
RMSE [%] |
Phase Shift [months] |
Bias Score [1] |
RMSE Score [1] |
Seasonal Cycle Score [1] |
Spatial Distribution Score [1] |
Interannual Variability Score [1] |
Overall Score [1] |
|||
|---|---|---|---|---|---|---|---|---|---|---|---|---|---|---|---|---|---|
| Benchmark | [-] | 76.7 | |||||||||||||||
| CLM4.5_CRUNCEPv7 | [-] | 80.0 | 80.0 | 76.6 | 78.3 | 3.95 | 6.61 | 1.19 | 0.536 | 0.519 | 0.847 | 0.905 | 0.811 | 0.689 | |||
| CLM4.5_GSWP3v1 | [-] | 79.8 | 79.8 | 76.6 | 78.3 | 3.20 | 9.31 | 0.885 | 0.574 | 0.331 | 0.879 | 0.809 | 0.732 | 0.609 | |||
| CLM4_CRUNCEPv7 | [-] | 79.5 | 79.5 | 76.6 | 78.3 | 3.46 | 6.38 | 1.17 | 0.574 | 0.511 | 0.845 | 0.904 | 0.812 | 0.693 | |||
| CLM4_GSWP3v1 | [-] | 79.2 | 79.2 | 76.6 | 78.3 | 2.67 | 9.32 | 0.914 | 0.596 | 0.319 | 0.869 | 0.813 | 0.704 | 0.603 | |||
| CLM5_CRUNCEPv7 | [-] | 77.0 | 77.0 | 76.6 | 78.3 | 1.10 | 5.80 | 1.20 | 0.646 | 0.512 | 0.841 | 0.845 | 0.820 | 0.696 | |||
| CLM5_GSWP3v1 | [-] | 77.5 | 77.5 | 76.6 | 78.3 | 0.920 | 9.32 | 0.889 | 0.609 | 0.308 | 0.878 | 0.777 | 0.624 | 0.584 |
Download Data |
Period Mean (original grids) [%] |
Model Period Mean (intersection) [%] |
Model Period Mean (complement) [%] |
Benchmark Period Mean (intersection) [%] |
Benchmark Period Mean (complement) [%] |
Bias [%] |
RMSE [%] |
Phase Shift [months] |
Bias Score [1] |
RMSE Score [1] |
Seasonal Cycle Score [1] |
Spatial Distribution Score [1] |
Interannual Variability Score [1] |
Overall Score [1] |
|||
|---|---|---|---|---|---|---|---|---|---|---|---|---|---|---|---|---|---|
| Benchmark | [-] | 74.9 | |||||||||||||||
| CLM4.5_CRUNCEPv7 | [-] | 68.4 | 68.4 | 65.3 | 79.6 | 4.60 | 12.0 | 1.40 | 0.437 | 0.420 | 0.780 | 0.954 | 0.621 | 0.605 | |||
| CLM4.5_GSWP3v1 | [-] | 71.2 | 71.2 | 65.3 | 79.6 | 7.00 | 14.4 | 1.49 | 0.385 | 0.314 | 0.768 | 0.940 | 0.718 | 0.573 | |||
| CLM4_CRUNCEPv7 | [-] | 68.4 | 68.4 | 65.3 | 79.6 | 4.55 | 11.7 | 1.41 | 0.449 | 0.420 | 0.777 | 0.952 | 0.623 | 0.607 | |||
| CLM4_GSWP3v1 | [-] | 71.2 | 71.2 | 65.3 | 79.6 | 6.95 | 14.5 | 1.49 | 0.393 | 0.308 | 0.766 | 0.936 | 0.703 | 0.569 | |||
| CLM5_CRUNCEPv7 | [-] | 65.4 | 65.4 | 65.3 | 79.6 | 1.82 | 12.0 | 1.45 | 0.461 | 0.411 | 0.770 | 0.944 | 0.601 | 0.600 | |||
| CLM5_GSWP3v1 | [-] | 69.5 | 69.5 | 65.3 | 79.6 | 5.43 | 14.1 | 1.53 | 0.410 | 0.299 | 0.759 | 0.945 | 0.644 | 0.559 |
Download Data |
Period Mean (original grids) [%] |
Model Period Mean (intersection) [%] |
Model Period Mean (complement) [%] |
Benchmark Period Mean (intersection) [%] |
Benchmark Period Mean (complement) [%] |
Bias [%] |
RMSE [%] |
Phase Shift [months] |
Bias Score [1] |
RMSE Score [1] |
Seasonal Cycle Score [1] |
Spatial Distribution Score [1] |
Interannual Variability Score [1] |
Overall Score [1] |
|||
|---|---|---|---|---|---|---|---|---|---|---|---|---|---|---|---|---|---|
| Benchmark | [-] | 37.9 | |||||||||||||||
| CLM4.5_CRUNCEPv7 | [-] | 43.9 | 43.9 | 36.6 | 70.8 | 8.66 | 13.1 | 0.852 | 0.435 | 0.506 | 0.857 | 0.952 | 0.634 | 0.649 | |||
| CLM4.5_GSWP3v1 | [-] | 42.2 | 42.2 | 36.6 | 70.8 | 7.14 | 12.7 | 0.606 | 0.497 | 0.433 | 0.888 | 0.922 | 0.772 | 0.657 | |||
| CLM4_CRUNCEPv7 | [-] | 42.4 | 42.4 | 36.6 | 70.8 | 7.18 | 12.1 | 0.829 | 0.456 | 0.511 | 0.860 | 0.956 | 0.641 | 0.656 | |||
| CLM4_GSWP3v1 | [-] | 41.5 | 41.5 | 36.6 | 70.8 | 6.41 | 12.7 | 0.588 | 0.502 | 0.423 | 0.890 | 0.925 | 0.765 | 0.655 | |||
| CLM5_CRUNCEPv7 | [-] | 42.8 | 42.8 | 36.6 | 70.8 | 7.67 | 12.8 | 0.887 | 0.429 | 0.499 | 0.851 | 0.959 | 0.629 | 0.644 | |||
| CLM5_GSWP3v1 | [-] | 41.2 | 41.3 | 36.6 | 70.8 | 6.28 | 12.3 | 0.578 | 0.494 | 0.429 | 0.897 | 0.920 | 0.745 | 0.652 |
Download Data |
Period Mean (original grids) [%] |
Model Period Mean (intersection) [%] |
Model Period Mean (complement) [%] |
Benchmark Period Mean (intersection) [%] |
Benchmark Period Mean (complement) [%] |
Bias [%] |
RMSE [%] |
Phase Shift [months] |
Bias Score [1] |
RMSE Score [1] |
Seasonal Cycle Score [1] |
Spatial Distribution Score [1] |
Interannual Variability Score [1] |
Overall Score [1] |
|||
|---|---|---|---|---|---|---|---|---|---|---|---|---|---|---|---|---|---|
| Benchmark | [-] | 77.9 | |||||||||||||||
| CLM4.5_CRUNCEPv7 | [-] | 87.0 | 86.9 | 77.6 | 82.9 | 10.2 | 14.7 | 2.70 | 0.208 | 0.208 | 0.567 | 0.671 | 0.583 | 0.408 | |||
| CLM4.5_GSWP3v1 | [-] | 89.7 | 89.7 | 77.6 | 82.9 | 12.5 | 17.6 | 2.51 | 0.121 | 0.125 | 0.614 | 0.995 | 0.742 | 0.454 | |||
| CLM4_CRUNCEPv7 | [-] | 86.6 | 86.5 | 77.6 | 82.9 | 9.78 | 14.7 | 2.89 | 0.220 | 0.199 | 0.533 | 0.655 | 0.559 | 0.394 | |||
| CLM4_GSWP3v1 | [-] | 89.3 | 89.3 | 77.6 | 82.9 | 12.1 | 17.7 | 2.52 | 0.132 | 0.117 | 0.611 | 1.00 | 0.726 | 0.451 | |||
| CLM5_CRUNCEPv7 | [-] | 83.1 | 83.0 | 77.6 | 82.9 | 6.56 | 14.2 | 2.76 | 0.286 | 0.186 | 0.555 | 0.475 | 0.432 | 0.353 | |||
| CLM5_GSWP3v1 | [-] | 88.6 | 88.6 | 77.6 | 82.9 | 11.4 | 17.0 | 2.57 | 0.149 | 0.120 | 0.604 | 0.999 | 0.614 | 0.434 |
Download Data |
Period Mean (original grids) [%] |
Model Period Mean (intersection) [%] |
Model Period Mean (complement) [%] |
Benchmark Period Mean (intersection) [%] |
Benchmark Period Mean (complement) [%] |
Bias [%] |
RMSE [%] |
Phase Shift [months] |
Bias Score [1] |
RMSE Score [1] |
Seasonal Cycle Score [1] |
Spatial Distribution Score [1] |
Interannual Variability Score [1] |
Overall Score [1] |
|||
|---|---|---|---|---|---|---|---|---|---|---|---|---|---|---|---|---|---|
| Benchmark | [-] | 69.8 | |||||||||||||||
| CLM4.5_CRUNCEPv7 | [-] | 64.5 | 64.5 | 68.1 | 78.3 | -0.345 | 8.30 | 1.36 | 0.493 | 0.439 | 0.787 | 0.996 | 0.698 | 0.642 | |||
| CLM4.5_GSWP3v1 | [-] | 67.9 | 68.0 | 68.1 | 78.3 | 2.14 | 9.49 | 1.63 | 0.474 | 0.347 | 0.749 | 0.993 | 0.683 | 0.599 | |||
| CLM4_CRUNCEPv7 | [-] | 63.9 | 63.9 | 68.1 | 78.3 | -1.02 | 8.15 | 1.45 | 0.488 | 0.446 | 0.773 | 0.997 | 0.690 | 0.640 | |||
| CLM4_GSWP3v1 | [-] | 67.7 | 67.8 | 68.1 | 78.3 | 1.85 | 9.46 | 1.65 | 0.490 | 0.340 | 0.745 | 0.991 | 0.660 | 0.594 | |||
| CLM5_CRUNCEPv7 | [-] | 62.3 | 62.3 | 68.1 | 78.3 | -2.44 | 8.69 | 1.37 | 0.479 | 0.443 | 0.790 | 0.996 | 0.678 | 0.638 | |||
| CLM5_GSWP3v1 | [-] | 66.7 | 66.8 | 68.1 | 78.3 | 0.789 | 9.54 | 1.62 | 0.485 | 0.334 | 0.749 | 0.988 | 0.640 | 0.588 |
Download Data |
Period Mean (original grids) [%] |
Model Period Mean (intersection) [%] |
Model Period Mean (complement) [%] |
Benchmark Period Mean (intersection) [%] |
Benchmark Period Mean (complement) [%] |
Bias [%] |
RMSE [%] |
Phase Shift [months] |
Bias Score [1] |
RMSE Score [1] |
Seasonal Cycle Score [1] |
Spatial Distribution Score [1] |
Interannual Variability Score [1] |
Overall Score [1] |
|||
|---|---|---|---|---|---|---|---|---|---|---|---|---|---|---|---|---|---|
| Benchmark | [-] | 69.7 | |||||||||||||||
| CLM4.5_CRUNCEPv7 | [-] | 76.8 | 77.0 | 69.4 | 76.3 | 7.89 | 9.22 | 1.50 | 0.299 | 0.485 | 0.760 | 0.999 | 0.794 | 0.637 | |||
| CLM4.5_GSWP3v1 | [-] | 79.0 | 79.1 | 69.4 | 76.3 | 9.73 | 13.0 | 2.42 | 0.252 | 0.276 | 0.624 | 0.995 | 0.776 | 0.533 | |||
| CLM4_CRUNCEPv7 | [-] | 76.7 | 76.9 | 69.4 | 76.3 | 7.77 | 9.09 | 1.36 | 0.307 | 0.484 | 0.779 | 0.999 | 0.794 | 0.641 | |||
| CLM4_GSWP3v1 | [-] | 79.0 | 79.1 | 69.4 | 76.3 | 9.68 | 12.9 | 2.26 | 0.255 | 0.275 | 0.649 | 0.988 | 0.756 | 0.533 | |||
| CLM5_CRUNCEPv7 | [-] | 71.8 | 71.9 | 69.4 | 76.3 | 2.90 | 5.87 | 1.85 | 0.616 | 0.470 | 0.719 | 0.995 | 0.786 | 0.676 | |||
| CLM5_GSWP3v1 | [-] | 76.3 | 76.3 | 69.4 | 76.3 | 6.86 | 11.7 | 2.73 | 0.356 | 0.249 | 0.570 | 0.999 | 0.685 | 0.518 |
Download Data |
Period Mean (original grids) [%] |
Model Period Mean (intersection) [%] |
Model Period Mean (complement) [%] |
Benchmark Period Mean (intersection) [%] |
Benchmark Period Mean (complement) [%] |
Bias [%] |
RMSE [%] |
Phase Shift [months] |
Bias Score [1] |
RMSE Score [1] |
Seasonal Cycle Score [1] |
Spatial Distribution Score [1] |
Interannual Variability Score [1] |
Overall Score [1] |
|||
|---|---|---|---|---|---|---|---|---|---|---|---|---|---|---|---|---|---|
| Benchmark | [-] | 72.4 | |||||||||||||||
| CLM4.5_CRUNCEPv7 | [-] | 82.6 | 82.6 | 72.0 | 81.9 | 10.8 | 12.8 | 1.52 | 0.270 | 0.420 | 0.809 | 0.996 | 0.802 | 0.619 | |||
| CLM4.5_GSWP3v1 | [-] | 84.1 | 84.1 | 72.0 | 81.9 | 12.1 | 15.9 | 1.32 | 0.224 | 0.271 | 0.841 | 0.967 | 0.809 | 0.564 | |||
| CLM4_CRUNCEPv7 | [-] | 82.3 | 82.3 | 72.0 | 81.9 | 10.5 | 12.6 | 1.55 | 0.283 | 0.414 | 0.803 | 0.999 | 0.816 | 0.622 | |||
| CLM4_GSWP3v1 | [-] | 83.5 | 83.5 | 72.0 | 81.9 | 11.5 | 15.7 | 1.30 | 0.242 | 0.260 | 0.842 | 0.973 | 0.795 | 0.562 | |||
| CLM5_CRUNCEPv7 | [-] | 78.4 | 78.5 | 72.0 | 81.9 | 6.78 | 10.0 | 1.58 | 0.446 | 0.406 | 0.795 | 0.986 | 0.852 | 0.649 | |||
| CLM5_GSWP3v1 | [-] | 81.9 | 81.9 | 72.0 | 81.9 | 9.94 | 15.0 | 1.50 | 0.294 | 0.243 | 0.809 | 0.971 | 0.693 | 0.542 |
Download Data |
Period Mean (original grids) [%] |
Model Period Mean (intersection) [%] |
Model Period Mean (complement) [%] |
Benchmark Period Mean (intersection) [%] |
Benchmark Period Mean (complement) [%] |
Bias [%] |
RMSE [%] |
Phase Shift [months] |
Bias Score [1] |
RMSE Score [1] |
Seasonal Cycle Score [1] |
Spatial Distribution Score [1] |
Interannual Variability Score [1] |
Overall Score [1] |
|||
|---|---|---|---|---|---|---|---|---|---|---|---|---|---|---|---|---|---|
| Benchmark | [-] | 53.7 | |||||||||||||||
| CLM4.5_CRUNCEPv7 | [-] | 58.0 | 58.1 | 53.2 | 81.4 | 5.41 | 9.12 | 0.719 | 0.639 | 0.570 | 0.915 | 0.989 | 0.778 | 0.743 | |||
| CLM4.5_GSWP3v1 | [-] | 65.5 | 65.5 | 53.2 | 81.4 | 12.6 | 16.6 | 0.982 | 0.369 | 0.431 | 0.885 | 0.995 | 0.830 | 0.657 | |||
| CLM4_CRUNCEPv7 | [-] | 57.3 | 57.5 | 53.2 | 81.4 | 4.81 | 8.82 | 0.643 | 0.666 | 0.567 | 0.925 | 0.993 | 0.777 | 0.749 | |||
| CLM4_GSWP3v1 | [-] | 64.9 | 65.0 | 53.2 | 81.4 | 12.1 | 16.2 | 0.906 | 0.383 | 0.431 | 0.895 | 0.996 | 0.819 | 0.659 | |||
| CLM5_CRUNCEPv7 | [-] | 53.9 | 54.1 | 53.2 | 81.4 | 1.43 | 8.63 | 0.748 | 0.717 | 0.546 | 0.913 | 0.980 | 0.758 | 0.743 | |||
| CLM5_GSWP3v1 | [-] | 64.0 | 64.0 | 53.2 | 81.4 | 11.1 | 15.6 | 1.07 | 0.413 | 0.427 | 0.871 | 0.987 | 0.793 | 0.653 |
Download Data |
Period Mean (original grids) [%] |
Model Period Mean (intersection) [%] |
Model Period Mean (complement) [%] |
Benchmark Period Mean (intersection) [%] |
Benchmark Period Mean (complement) [%] |
Bias [%] |
RMSE [%] |
Phase Shift [months] |
Bias Score [1] |
RMSE Score [1] |
Seasonal Cycle Score [1] |
Spatial Distribution Score [1] |
Interannual Variability Score [1] |
Overall Score [1] |
|||
|---|---|---|---|---|---|---|---|---|---|---|---|---|---|---|---|---|---|
| Benchmark | [-] | 84.9 | |||||||||||||||
| CLM4.5_CRUNCEPv7 | [-] | 84.8 | 84.8 | 85.0 | 81.5 | -0.145 | 5.85 | 0.723 | 0.624 | 0.461 | 0.917 | 0.998 | 0.601 | 0.677 | |||
| CLM4.5_GSWP3v1 | [-] | 82.2 | 82.2 | 85.0 | 81.5 | -2.68 | 9.41 | 1.25 | 0.480 | 0.285 | 0.842 | 0.940 | 0.602 | 0.572 | |||
| CLM4_CRUNCEPv7 | [-] | 85.6 | 85.6 | 85.0 | 81.5 | 0.570 | 5.69 | 0.757 | 0.637 | 0.466 | 0.912 | 0.999 | 0.606 | 0.681 | |||
| CLM4_GSWP3v1 | [-] | 82.9 | 82.9 | 85.0 | 81.5 | -2.01 | 9.63 | 1.27 | 0.508 | 0.273 | 0.838 | 0.921 | 0.574 | 0.564 | |||
| CLM5_CRUNCEPv7 | [-] | 82.0 | 82.0 | 85.0 | 81.5 | -2.95 | 6.72 | 0.800 | 0.519 | 0.453 | 0.903 | 0.999 | 0.610 | 0.656 | |||
| CLM5_GSWP3v1 | [-] | 80.2 | 80.2 | 85.0 | 81.5 | -4.70 | 10.9 | 1.30 | 0.431 | 0.252 | 0.831 | 0.894 | 0.520 | 0.530 |
Download Data |
Period Mean (original grids) [%] |
Model Period Mean (intersection) [%] |
Model Period Mean (complement) [%] |
Benchmark Period Mean (intersection) [%] |
Benchmark Period Mean (complement) [%] |
Bias [%] |
RMSE [%] |
Phase Shift [months] |
Bias Score [1] |
RMSE Score [1] |
Seasonal Cycle Score [1] |
Spatial Distribution Score [1] |
Interannual Variability Score [1] |
Overall Score [1] |
|||
|---|---|---|---|---|---|---|---|---|---|---|---|---|---|---|---|---|---|
| Benchmark | [-] | 70.7 | |||||||||||||||
| CLM4.5_CRUNCEPv7 | [-] | 72.6 | 72.3 | 70.4 | 79.2 | 2.44 | 7.68 | 0.877 | 0.583 | 0.520 | 0.888 | 0.911 | 0.602 | 0.671 | |||
| CLM4.5_GSWP3v1 | [-] | 73.5 | 73.3 | 70.4 | 79.2 | 3.38 | 13.0 | 1.40 | 0.455 | 0.337 | 0.809 | 0.728 | 0.753 | 0.570 | |||
| CLM4_CRUNCEPv7 | [-] | 73.3 | 73.0 | 70.4 | 79.2 | 3.08 | 7.98 | 0.875 | 0.545 | 0.530 | 0.890 | 0.902 | 0.599 | 0.666 | |||
| CLM4_GSWP3v1 | [-] | 73.8 | 73.6 | 70.4 | 79.2 | 3.65 | 13.4 | 1.40 | 0.452 | 0.327 | 0.810 | 0.713 | 0.733 | 0.560 | |||
| CLM5_CRUNCEPv7 | [-] | 69.9 | 69.6 | 70.4 | 79.2 | -0.202 | 6.87 | 0.787 | 0.704 | 0.515 | 0.901 | 0.952 | 0.584 | 0.695 | |||
| CLM5_GSWP3v1 | [-] | 71.7 | 71.5 | 70.4 | 79.2 | 1.59 | 13.1 | 1.36 | 0.462 | 0.318 | 0.819 | 0.724 | 0.716 | 0.560 |
Download Data |
Period Mean (original grids) [%] |
Model Period Mean (intersection) [%] |
Model Period Mean (complement) [%] |
Benchmark Period Mean (intersection) [%] |
Benchmark Period Mean (complement) [%] |
Bias [%] |
RMSE [%] |
Phase Shift [months] |
Bias Score [1] |
RMSE Score [1] |
Seasonal Cycle Score [1] |
Spatial Distribution Score [1] |
Interannual Variability Score [1] |
Overall Score [1] |
|||
|---|---|---|---|---|---|---|---|---|---|---|---|---|---|---|---|---|---|
| Benchmark | [-] | 65.5 | |||||||||||||||
| CLM4.5_CRUNCEPv7 | [-] | 54.9 | 55.1 | 63.7 | 81.7 | -5.95 | 13.5 | 1.04 | 0.380 | 0.419 | 0.857 | 0.978 | 0.691 | 0.624 | |||
| CLM4.5_GSWP3v1 | [-] | 63.7 | 63.9 | 63.7 | 81.7 | 1.70 | 12.5 | 0.935 | 0.459 | 0.370 | 0.867 | 0.981 | 0.655 | 0.617 | |||
| CLM4_CRUNCEPv7 | [-] | 55.9 | 56.1 | 63.7 | 81.7 | -5.06 | 13.1 | 1.05 | 0.392 | 0.423 | 0.858 | 0.972 | 0.690 | 0.626 | |||
| CLM4_GSWP3v1 | [-] | 63.7 | 63.9 | 63.7 | 81.7 | 1.62 | 12.5 | 0.925 | 0.458 | 0.370 | 0.867 | 0.985 | 0.653 | 0.617 | |||
| CLM5_CRUNCEPv7 | [-] | 52.7 | 52.8 | 63.7 | 81.7 | -7.98 | 14.9 | 1.02 | 0.345 | 0.421 | 0.860 | 0.978 | 0.686 | 0.618 | |||
| CLM5_GSWP3v1 | [-] | 62.9 | 63.1 | 63.7 | 81.7 | 0.944 | 12.3 | 0.915 | 0.480 | 0.372 | 0.868 | 0.972 | 0.633 | 0.616 |
Temporally integrated period mean