Mean State
Download Data |
Period Mean (original grids) [Pg yr-1] |
Model Period Mean (intersection) [Pg yr-1] |
Model Period Mean (complement) [Pg yr-1] |
Benchmark Period Mean (intersection) [Pg yr-1] |
Benchmark Period Mean (complement) [Pg yr-1] |
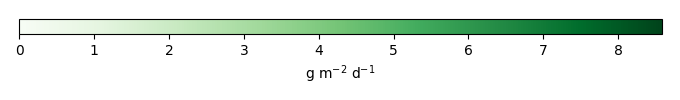
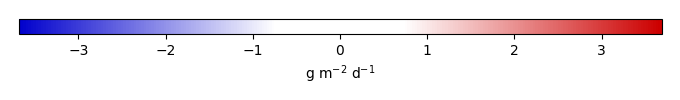
Bias [g m-2 d-1] |
RMSE [g m-2 d-1] |
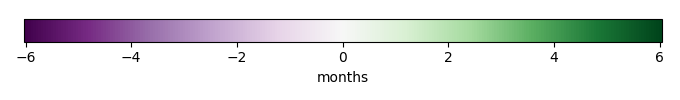
Phase Shift [months] |
Bias Score [1] |
RMSE Score [1] |
Seasonal Cycle Score [1] |
Spatial Distribution Score [1] |
Overall Score [1] |
|||
|---|---|---|---|---|---|---|---|---|---|---|---|---|---|---|---|---|
| Benchmark | [-] | 8.19 | ||||||||||||||
| CLM5PHSOFF | [-] | 7.73 | 7.40 | 0.523 | 8.18 | 0.00755 | -0.501 | 1.50 | 2.04 | 0.362 | 0.248 | 0.611 | 0.987 | 0.491 | ||
| CLM5PHSON | [-] | 6.96 | 6.98 | 0.219 | 8.18 | 0.00755 | -0.618 | 1.70 | 2.16 | 0.291 | 0.276 | 0.590 | 0.966 | 0.480 |
Download Data |
Period Mean (original grids) [Pg yr-1] |
Model Period Mean (intersection) [Pg yr-1] |
Model Period Mean (complement) [Pg yr-1] |
Benchmark Period Mean (intersection) [Pg yr-1] |
Benchmark Period Mean (complement) [Pg yr-1] |
Bias [g m-2 d-1] |
RMSE [g m-2 d-1] |
Phase Shift [months] |
Bias Score [1] |
RMSE Score [1] |
Seasonal Cycle Score [1] |
Spatial Distribution Score [1] |
Overall Score [1] |
|||
|---|---|---|---|---|---|---|---|---|---|---|---|---|---|---|---|---|
| Benchmark | [-] | 5.55 | ||||||||||||||
| CLM5PHSOFF | [-] | 4.85 | 4.59 | 0.0341 | 5.55 | 0.00508 | -0.394 | 1.45 | 1.04 | 0.614 | 0.476 | 0.851 | 0.812 | 0.646 | ||
| CLM5PHSON | [-] | 5.36 | 5.09 | 0.0260 | 5.55 | 0.00508 | -0.166 | 1.76 | 1.52 | 0.575 | 0.417 | 0.742 | 0.834 | 0.597 |
Download Data |
Period Mean (original grids) [Pg yr-1] |
Model Period Mean (intersection) [Pg yr-1] |
Model Period Mean (complement) [Pg yr-1] |
Benchmark Period Mean (intersection) [Pg yr-1] |
Benchmark Period Mean (complement) [Pg yr-1] |
Bias [g m-2 d-1] |
RMSE [g m-2 d-1] |
Phase Shift [months] |
Bias Score [1] |
RMSE Score [1] |
Seasonal Cycle Score [1] |
Spatial Distribution Score [1] |
Overall Score [1] |
|||
|---|---|---|---|---|---|---|---|---|---|---|---|---|---|---|---|---|
| Benchmark | [-] | 9.94 | ||||||||||||||
| CLM5PHSOFF | [-] | 7.62 | 6.63 | 0.844 | 9.92 | 0.0215 | -0.999 | 1.79 | 1.02 | 0.404 | 0.450 | 0.906 | 0.899 | 0.622 | ||
| CLM5PHSON | [-] | 7.00 | 6.60 | 0.346 | 9.92 | 0.0215 | -0.858 | 2.08 | 1.35 | 0.391 | 0.375 | 0.822 | 0.914 | 0.575 |
Download Data |
Period Mean (original grids) [Pg yr-1] |
Model Period Mean (intersection) [Pg yr-1] |
Model Period Mean (complement) [Pg yr-1] |
Benchmark Period Mean (intersection) [Pg yr-1] |
Benchmark Period Mean (complement) [Pg yr-1] |
Bias [g m-2 d-1] |
RMSE [g m-2 d-1] |
Phase Shift [months] |
Bias Score [1] |
RMSE Score [1] |
Seasonal Cycle Score [1] |
Spatial Distribution Score [1] |
Overall Score [1] |
|||
|---|---|---|---|---|---|---|---|---|---|---|---|---|---|---|---|---|
| Benchmark | [-] | 1.03 | ||||||||||||||
| CLM5PHSOFF | [-] | 1.45 | 1.36 | 0.0976 | 1.03 | 0.00296 | 0.289 | 1.71 | 0.813 | 0.576 | 0.410 | 0.894 | 0.561 | 0.570 | ||
| CLM5PHSON | [-] | 1.61 | 1.56 | 0.0509 | 1.03 | 0.00296 | 0.549 | 1.85 | 0.240 | 0.592 | 0.393 | 0.981 | 0.623 | 0.596 |
Download Data |
Period Mean (original grids) [Pg yr-1] |
Model Period Mean (intersection) [Pg yr-1] |
Model Period Mean (complement) [Pg yr-1] |
Benchmark Period Mean (intersection) [Pg yr-1] |
Benchmark Period Mean (complement) [Pg yr-1] |
Bias [g m-2 d-1] |
RMSE [g m-2 d-1] |
Phase Shift [months] |
Bias Score [1] |
RMSE Score [1] |
Seasonal Cycle Score [1] |
Spatial Distribution Score [1] |
Overall Score [1] |
|||
|---|---|---|---|---|---|---|---|---|---|---|---|---|---|---|---|---|
| Benchmark | [-] | 7.13 | ||||||||||||||
| CLM5PHSOFF | [-] | 11.4 | 7.70 | 3.37 | 6.94 | 0.197 | 0.741 | 2.07 | 1.84 | 0.206 | 0.219 | 0.744 | 0.525 | 0.383 | ||
| CLM5PHSON | [-] | 6.19 | 5.16 | 0.976 | 6.94 | 0.197 | -0.0181 | 2.32 | 1.99 | 0.0902 | 0.187 | 0.712 | 0.283 | 0.292 |
Download Data |
Period Mean (original grids) [Pg yr-1] |
Model Period Mean (intersection) [Pg yr-1] |
Model Period Mean (complement) [Pg yr-1] |
Benchmark Period Mean (intersection) [Pg yr-1] |
Benchmark Period Mean (complement) [Pg yr-1] |
Bias [g m-2 d-1] |
RMSE [g m-2 d-1] |
Phase Shift [months] |
Bias Score [1] |
RMSE Score [1] |
Seasonal Cycle Score [1] |
Spatial Distribution Score [1] |
Overall Score [1] |
|||
|---|---|---|---|---|---|---|---|---|---|---|---|---|---|---|---|---|
| Benchmark | [-] | 6.86 | ||||||||||||||
| CLM5PHSOFF | [-] | 5.30 | 5.03 | 0.124 | 6.85 | 0.00296 | -0.561 | 1.71 | 0.337 | 0.713 | 0.596 | 0.975 | 0.764 | 0.729 | ||
| CLM5PHSON | [-] | 7.45 | 7.19 | 0.0801 | 6.85 | 0.00296 | 0.132 | 1.38 | 0.512 | 0.792 | 0.649 | 0.964 | 0.822 | 0.775 |
Download Data |
Period Mean (original grids) [Pg yr-1] |
Model Period Mean (intersection) [Pg yr-1] |
Model Period Mean (complement) [Pg yr-1] |
Benchmark Period Mean (intersection) [Pg yr-1] |
Benchmark Period Mean (complement) [Pg yr-1] |
Bias [g m-2 d-1] |
RMSE [g m-2 d-1] |
Phase Shift [months] |
Bias Score [1] |
RMSE Score [1] |
Seasonal Cycle Score [1] |
Spatial Distribution Score [1] |
Overall Score [1] |
|||
|---|---|---|---|---|---|---|---|---|---|---|---|---|---|---|---|---|
| Benchmark | [-] | 10.1 | ||||||||||||||
| CLM5PHSOFF | [-] | 9.06 | 8.23 | 0.896 | 10.0 | 0.0375 | -0.283 | 1.31 | 0.998 | 0.585 | 0.532 | 0.932 | 0.885 | 0.693 | ||
| CLM5PHSON | [-] | 10.5 | 10.3 | 0.320 | 10.0 | 0.0375 | 0.128 | 1.24 | 1.04 | 0.706 | 0.547 | 0.926 | 0.950 | 0.735 |
Download Data |
Period Mean (original grids) [Pg yr-1] |
Model Period Mean (intersection) [Pg yr-1] |
Model Period Mean (complement) [Pg yr-1] |
Benchmark Period Mean (intersection) [Pg yr-1] |
Benchmark Period Mean (complement) [Pg yr-1] |
Bias [g m-2 d-1] |
RMSE [g m-2 d-1] |
Phase Shift [months] |
Bias Score [1] |
RMSE Score [1] |
Seasonal Cycle Score [1] |
Spatial Distribution Score [1] |
Overall Score [1] |
|||
|---|---|---|---|---|---|---|---|---|---|---|---|---|---|---|---|---|
| Benchmark | [-] | 8.37 | ||||||||||||||
| CLM5PHSOFF | [-] | 7.87 | 6.22 | 1.33 | 8.32 | 0.0454 | -0.860 | 2.02 | 1.81 | 0.381 | 0.399 | 0.751 | 0.935 | 0.573 | ||
| CLM5PHSON | [-] | 7.16 | 6.53 | 0.481 | 8.32 | 0.0454 | -0.302 | 2.05 | 2.75 | 0.468 | 0.353 | 0.581 | 0.951 | 0.541 |
Download Data |
Period Mean (original grids) [Pg yr-1] |
Model Period Mean (intersection) [Pg yr-1] |
Model Period Mean (complement) [Pg yr-1] |
Benchmark Period Mean (intersection) [Pg yr-1] |
Benchmark Period Mean (complement) [Pg yr-1] |
Bias [g m-2 d-1] |
RMSE [g m-2 d-1] |
Phase Shift [months] |
Bias Score [1] |
RMSE Score [1] |
Seasonal Cycle Score [1] |
Spatial Distribution Score [1] |
Overall Score [1] |
|||
|---|---|---|---|---|---|---|---|---|---|---|---|---|---|---|---|---|
| Benchmark | [-] | 1.28 | ||||||||||||||
| CLM5PHSOFF | [-] | 1.84 | 1.83 | 0.0677 | 1.28 | 0.00137 | 0.433 | 1.68 | 0.489 | 0.694 | 0.447 | 0.967 | 0.824 | 0.676 | ||
| CLM5PHSON | [-] | 1.99 | 2.02 | 0.0328 | 1.28 | 0.00137 | 0.631 | 1.93 | 0.168 | 0.663 | 0.399 | 0.993 | 0.840 | 0.659 |
Download Data |
Period Mean (original grids) [Pg yr-1] |
Model Period Mean (intersection) [Pg yr-1] |
Model Period Mean (complement) [Pg yr-1] |
Benchmark Period Mean (intersection) [Pg yr-1] |
Benchmark Period Mean (complement) [Pg yr-1] |
Bias [g m-2 d-1] |
RMSE [g m-2 d-1] |
Phase Shift [months] |
Bias Score [1] |
RMSE Score [1] |
Seasonal Cycle Score [1] |
Spatial Distribution Score [1] |
Overall Score [1] |
|||
|---|---|---|---|---|---|---|---|---|---|---|---|---|---|---|---|---|
| Benchmark | [-] | 3.53 | ||||||||||||||
| CLM5PHSOFF | [-] | 5.13 | 3.77 | 1.28 | 3.49 | 0.0402 | 0.0980 | 1.12 | 1.84 | 0.553 | 0.271 | 0.845 | 0.885 | 0.565 | ||
| CLM5PHSON | [-] | 4.92 | 4.36 | 0.531 | 3.49 | 0.0402 | 0.562 | 1.29 | 2.04 | 0.452 | 0.258 | 0.809 | 0.817 | 0.519 |
Download Data |
Period Mean (original grids) [Pg yr-1] |
Model Period Mean (intersection) [Pg yr-1] |
Model Period Mean (complement) [Pg yr-1] |
Benchmark Period Mean (intersection) [Pg yr-1] |
Benchmark Period Mean (complement) [Pg yr-1] |
Bias [g m-2 d-1] |
RMSE [g m-2 d-1] |
Phase Shift [months] |
Bias Score [1] |
RMSE Score [1] |
Seasonal Cycle Score [1] |
Spatial Distribution Score [1] |
Overall Score [1] |
|||
|---|---|---|---|---|---|---|---|---|---|---|---|---|---|---|---|---|
| Benchmark | [-] | 5.29 | ||||||||||||||
| CLM5PHSOFF | [-] | 5.11 | 4.34 | 0.668 | 5.26 | 0.0312 | -0.474 | 1.96 | 0.331 | 0.597 | 0.573 | 0.981 | 0.892 | 0.723 | ||
| CLM5PHSON | [-] | 5.13 | 4.83 | 0.225 | 5.26 | 0.0312 | 0.164 | 1.80 | 0.315 | 0.712 | 0.576 | 0.981 | 0.799 | 0.729 |
Download Data |
Period Mean (original grids) [Pg yr-1] |
Model Period Mean (intersection) [Pg yr-1] |
Model Period Mean (complement) [Pg yr-1] |
Benchmark Period Mean (intersection) [Pg yr-1] |
Benchmark Period Mean (complement) [Pg yr-1] |
Bias [g m-2 d-1] |
RMSE [g m-2 d-1] |
Phase Shift [months] |
Bias Score [1] |
RMSE Score [1] |
Seasonal Cycle Score [1] |
Spatial Distribution Score [1] |
Overall Score [1] |
|||
|---|---|---|---|---|---|---|---|---|---|---|---|---|---|---|---|---|
| Benchmark | [-] | 119. | ||||||||||||||
| CLM5PHSOFF | [-] | 119. | 102. | 16.3 | 118. | 0.802 | -0.343 | 1.55 | 1.25 | 0.428 | 0.391 | 0.812 | 0.938 | 0.592 | ||
| CLM5PHSON | [-] | 115. | 110. | 5.38 | 118. | 0.802 | 0.0236 | 1.62 | 1.33 | 0.434 | 0.384 | 0.786 | 0.933 | 0.584 |
Download Data |
Period Mean (original grids) [Pg yr-1] |
Model Period Mean (intersection) [Pg yr-1] |
Model Period Mean (complement) [Pg yr-1] |
Benchmark Period Mean (intersection) [Pg yr-1] |
Benchmark Period Mean (complement) [Pg yr-1] |
Bias [g m-2 d-1] |
RMSE [g m-2 d-1] |
Phase Shift [months] |
Bias Score [1] |
RMSE Score [1] |
Seasonal Cycle Score [1] |
Spatial Distribution Score [1] |
Overall Score [1] |
|||
|---|---|---|---|---|---|---|---|---|---|---|---|---|---|---|---|---|
| Benchmark | [-] | 0.864 | ||||||||||||||
| CLM5PHSOFF | [-] | 0.895 | 0.729 | 0.158 | 0.859 | 0.00579 | -0.0442 | 0.401 | 2.22 | 0.438 | 0.354 | 0.872 | 0.778 | 0.559 | ||
| CLM5PHSON | [-] | 1.54 | 1.49 | 0.0758 | 0.859 | 0.00579 | 0.268 | 0.681 | 2.31 | 0.453 | 0.244 | 0.866 | 0.853 | 0.532 |
Download Data |
Period Mean (original grids) [Pg yr-1] |
Model Period Mean (intersection) [Pg yr-1] |
Model Period Mean (complement) [Pg yr-1] |
Benchmark Period Mean (intersection) [Pg yr-1] |
Benchmark Period Mean (complement) [Pg yr-1] |
Bias [g m-2 d-1] |
RMSE [g m-2 d-1] |
Phase Shift [months] |
Bias Score [1] |
RMSE Score [1] |
Seasonal Cycle Score [1] |
Spatial Distribution Score [1] |
Overall Score [1] |
|||
|---|---|---|---|---|---|---|---|---|---|---|---|---|---|---|---|---|
| Benchmark | [-] | 1.56 | ||||||||||||||
| CLM5PHSOFF | [-] | 2.77 | 2.52 | 0.213 | 1.55 | 0.00323 | 0.407 | 1.23 | 1.69 | 0.550 | 0.387 | 0.905 | 0.625 | 0.571 | ||
| CLM5PHSON | [-] | 2.94 | 2.84 | 0.0836 | 1.55 | 0.00323 | 0.616 | 1.53 | 0.589 | 0.484 | 0.313 | 0.973 | 0.553 | 0.527 |
Download Data |
Period Mean (original grids) [Pg yr-1] |
Model Period Mean (intersection) [Pg yr-1] |
Model Period Mean (complement) [Pg yr-1] |
Benchmark Period Mean (intersection) [Pg yr-1] |
Benchmark Period Mean (complement) [Pg yr-1] |
Bias [g m-2 d-1] |
RMSE [g m-2 d-1] |
Phase Shift [months] |
Bias Score [1] |
RMSE Score [1] |
Seasonal Cycle Score [1] |
Spatial Distribution Score [1] |
Overall Score [1] |
|||
|---|---|---|---|---|---|---|---|---|---|---|---|---|---|---|---|---|
| Benchmark | [-] | 3.62 | ||||||||||||||
| CLM5PHSOFF | [-] | 4.33 | 3.14 | 1.05 | 3.60 | 0.0267 | -0.461 | 1.83 | 1.42 | 0.350 | 0.344 | 0.822 | 0.943 | 0.561 | ||
| CLM5PHSON | [-] | 3.29 | 2.78 | 0.428 | 3.60 | 0.0267 | 0.0289 | 1.89 | 1.52 | 0.370 | 0.344 | 0.772 | 0.944 | 0.555 |
Download Data |
Period Mean (original grids) [Pg yr-1] |
Model Period Mean (intersection) [Pg yr-1] |
Model Period Mean (complement) [Pg yr-1] |
Benchmark Period Mean (intersection) [Pg yr-1] |
Benchmark Period Mean (complement) [Pg yr-1] |
Bias [g m-2 d-1] |
RMSE [g m-2 d-1] |
Phase Shift [months] |
Bias Score [1] |
RMSE Score [1] |
Seasonal Cycle Score [1] |
Spatial Distribution Score [1] |
Overall Score [1] |
|||
|---|---|---|---|---|---|---|---|---|---|---|---|---|---|---|---|---|
| Benchmark | [-] | 5.09 | ||||||||||||||
| CLM5PHSOFF | [-] | 3.82 | 3.33 | 0.361 | 5.09 | 0.00487 | -1.20 | 2.33 | 0.542 | 0.583 | 0.569 | 0.959 | 0.934 | 0.723 | ||
| CLM5PHSON | [-] | 4.79 | 4.55 | 0.143 | 5.09 | 0.00487 | -0.209 | 1.80 | 0.672 | 0.733 | 0.617 | 0.942 | 0.930 | 0.768 |
Download Data |
Period Mean (original grids) [Pg yr-1] |
Model Period Mean (intersection) [Pg yr-1] |
Model Period Mean (complement) [Pg yr-1] |
Benchmark Period Mean (intersection) [Pg yr-1] |
Benchmark Period Mean (complement) [Pg yr-1] |
Bias [g m-2 d-1] |
RMSE [g m-2 d-1] |
Phase Shift [months] |
Bias Score [1] |
RMSE Score [1] |
Seasonal Cycle Score [1] |
Spatial Distribution Score [1] |
Overall Score [1] |
|||
|---|---|---|---|---|---|---|---|---|---|---|---|---|---|---|---|---|
| Benchmark | [-] | 3.36 | ||||||||||||||
| CLM5PHSOFF | [-] | 4.03 | 3.86 | 0.182 | 3.34 | 0.0222 | 0.252 | 1.80 | 0.354 | 0.561 | 0.514 | 0.976 | 0.712 | 0.655 | ||
| CLM5PHSON | [-] | 5.10 | 5.05 | 0.0739 | 3.34 | 0.0222 | 1.01 | 1.85 | 0.553 | 0.604 | 0.523 | 0.964 | 0.914 | 0.705 |
Download Data |
Period Mean (original grids) [Pg yr-1] |
Model Period Mean (intersection) [Pg yr-1] |
Model Period Mean (complement) [Pg yr-1] |
Benchmark Period Mean (intersection) [Pg yr-1] |
Benchmark Period Mean (complement) [Pg yr-1] |
Bias [g m-2 d-1] |
RMSE [g m-2 d-1] |
Phase Shift [months] |
Bias Score [1] |
RMSE Score [1] |
Seasonal Cycle Score [1] |
Spatial Distribution Score [1] |
Overall Score [1] |
|||
|---|---|---|---|---|---|---|---|---|---|---|---|---|---|---|---|---|
| Benchmark | [-] | 1.79 | ||||||||||||||
| CLM5PHSOFF | [-] | 1.00 | 1.03 | 0.0583 | 1.79 | 0.00506 | -0.523 | 1.18 | 0.787 | 0.471 | 0.438 | 0.938 | 0.803 | 0.618 | ||
| CLM5PHSON | [-] | 1.65 | 1.74 | 0.0131 | 1.79 | 0.00506 | 0.0233 | 1.21 | 0.943 | 0.544 | 0.415 | 0.921 | 0.920 | 0.643 |
Download Data |
Period Mean (original grids) [Pg yr-1] |
Model Period Mean (intersection) [Pg yr-1] |
Model Period Mean (complement) [Pg yr-1] |
Benchmark Period Mean (intersection) [Pg yr-1] |
Benchmark Period Mean (complement) [Pg yr-1] |
Bias [g m-2 d-1] |
RMSE [g m-2 d-1] |
Phase Shift [months] |
Bias Score [1] |
RMSE Score [1] |
Seasonal Cycle Score [1] |
Spatial Distribution Score [1] |
Overall Score [1] |
|||
|---|---|---|---|---|---|---|---|---|---|---|---|---|---|---|---|---|
| Benchmark | [-] | 23.2 | ||||||||||||||
| CLM5PHSOFF | [-] | 21.2 | 20.5 | 0.577 | 23.2 | 0.0226 | -0.861 | 1.85 | 2.49 | 0.192 | 0.220 | 0.592 | 0.981 | 0.441 | ||
| CLM5PHSON | [-] | 19.4 | 19.1 | 0.167 | 23.2 | 0.0226 | -1.14 | 2.18 | 2.45 | 0.110 | 0.228 | 0.620 | 0.911 | 0.420 |
Download Data |
Period Mean (original grids) [Pg yr-1] |
Model Period Mean (intersection) [Pg yr-1] |
Model Period Mean (complement) [Pg yr-1] |
Benchmark Period Mean (intersection) [Pg yr-1] |
Benchmark Period Mean (complement) [Pg yr-1] |
Bias [g m-2 d-1] |
RMSE [g m-2 d-1] |
Phase Shift [months] |
Bias Score [1] |
RMSE Score [1] |
Seasonal Cycle Score [1] |
Spatial Distribution Score [1] |
Overall Score [1] |
|||
|---|---|---|---|---|---|---|---|---|---|---|---|---|---|---|---|---|
| Benchmark | [-] | 10.4 | ||||||||||||||
| CLM5PHSOFF | [-] | 8.74 | 8.12 | 0.704 | 10.4 | 0.00314 | -0.963 | 2.15 | 0.978 | 0.490 | 0.445 | 0.912 | 0.892 | 0.637 | ||
| CLM5PHSON | [-] | 10.2 | 10.0 | 0.321 | 10.4 | 0.00314 | -0.0344 | 1.98 | 1.01 | 0.545 | 0.451 | 0.906 | 0.872 | 0.645 |
Download Data |
Period Mean (original grids) [Pg yr-1] |
Model Period Mean (intersection) [Pg yr-1] |
Model Period Mean (complement) [Pg yr-1] |
Benchmark Period Mean (intersection) [Pg yr-1] |
Benchmark Period Mean (complement) [Pg yr-1] |
Bias [g m-2 d-1] |
RMSE [g m-2 d-1] |
Phase Shift [months] |
Bias Score [1] |
RMSE Score [1] |
Seasonal Cycle Score [1] |
Spatial Distribution Score [1] |
Overall Score [1] |
|||
|---|---|---|---|---|---|---|---|---|---|---|---|---|---|---|---|---|
| Benchmark | [-] | 1.16 | ||||||||||||||
| CLM5PHSOFF | [-] | 1.67 | 1.42 | 0.204 | 1.14 | 0.0148 | 0.271 | 1.04 | 1.35 | 0.391 | 0.406 | 0.901 | 0.886 | 0.598 | ||
| CLM5PHSON | [-] | 1.60 | 1.48 | 0.0727 | 1.14 | 0.0148 | 0.524 | 1.24 | 1.44 | 0.406 | 0.373 | 0.888 | 0.905 | 0.589 |
Temporally integrated period mean