Mean State
Download Data |
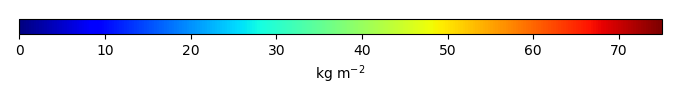
Period Mean (original grids) [Pg] |
Model Period Mean (intersection) [Pg] |
Model Period Mean (complement) [Pg] |
Benchmark Period Mean (intersection) [Pg] |
Benchmark Period Mean (complement) [Pg] |
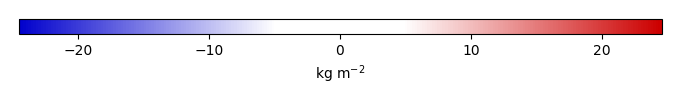
Bias [kg m-2] |
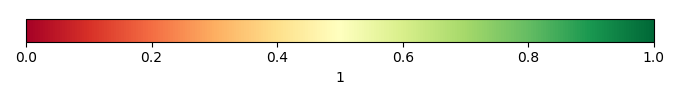
Bias Score [1] |
Spatial Distribution Score [1] |
Overall Score [1] |
|||
|---|---|---|---|---|---|---|---|---|---|---|---|---|
| Benchmark | [-] | 34.1 | ||||||||||
| CLM5PHSOFF | [-] | 33.5 | 32.8 | 1.04 | 33.8 | 0.315 | -0.225 | 0.707 | 0.943 | 0.825 | ||
| CLM5PHSON | [-] | 30.5 | 30.9 | 0.269 | 33.8 | 0.315 | -0.226 | 0.729 | 0.948 | 0.839 |
Download Data |
Period Mean (original grids) [Pg] |
Model Period Mean (intersection) [Pg] |
Model Period Mean (complement) [Pg] |
Benchmark Period Mean (intersection) [Pg] |
Benchmark Period Mean (complement) [Pg] |
Bias [kg m-2] |
Bias Score [1] |
Spatial Distribution Score [1] |
Overall Score [1] |
|||
|---|---|---|---|---|---|---|---|---|---|---|---|---|
| Benchmark | [-] | 44.8 | ||||||||||
| CLM5PHSOFF | [-] | 14.4 | 13.7 | 0.0504 | 44.4 | 0.478 | -4.51 | 0.498 | 0.639 | 0.569 | ||
| CLM5PHSON | [-] | 15.3 | 14.4 | 0.0241 | 44.4 | 0.478 | -4.37 | 0.502 | 0.776 | 0.639 |
Download Data |
Period Mean (original grids) [Pg] |
Model Period Mean (intersection) [Pg] |
Model Period Mean (complement) [Pg] |
Benchmark Period Mean (intersection) [Pg] |
Benchmark Period Mean (complement) [Pg] |
Bias [kg m-2] |
Bias Score [1] |
Spatial Distribution Score [1] |
Overall Score [1] |
|||
|---|---|---|---|---|---|---|---|---|---|---|---|---|
| Benchmark | [-] | 60.1 | ||||||||||
| CLM5PHSOFF | [-] | 31.2 | 27.7 | 2.83 | 59.3 | 0.762 | -3.34 | 0.542 | 0.843 | 0.693 | ||
| CLM5PHSON | [-] | 28.7 | 27.8 | 0.749 | 59.3 | 0.762 | -2.94 | 0.548 | 0.836 | 0.692 |
Download Data |
Period Mean (original grids) [Pg] |
Model Period Mean (intersection) [Pg] |
Model Period Mean (complement) [Pg] |
Benchmark Period Mean (intersection) [Pg] |
Benchmark Period Mean (complement) [Pg] |
Bias [kg m-2] |
Bias Score [1] |
Spatial Distribution Score [1] |
Overall Score [1] |
|||
|---|---|---|---|---|---|---|---|---|---|---|---|---|
| Benchmark | [-] | 11.1 | ||||||||||
| CLM5PHSOFF | [-] | 67.2 | 9.67 | 57.7 | 10.3 | 0.803 | -1.42 | 0.406 | 0.309 | 0.357 | ||
| CLM5PHSON | [-] | 101. | 9.11 | 91.2 | 10.3 | 0.803 | 7.12 | 0.427 | 0.186 | 0.307 |
Download Data |
Period Mean (original grids) [Pg] |
Model Period Mean (intersection) [Pg] |
Model Period Mean (complement) [Pg] |
Benchmark Period Mean (intersection) [Pg] |
Benchmark Period Mean (complement) [Pg] |
Bias [kg m-2] |
Bias Score [1] |
Spatial Distribution Score [1] |
Overall Score [1] |
|||
|---|---|---|---|---|---|---|---|---|---|---|---|---|
| Benchmark | [-] | 55.7 | ||||||||||
| CLM5PHSOFF | [-] | 41.7 | 33.9 | 6.36 | 50.7 | 4.99 | -4.94 | 0.682 | 0.304 | 0.493 | ||
| CLM5PHSON | [-] | 20.6 | 19.1 | 1.31 | 50.7 | 4.99 | -6.12 | 0.649 | 0.274 | 0.461 |
Download Data |
Period Mean (original grids) [Pg] |
Model Period Mean (intersection) [Pg] |
Model Period Mean (complement) [Pg] |
Benchmark Period Mean (intersection) [Pg] |
Benchmark Period Mean (complement) [Pg] |
Bias [kg m-2] |
Bias Score [1] |
Spatial Distribution Score [1] |
Overall Score [1] |
|||
|---|---|---|---|---|---|---|---|---|---|---|---|---|
| Benchmark | [-] | 65.6 | ||||||||||
| CLM5PHSOFF | [-] | 74.8 | 37.0 | 35.8 | 65.2 | 0.461 | -6.70 | 0.620 | 0.861 | 0.741 | ||
| CLM5PHSON | [-] | 133. | 59.0 | 71.0 | 65.2 | 0.461 | -1.06 | 0.711 | 0.837 | 0.774 |
Download Data |
Period Mean (original grids) [Pg] |
Model Period Mean (intersection) [Pg] |
Model Period Mean (complement) [Pg] |
Benchmark Period Mean (intersection) [Pg] |
Benchmark Period Mean (complement) [Pg] |
Bias [kg m-2] |
Bias Score [1] |
Spatial Distribution Score [1] |
Overall Score [1] |
|||
|---|---|---|---|---|---|---|---|---|---|---|---|---|
| Benchmark | [-] | 143. | ||||||||||
| CLM5PHSOFF | [-] | 63.0 | 59.5 | 4.76 | 141. | 2.09 | -4.68 | 0.549 | 0.842 | 0.695 | ||
| CLM5PHSON | [-] | 91.8 | 88.3 | 5.88 | 141. | 2.09 | -2.73 | 0.621 | 0.909 | 0.765 |
Download Data |
Period Mean (original grids) [Pg] |
Model Period Mean (intersection) [Pg] |
Model Period Mean (complement) [Pg] |
Benchmark Period Mean (intersection) [Pg] |
Benchmark Period Mean (complement) [Pg] |
Bias [kg m-2] |
Bias Score [1] |
Spatial Distribution Score [1] |
Overall Score [1] |
|||
|---|---|---|---|---|---|---|---|---|---|---|---|---|
| Benchmark | [-] | 58.4 | ||||||||||
| CLM5PHSOFF | [-] | 36.8 | 32.2 | 3.01 | 56.8 | 1.57 | -3.42 | 0.603 | 0.824 | 0.713 | ||
| CLM5PHSON | [-] | 33.0 | 31.1 | 0.855 | 56.8 | 1.57 | -2.67 | 0.656 | 0.862 | 0.759 |
Download Data |
Period Mean (original grids) [Pg] |
Model Period Mean (intersection) [Pg] |
Model Period Mean (complement) [Pg] |
Benchmark Period Mean (intersection) [Pg] |
Benchmark Period Mean (complement) [Pg] |
Bias [kg m-2] |
Bias Score [1] |
Spatial Distribution Score [1] |
Overall Score [1] |
|||
|---|---|---|---|---|---|---|---|---|---|---|---|---|
| Benchmark | [-] | 7.78 | ||||||||||
| CLM5PHSOFF | [-] | 87.0 | 9.96 | 78.0 | 7.36 | 0.414 | 6.55 | 0.447 | 0.350 | 0.398 | ||
| CLM5PHSON | [-] | 119. | 9.41 | 111. | 7.36 | 0.414 | 11.0 | 0.450 | 0.207 | 0.328 |
Download Data |
Period Mean (original grids) [Pg] |
Model Period Mean (intersection) [Pg] |
Model Period Mean (complement) [Pg] |
Benchmark Period Mean (intersection) [Pg] |
Benchmark Period Mean (complement) [Pg] |
Bias [kg m-2] |
Bias Score [1] |
Spatial Distribution Score [1] |
Overall Score [1] |
|||
|---|---|---|---|---|---|---|---|---|---|---|---|---|
| Benchmark | [-] | 58.9 | ||||||||||
| CLM5PHSOFF | [-] | 31.3 | 26.4 | 4.46 | 57.4 | 1.53 | -3.60 | 0.531 | 0.626 | 0.579 | ||
| CLM5PHSON | [-] | 27.6 | 25.8 | 1.60 | 57.4 | 1.53 | -2.75 | 0.541 | 0.473 | 0.507 |
Download Data |
Period Mean (original grids) [Pg] |
Model Period Mean (intersection) [Pg] |
Model Period Mean (complement) [Pg] |
Benchmark Period Mean (intersection) [Pg] |
Benchmark Period Mean (complement) [Pg] |
Bias [kg m-2] |
Bias Score [1] |
Spatial Distribution Score [1] |
Overall Score [1] |
|||
|---|---|---|---|---|---|---|---|---|---|---|---|---|
| Benchmark | [-] | 61.8 | ||||||||||
| CLM5PHSOFF | [-] | 39.5 | 33.0 | 5.63 | 60.2 | 1.58 | -4.92 | 0.629 | 0.840 | 0.735 | ||
| CLM5PHSON | [-] | 44.2 | 39.3 | 4.23 | 60.2 | 1.58 | -2.36 | 0.718 | 0.846 | 0.782 |
Download Data |
Period Mean (original grids) [Pg] |
Model Period Mean (intersection) [Pg] |
Model Period Mean (complement) [Pg] |
Benchmark Period Mean (intersection) [Pg] |
Benchmark Period Mean (complement) [Pg] |
Bias [kg m-2] |
Bias Score [1] |
Spatial Distribution Score [1] |
Overall Score [1] |
|||
|---|---|---|---|---|---|---|---|---|---|---|---|---|
| Benchmark | [-] | 1.09e+03 | ||||||||||
| CLM5PHSOFF | [-] | 886. | 543. | 342. | 1.03e+03 | 55.6 | -4.07 | 0.576 | 0.476 | 0.526 | ||
| CLM5PHSON | [-] | 1.06e+03 | 608. | 446. | 1.03e+03 | 55.6 | -2.80 | 0.621 | 0.752 | 0.686 |
Download Data |
Period Mean (original grids) [Pg] |
Model Period Mean (intersection) [Pg] |
Model Period Mean (complement) [Pg] |
Benchmark Period Mean (intersection) [Pg] |
Benchmark Period Mean (complement) [Pg] |
Bias [kg m-2] |
Bias Score [1] |
Spatial Distribution Score [1] |
Overall Score [1] |
|||
|---|---|---|---|---|---|---|---|---|---|---|---|---|
| Benchmark | [-] | 64.3 | ||||||||||
| CLM5PHSOFF | [-] | 7.36 | 6.25 | 1.08 | 63.6 | 0.726 | -3.51 | 0.410 | 0.615 | 0.513 | ||
| CLM5PHSON | [-] | 14.0 | 13.8 | 0.386 | 63.6 | 0.726 | -2.91 | 0.482 | 0.820 | 0.651 |
Download Data |
Period Mean (original grids) [Pg] |
Model Period Mean (intersection) [Pg] |
Model Period Mean (complement) [Pg] |
Benchmark Period Mean (intersection) [Pg] |
Benchmark Period Mean (complement) [Pg] |
Bias [kg m-2] |
Bias Score [1] |
Spatial Distribution Score [1] |
Overall Score [1] |
|||
|---|---|---|---|---|---|---|---|---|---|---|---|---|
| Benchmark | [-] | 13.3 | ||||||||||
| CLM5PHSOFF | [-] | 73.1 | 10.4 | 62.2 | 12.1 | 1.24 | -1.60 | 0.485 | 0.309 | 0.397 | ||
| CLM5PHSON | [-] | 123. | 8.60 | 114. | 12.1 | 1.24 | -0.123 | 0.473 | 0.574 | 0.524 |
Download Data |
Period Mean (original grids) [Pg] |
Model Period Mean (intersection) [Pg] |
Model Period Mean (complement) [Pg] |
Benchmark Period Mean (intersection) [Pg] |
Benchmark Period Mean (complement) [Pg] |
Bias [kg m-2] |
Bias Score [1] |
Spatial Distribution Score [1] |
Overall Score [1] |
|||
|---|---|---|---|---|---|---|---|---|---|---|---|---|
| Benchmark | [-] | 42.5 | ||||||||||
| CLM5PHSOFF | [-] | 23.2 | 19.6 | 2.87 | 40.2 | 2.26 | -6.41 | 0.560 | 0.676 | 0.618 | ||
| CLM5PHSON | [-] | 16.9 | 15.5 | 0.942 | 40.2 | 2.26 | -5.56 | 0.571 | 0.733 | 0.652 |
Download Data |
Period Mean (original grids) [Pg] |
Model Period Mean (intersection) [Pg] |
Model Period Mean (complement) [Pg] |
Benchmark Period Mean (intersection) [Pg] |
Benchmark Period Mean (complement) [Pg] |
Bias [kg m-2] |
Bias Score [1] |
Spatial Distribution Score [1] |
Overall Score [1] |
|||
|---|---|---|---|---|---|---|---|---|---|---|---|---|
| Benchmark | [-] | 45.3 | ||||||||||
| CLM5PHSOFF | [-] | 20.3 | 18.7 | 0.873 | 44.4 | 0.888 | -6.20 | 0.575 | 0.576 | 0.576 | ||
| CLM5PHSON | [-] | 32.2 | 31.2 | 0.326 | 44.4 | 0.888 | -2.77 | 0.722 | 0.773 | 0.747 |
Download Data |
Period Mean (original grids) [Pg] |
Model Period Mean (intersection) [Pg] |
Model Period Mean (complement) [Pg] |
Benchmark Period Mean (intersection) [Pg] |
Benchmark Period Mean (complement) [Pg] |
Bias [kg m-2] |
Bias Score [1] |
Spatial Distribution Score [1] |
Overall Score [1] |
|||
|---|---|---|---|---|---|---|---|---|---|---|---|---|
| Benchmark | [-] | 51.3 | ||||||||||
| CLM5PHSOFF | [-] | 45.7 | 24.0 | 22.1 | 49.6 | 1.76 | -7.84 | 0.561 | 0.826 | 0.693 | ||
| CLM5PHSON | [-] | 75.2 | 39.4 | 36.1 | 49.6 | 1.76 | -2.45 | 0.632 | 0.880 | 0.756 |
Download Data |
Period Mean (original grids) [Pg] |
Model Period Mean (intersection) [Pg] |
Model Period Mean (complement) [Pg] |
Benchmark Period Mean (intersection) [Pg] |
Benchmark Period Mean (complement) [Pg] |
Bias [kg m-2] |
Bias Score [1] |
Spatial Distribution Score [1] |
Overall Score [1] |
|||
|---|---|---|---|---|---|---|---|---|---|---|---|---|
| Benchmark | [-] | 34.3 | ||||||||||
| CLM5PHSOFF | [-] | 7.06 | 7.21 | 0.410 | 34.0 | 0.216 | -6.81 | 0.461 | 0.731 | 0.596 | ||
| CLM5PHSON | [-] | 11.5 | 11.8 | 0.377 | 34.0 | 0.216 | -5.39 | 0.539 | 0.874 | 0.706 |
Download Data |
Period Mean (original grids) [Pg] |
Model Period Mean (intersection) [Pg] |
Model Period Mean (complement) [Pg] |
Benchmark Period Mean (intersection) [Pg] |
Benchmark Period Mean (complement) [Pg] |
Bias [kg m-2] |
Bias Score [1] |
Spatial Distribution Score [1] |
Overall Score [1] |
|||
|---|---|---|---|---|---|---|---|---|---|---|---|---|
| Benchmark | [-] | 101. | ||||||||||
| CLM5PHSOFF | [-] | 74.2 | 72.2 | 1.62 | 100. | 0.811 | -3.26 | 0.691 | 0.517 | 0.604 | ||
| CLM5PHSON | [-] | 68.5 | 67.8 | 0.372 | 100. | 0.811 | -3.35 | 0.692 | 0.464 | 0.578 |
Download Data |
Period Mean (original grids) [Pg] |
Model Period Mean (intersection) [Pg] |
Model Period Mean (complement) [Pg] |
Benchmark Period Mean (intersection) [Pg] |
Benchmark Period Mean (complement) [Pg] |
Bias [kg m-2] |
Bias Score [1] |
Spatial Distribution Score [1] |
Overall Score [1] |
|||
|---|---|---|---|---|---|---|---|---|---|---|---|---|
| Benchmark | [-] | 60.7 | ||||||||||
| CLM5PHSOFF | [-] | 41.4 | 40.3 | 1.47 | 60.4 | 0.300 | -2.91 | 0.646 | 0.759 | 0.702 | ||
| CLM5PHSON | [-] | 47.2 | 47.5 | 0.479 | 60.4 | 0.300 | -1.44 | 0.672 | 0.836 | 0.754 |
Download Data |
Period Mean (original grids) [Pg] |
Model Period Mean (intersection) [Pg] |
Model Period Mean (complement) [Pg] |
Benchmark Period Mean (intersection) [Pg] |
Benchmark Period Mean (complement) [Pg] |
Bias [kg m-2] |
Bias Score [1] |
Spatial Distribution Score [1] |
Overall Score [1] |
|||
|---|---|---|---|---|---|---|---|---|---|---|---|---|
| Benchmark | [-] | 29.6 | ||||||||||
| CLM5PHSOFF | [-] | 16.2 | 14.1 | 1.51 | 28.2 | 1.46 | -4.22 | 0.525 | 0.544 | 0.534 | ||
| CLM5PHSON | [-] | 15.7 | 14.8 | 0.272 | 28.2 | 1.46 | -3.23 | 0.571 | 0.493 | 0.532 |
Temporally integrated period mean