Mean State
Download Data |
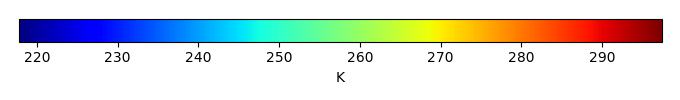
Period Mean (original grids) [K] |
Model Period Mean (intersection) [K] |
Model Period Mean (complement) [K] |
Benchmark Period Mean (intersection) [K] |
Benchmark Period Mean (complement) [K] |
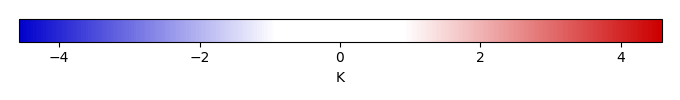
Bias [K] |
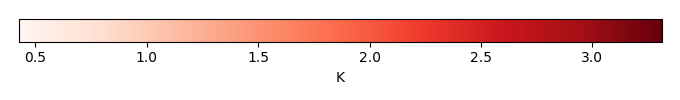
RMSE [K] |
Phase Shift [months] |
Bias Score [1] |
RMSE Score [1] |
Seasonal Cycle Score [1] |
Spatial Distribution Score [1] |
Interannual Variability Score [1] |
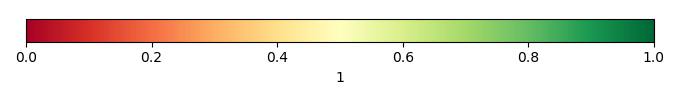
Overall Score [1] |
|||
|---|---|---|---|---|---|---|---|---|---|---|---|---|---|---|---|---|---|
| Benchmark | [-] | 293. | |||||||||||||||
| CLM5PHSOFF | [-] | 294. | 294. | 297. | 293. | 296. | 0.778 | 1.30 | 0.646 | 0.481 | 0.471 | 0.926 | 0.998 | 0.758 | 0.684 | ||
| CLM5PHSON | [-] | 294. | 293. | 297. | 293. | 296. | 0.843 | 1.30 | 0.638 | 0.446 | 0.486 | 0.928 | 0.997 | 0.773 | 0.686 |
Download Data |
Period Mean (original grids) [K] |
Model Period Mean (intersection) [K] |
Model Period Mean (complement) [K] |
Benchmark Period Mean (intersection) [K] |
Benchmark Period Mean (complement) [K] |
Bias [K] |
RMSE [K] |
Phase Shift [months] |
Bias Score [1] |
RMSE Score [1] |
Seasonal Cycle Score [1] |
Spatial Distribution Score [1] |
Interannual Variability Score [1] |
Overall Score [1] |
|||
|---|---|---|---|---|---|---|---|---|---|---|---|---|---|---|---|---|---|
| Benchmark | [-] | 293. | |||||||||||||||
| CLM5PHSOFF | [-] | 294. | 294. | 297. | 293. | 294. | 1.15 | 1.50 | 0.202 | 0.622 | 0.749 | 0.983 | 0.986 | 0.863 | 0.825 | ||
| CLM5PHSON | [-] | 294. | 294. | 296. | 293. | 294. | 1.17 | 1.50 | 0.181 | 0.620 | 0.750 | 0.985 | 0.987 | 0.860 | 0.825 |
Download Data |
Period Mean (original grids) [K] |
Model Period Mean (intersection) [K] |
Model Period Mean (complement) [K] |
Benchmark Period Mean (intersection) [K] |
Benchmark Period Mean (complement) [K] |
Bias [K] |
RMSE [K] |
Phase Shift [months] |
Bias Score [1] |
RMSE Score [1] |
Seasonal Cycle Score [1] |
Spatial Distribution Score [1] |
Interannual Variability Score [1] |
Overall Score [1] |
|||
|---|---|---|---|---|---|---|---|---|---|---|---|---|---|---|---|---|---|
| Benchmark | [-] | 288. | |||||||||||||||
| CLM5PHSOFF | [-] | 290. | 289. | 294. | 288. | 293. | 1.04 | 1.39 | 0.563 | 0.655 | 0.785 | 0.933 | 1.00 | 0.840 | 0.833 | ||
| CLM5PHSON | [-] | 289. | 289. | 293. | 288. | 293. | 1.00 | 1.36 | 0.598 | 0.662 | 0.786 | 0.927 | 1.00 | 0.839 | 0.834 |
Download Data |
Period Mean (original grids) [K] |
Model Period Mean (intersection) [K] |
Model Period Mean (complement) [K] |
Benchmark Period Mean (intersection) [K] |
Benchmark Period Mean (complement) [K] |
Bias [K] |
RMSE [K] |
Phase Shift [months] |
Bias Score [1] |
RMSE Score [1] |
Seasonal Cycle Score [1] |
Spatial Distribution Score [1] |
Interannual Variability Score [1] |
Overall Score [1] |
|||
|---|---|---|---|---|---|---|---|---|---|---|---|---|---|---|---|---|---|
| Benchmark | [-] | 256. | |||||||||||||||
| CLM5PHSOFF | [-] | 257. | 257. | 265. | 256. | 261. | 0.437 | 1.75 | 0.0380 | 0.932 | 0.918 | 0.997 | 0.999 | 0.907 | 0.945 | ||
| CLM5PHSON | [-] | 256. | 256. | 264. | 256. | 261. | 0.395 | 1.75 | 0.0380 | 0.932 | 0.918 | 0.997 | 0.999 | 0.908 | 0.945 |
Download Data |
Period Mean (original grids) [K] |
Model Period Mean (intersection) [K] |
Model Period Mean (complement) [K] |
Benchmark Period Mean (intersection) [K] |
Benchmark Period Mean (complement) [K] |
Bias [K] |
RMSE [K] |
Phase Shift [months] |
Bias Score [1] |
RMSE Score [1] |
Seasonal Cycle Score [1] |
Spatial Distribution Score [1] |
Interannual Variability Score [1] |
Overall Score [1] |
|||
|---|---|---|---|---|---|---|---|---|---|---|---|---|---|---|---|---|---|
| Benchmark | [-] | 294. | |||||||||||||||
| CLM5PHSOFF | [-] | 296. | 295. | 297. | 294. | 295. | 1.14 | 1.62 | 1.24 | 0.293 | 0.499 | 0.816 | 0.959 | 0.828 | 0.649 | ||
| CLM5PHSON | [-] | 295. | 295. | 297. | 294. | 295. | 1.21 | 1.66 | 1.28 | 0.281 | 0.505 | 0.809 | 0.960 | 0.814 | 0.646 |
Download Data |
Period Mean (original grids) [K] |
Model Period Mean (intersection) [K] |
Model Period Mean (complement) [K] |
Benchmark Period Mean (intersection) [K] |
Benchmark Period Mean (complement) [K] |
Bias [K] |
RMSE [K] |
Phase Shift [months] |
Bias Score [1] |
RMSE Score [1] |
Seasonal Cycle Score [1] |
Spatial Distribution Score [1] |
Interannual Variability Score [1] |
Overall Score [1] |
|||
|---|---|---|---|---|---|---|---|---|---|---|---|---|---|---|---|---|---|
| Benchmark | [-] | 265. | |||||||||||||||
| CLM5PHSOFF | [-] | 265. | 265. | 272. | 265. | 269. | -0.138 | 1.13 | 0.0181 | 0.947 | 0.943 | 0.999 | 0.997 | 0.965 | 0.966 | ||
| CLM5PHSON | [-] | 265. | 265. | 272. | 265. | 269. | -0.198 | 1.13 | 0.0191 | 0.945 | 0.945 | 0.999 | 0.997 | 0.965 | 0.966 |
Download Data |
Period Mean (original grids) [K] |
Model Period Mean (intersection) [K] |
Model Period Mean (complement) [K] |
Benchmark Period Mean (intersection) [K] |
Benchmark Period Mean (complement) [K] |
Bias [K] |
RMSE [K] |
Phase Shift [months] |
Bias Score [1] |
RMSE Score [1] |
Seasonal Cycle Score [1] |
Spatial Distribution Score [1] |
Interannual Variability Score [1] |
Overall Score [1] |
|||
|---|---|---|---|---|---|---|---|---|---|---|---|---|---|---|---|---|---|
| Benchmark | [-] | 274. | |||||||||||||||
| CLM5PHSOFF | [-] | 275. | 275. | 286. | 274. | 280. | 0.732 | 1.56 | 0.0151 | 0.879 | 0.924 | 0.999 | 1.00 | 0.928 | 0.942 | ||
| CLM5PHSON | [-] | 274. | 274. | 285. | 274. | 280. | 0.670 | 1.54 | 0.0163 | 0.881 | 0.923 | 0.999 | 0.999 | 0.928 | 0.942 |
Download Data |
Period Mean (original grids) [K] |
Model Period Mean (intersection) [K] |
Model Period Mean (complement) [K] |
Benchmark Period Mean (intersection) [K] |
Benchmark Period Mean (complement) [K] |
Bias [K] |
RMSE [K] |
Phase Shift [months] |
Bias Score [1] |
RMSE Score [1] |
Seasonal Cycle Score [1] |
Spatial Distribution Score [1] |
Interannual Variability Score [1] |
Overall Score [1] |
|||
|---|---|---|---|---|---|---|---|---|---|---|---|---|---|---|---|---|---|
| Benchmark | [-] | 291. | |||||||||||||||
| CLM5PHSOFF | [-] | 292. | 292. | 297. | 291. | 296. | 0.795 | 1.53 | 0.241 | 0.712 | 0.845 | 0.980 | 0.999 | 0.926 | 0.884 | ||
| CLM5PHSON | [-] | 291. | 291. | 297. | 291. | 296. | 0.736 | 1.51 | 0.255 | 0.717 | 0.846 | 0.978 | 0.999 | 0.929 | 0.886 |
Download Data |
Period Mean (original grids) [K] |
Model Period Mean (intersection) [K] |
Model Period Mean (complement) [K] |
Benchmark Period Mean (intersection) [K] |
Benchmark Period Mean (complement) [K] |
Bias [K] |
RMSE [K] |
Phase Shift [months] |
Bias Score [1] |
RMSE Score [1] |
Seasonal Cycle Score [1] |
Spatial Distribution Score [1] |
Interannual Variability Score [1] |
Overall Score [1] |
|||
|---|---|---|---|---|---|---|---|---|---|---|---|---|---|---|---|---|---|
| Benchmark | [-] | 259. | |||||||||||||||
| CLM5PHSOFF | [-] | 259. | 259. | 265. | 259. | 260. | -0.180 | 1.47 | 0.0268 | 0.956 | 0.923 | 0.998 | 1.00 | 0.920 | 0.953 | ||
| CLM5PHSON | [-] | 259. | 259. | 263. | 259. | 260. | -0.224 | 1.48 | 0.0263 | 0.954 | 0.923 | 0.998 | 1.00 | 0.921 | 0.953 |
Download Data |
Period Mean (original grids) [K] |
Model Period Mean (intersection) [K] |
Model Period Mean (complement) [K] |
Benchmark Period Mean (intersection) [K] |
Benchmark Period Mean (complement) [K] |
Bias [K] |
RMSE [K] |
Phase Shift [months] |
Bias Score [1] |
RMSE Score [1] |
Seasonal Cycle Score [1] |
Spatial Distribution Score [1] |
Interannual Variability Score [1] |
Overall Score [1] |
|||
|---|---|---|---|---|---|---|---|---|---|---|---|---|---|---|---|---|---|
| Benchmark | [-] | 287. | |||||||||||||||
| CLM5PHSOFF | [-] | 289. | 289. | 290. | 287. | 289. | 1.17 | 1.35 | 0.134 | 0.770 | 0.888 | 0.991 | 1.00 | 0.942 | 0.913 | ||
| CLM5PHSON | [-] | 289. | 289. | 290. | 287. | 289. | 1.16 | 1.34 | 0.138 | 0.770 | 0.891 | 0.991 | 1.00 | 0.943 | 0.914 |
Download Data |
Period Mean (original grids) [K] |
Model Period Mean (intersection) [K] |
Model Period Mean (complement) [K] |
Benchmark Period Mean (intersection) [K] |
Benchmark Period Mean (complement) [K] |
Bias [K] |
RMSE [K] |
Phase Shift [months] |
Bias Score [1] |
RMSE Score [1] |
Seasonal Cycle Score [1] |
Spatial Distribution Score [1] |
Interannual Variability Score [1] |
Overall Score [1] |
|||
|---|---|---|---|---|---|---|---|---|---|---|---|---|---|---|---|---|---|
| Benchmark | [-] | 277. | |||||||||||||||
| CLM5PHSOFF | [-] | 278. | 277. | 282. | 277. | 281. | 0.100 | 1.14 | 0.216 | 0.859 | 0.907 | 0.985 | 0.993 | 0.941 | 0.932 | ||
| CLM5PHSON | [-] | 277. | 277. | 280. | 277. | 281. | 0.00878 | 1.14 | 0.219 | 0.859 | 0.905 | 0.985 | 0.994 | 0.942 | 0.932 |
Download Data |
Period Mean (original grids) [K] |
Model Period Mean (intersection) [K] |
Model Period Mean (complement) [K] |
Benchmark Period Mean (intersection) [K] |
Benchmark Period Mean (complement) [K] |
Bias [K] |
RMSE [K] |
Phase Shift [months] |
Bias Score [1] |
RMSE Score [1] |
Seasonal Cycle Score [1] |
Spatial Distribution Score [1] |
Interannual Variability Score [1] |
Overall Score [1] |
|||
|---|---|---|---|---|---|---|---|---|---|---|---|---|---|---|---|---|---|
| Benchmark | [-] | 281. | |||||||||||||||
| CLM5PHSOFF | [-] | 278. | 281. | 257. | 280. | 287. | 0.718 | 1.47 | 0.268 | 0.759 | 0.833 | 0.968 | 0.999 | 0.909 | 0.884 | ||
| CLM5PHSON | [-] | 277. | 281. | 244. | 280. | 287. | 0.686 | 1.46 | 0.269 | 0.759 | 0.835 | 0.968 | 0.999 | 0.909 | 0.884 |
Download Data |
Period Mean (original grids) [K] |
Model Period Mean (intersection) [K] |
Model Period Mean (complement) [K] |
Benchmark Period Mean (intersection) [K] |
Benchmark Period Mean (complement) [K] |
Bias [K] |
RMSE [K] |
Phase Shift [months] |
Bias Score [1] |
RMSE Score [1] |
Seasonal Cycle Score [1] |
Spatial Distribution Score [1] |
Interannual Variability Score [1] |
Overall Score [1] |
|||
|---|---|---|---|---|---|---|---|---|---|---|---|---|---|---|---|---|---|
| Benchmark | [-] | 289. | |||||||||||||||
| CLM5PHSOFF | [-] | 289. | 289. | 293. | 288. | 292. | 0.668 | 1.30 | 0.235 | 0.850 | 0.883 | 0.982 | 1.00 | 0.908 | 0.918 | ||
| CLM5PHSON | [-] | 289. | 289. | 292. | 288. | 292. | 0.623 | 1.29 | 0.238 | 0.852 | 0.882 | 0.982 | 1.00 | 0.909 | 0.918 |
Download Data |
Period Mean (original grids) [K] |
Model Period Mean (intersection) [K] |
Model Period Mean (complement) [K] |
Benchmark Period Mean (intersection) [K] |
Benchmark Period Mean (complement) [K] |
Bias [K] |
RMSE [K] |
Phase Shift [months] |
Bias Score [1] |
RMSE Score [1] |
Seasonal Cycle Score [1] |
Spatial Distribution Score [1] |
Interannual Variability Score [1] |
Overall Score [1] |
|||
|---|---|---|---|---|---|---|---|---|---|---|---|---|---|---|---|---|---|
| Benchmark | [-] | 260. | |||||||||||||||
| CLM5PHSOFF | [-] | 261. | 260. | 264. | 260. | 262. | 0.424 | 1.52 | 0.0476 | 0.938 | 0.915 | 0.997 | 0.998 | 0.920 | 0.947 | ||
| CLM5PHSON | [-] | 260. | 260. | 262. | 260. | 262. | 0.385 | 1.52 | 0.0456 | 0.938 | 0.915 | 0.997 | 0.998 | 0.920 | 0.947 |
Download Data |
Period Mean (original grids) [K] |
Model Period Mean (intersection) [K] |
Model Period Mean (complement) [K] |
Benchmark Period Mean (intersection) [K] |
Benchmark Period Mean (complement) [K] |
Bias [K] |
RMSE [K] |
Phase Shift [months] |
Bias Score [1] |
RMSE Score [1] |
Seasonal Cycle Score [1] |
Spatial Distribution Score [1] |
Interannual Variability Score [1] |
Overall Score [1] |
|||
|---|---|---|---|---|---|---|---|---|---|---|---|---|---|---|---|---|---|
| Benchmark | [-] | 289. | |||||||||||||||
| CLM5PHSOFF | [-] | 291. | 290. | 295. | 289. | 293. | 1.41 | 2.01 | 0.355 | 0.567 | 0.765 | 0.964 | 0.999 | 0.907 | 0.828 | ||
| CLM5PHSON | [-] | 289. | 289. | 294. | 289. | 293. | 1.40 | 2.00 | 0.369 | 0.568 | 0.766 | 0.961 | 0.999 | 0.905 | 0.828 |
Download Data |
Period Mean (original grids) [K] |
Model Period Mean (intersection) [K] |
Model Period Mean (complement) [K] |
Benchmark Period Mean (intersection) [K] |
Benchmark Period Mean (complement) [K] |
Bias [K] |
RMSE [K] |
Phase Shift [months] |
Bias Score [1] |
RMSE Score [1] |
Seasonal Cycle Score [1] |
Spatial Distribution Score [1] |
Interannual Variability Score [1] |
Overall Score [1] |
|||
|---|---|---|---|---|---|---|---|---|---|---|---|---|---|---|---|---|---|
| Benchmark | [-] | 280. | |||||||||||||||
| CLM5PHSOFF | [-] | 281. | 281. | 289. | 280. | 287. | 1.13 | 1.32 | 0.0279 | 0.870 | 0.938 | 0.998 | 1.00 | 0.971 | 0.952 | ||
| CLM5PHSON | [-] | 281. | 281. | 289. | 280. | 287. | 1.06 | 1.27 | 0.0255 | 0.876 | 0.936 | 0.998 | 1.00 | 0.972 | 0.953 |
Download Data |
Period Mean (original grids) [K] |
Model Period Mean (intersection) [K] |
Model Period Mean (complement) [K] |
Benchmark Period Mean (intersection) [K] |
Benchmark Period Mean (complement) [K] |
Bias [K] |
RMSE [K] |
Phase Shift [months] |
Bias Score [1] |
RMSE Score [1] |
Seasonal Cycle Score [1] |
Spatial Distribution Score [1] |
Interannual Variability Score [1] |
Overall Score [1] |
|||
|---|---|---|---|---|---|---|---|---|---|---|---|---|---|---|---|---|---|
| Benchmark | [-] | 268. | |||||||||||||||
| CLM5PHSOFF | [-] | 269. | 269. | 276. | 268. | 274. | 0.498 | 1.18 | 0.0384 | 0.920 | 0.924 | 0.997 | 0.997 | 0.950 | 0.952 | ||
| CLM5PHSON | [-] | 268. | 268. | 274. | 268. | 274. | 0.439 | 1.14 | 0.0361 | 0.922 | 0.926 | 0.998 | 0.997 | 0.952 | 0.953 |
Download Data |
Period Mean (original grids) [K] |
Model Period Mean (intersection) [K] |
Model Period Mean (complement) [K] |
Benchmark Period Mean (intersection) [K] |
Benchmark Period Mean (complement) [K] |
Bias [K] |
RMSE [K] |
Phase Shift [months] |
Bias Score [1] |
RMSE Score [1] |
Seasonal Cycle Score [1] |
Spatial Distribution Score [1] |
Interannual Variability Score [1] |
Overall Score [1] |
|||
|---|---|---|---|---|---|---|---|---|---|---|---|---|---|---|---|---|---|
| Benchmark | [-] | 276. | |||||||||||||||
| CLM5PHSOFF | [-] | 277. | 277. | 284. | 276. | 280. | 1.56 | 2.02 | 0.0424 | 0.785 | 0.890 | 0.997 | 0.998 | 0.938 | 0.916 | ||
| CLM5PHSON | [-] | 277. | 277. | 283. | 276. | 280. | 1.52 | 2.00 | 0.0516 | 0.787 | 0.891 | 0.997 | 0.998 | 0.943 | 0.918 |
Download Data |
Period Mean (original grids) [K] |
Model Period Mean (intersection) [K] |
Model Period Mean (complement) [K] |
Benchmark Period Mean (intersection) [K] |
Benchmark Period Mean (complement) [K] |
Bias [K] |
RMSE [K] |
Phase Shift [months] |
Bias Score [1] |
RMSE Score [1] |
Seasonal Cycle Score [1] |
Spatial Distribution Score [1] |
Interannual Variability Score [1] |
Overall Score [1] |
|||
|---|---|---|---|---|---|---|---|---|---|---|---|---|---|---|---|---|---|
| Benchmark | [-] | 294. | |||||||||||||||
| CLM5PHSOFF | [-] | 295. | 295. | 297. | 294. | 294. | 0.871 | 1.36 | 1.13 | 0.416 | 0.538 | 0.828 | 0.996 | 0.881 | 0.699 | ||
| CLM5PHSON | [-] | 295. | 295. | 297. | 294. | 294. | 0.925 | 1.38 | 1.11 | 0.399 | 0.552 | 0.833 | 0.996 | 0.871 | 0.700 |
Download Data |
Period Mean (original grids) [K] |
Model Period Mean (intersection) [K] |
Model Period Mean (complement) [K] |
Benchmark Period Mean (intersection) [K] |
Benchmark Period Mean (complement) [K] |
Bias [K] |
RMSE [K] |
Phase Shift [months] |
Bias Score [1] |
RMSE Score [1] |
Seasonal Cycle Score [1] |
Spatial Distribution Score [1] |
Interannual Variability Score [1] |
Overall Score [1] |
|||
|---|---|---|---|---|---|---|---|---|---|---|---|---|---|---|---|---|---|
| Benchmark | [-] | 290. | |||||||||||||||
| CLM5PHSOFF | [-] | 291. | 291. | 293. | 290. | 288. | 1.10 | 1.34 | 0.512 | 0.629 | 0.795 | 0.931 | 1.00 | 0.937 | 0.848 | ||
| CLM5PHSON | [-] | 291. | 291. | 293. | 290. | 288. | 1.06 | 1.31 | 0.478 | 0.637 | 0.798 | 0.938 | 1.00 | 0.935 | 0.851 |
Download Data |
Period Mean (original grids) [K] |
Model Period Mean (intersection) [K] |
Model Period Mean (complement) [K] |
Benchmark Period Mean (intersection) [K] |
Benchmark Period Mean (complement) [K] |
Bias [K] |
RMSE [K] |
Phase Shift [months] |
Bias Score [1] |
RMSE Score [1] |
Seasonal Cycle Score [1] |
Spatial Distribution Score [1] |
Interannual Variability Score [1] |
Overall Score [1] |
|||
|---|---|---|---|---|---|---|---|---|---|---|---|---|---|---|---|---|---|
| Benchmark | [-] | 278. | |||||||||||||||
| CLM5PHSOFF | [-] | 279. | 279. | 285. | 278. | 281. | 1.29 | 2.21 | 0.117 | 0.590 | 0.794 | 0.990 | 1.00 | 0.922 | 0.848 | ||
| CLM5PHSON | [-] | 279. | 278. | 284. | 278. | 281. | 1.24 | 2.18 | 0.122 | 0.596 | 0.793 | 0.989 | 1.00 | 0.922 | 0.849 |
Temporally integrated period mean