Mean State
Download Data |
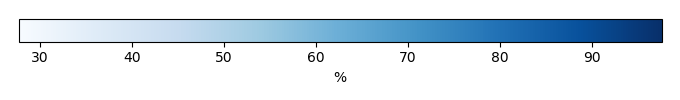
Period Mean (original grids) [%] |
Model Period Mean (intersection) [%] |
Model Period Mean (complement) [%] |
Benchmark Period Mean (intersection) [%] |
Benchmark Period Mean (complement) [%] |
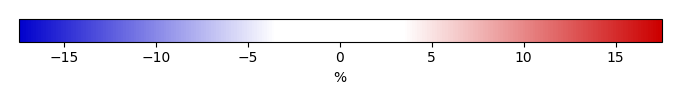
Bias [%] |
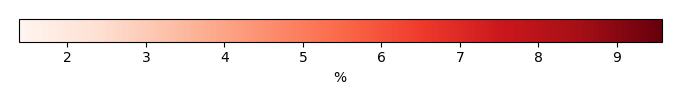
RMSE [%] |
Phase Shift [months] |
Bias Score [1] |
RMSE Score [1] |
Seasonal Cycle Score [1] |
Spatial Distribution Score [1] |
Interannual Variability Score [1] |
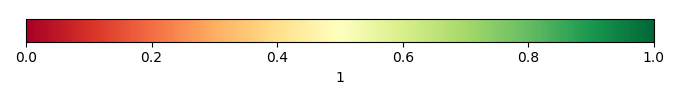
Overall Score [1] |
|||
|---|---|---|---|---|---|---|---|---|---|---|---|---|---|---|---|---|---|
| Benchmark | [-] | 77.9 | |||||||||||||||
| CLM5PHSOFF | [-] | 70.0 | 70.1 | 77.8 | 80.3 | -7.83 | 13.6 | 1.96 | 0.342 | 0.239 | 0.716 | 0.997 | 0.501 | 0.506 | |||
| CLM5PHSON | [-] | 68.7 | 68.9 | 77.8 | 80.3 | -8.28 | 14.1 | 1.93 | 0.336 | 0.234 | 0.722 | 0.997 | 0.484 | 0.501 |
Download Data |
Period Mean (original grids) [%] |
Model Period Mean (intersection) [%] |
Model Period Mean (complement) [%] |
Benchmark Period Mean (intersection) [%] |
Benchmark Period Mean (complement) [%] |
Bias [%] |
RMSE [%] |
Phase Shift [months] |
Bias Score [1] |
RMSE Score [1] |
Seasonal Cycle Score [1] |
Spatial Distribution Score [1] |
Interannual Variability Score [1] |
Overall Score [1] |
|||
|---|---|---|---|---|---|---|---|---|---|---|---|---|---|---|---|---|---|
| Benchmark | [-] | 53.6 | |||||||||||||||
| CLM5PHSOFF | [-] | 51.4 | 50.8 | 53.2 | 77.5 | -2.44 | 11.8 | 0.555 | 0.734 | 0.591 | 0.927 | 0.967 | 0.838 | 0.775 | |||
| CLM5PHSON | [-] | 51.0 | 50.5 | 53.2 | 77.5 | -2.52 | 11.8 | 0.548 | 0.733 | 0.592 | 0.929 | 0.969 | 0.837 | 0.775 |
Download Data |
Period Mean (original grids) [%] |
Model Period Mean (intersection) [%] |
Model Period Mean (complement) [%] |
Benchmark Period Mean (intersection) [%] |
Benchmark Period Mean (complement) [%] |
Bias [%] |
RMSE [%] |
Phase Shift [months] |
Bias Score [1] |
RMSE Score [1] |
Seasonal Cycle Score [1] |
Spatial Distribution Score [1] |
Interannual Variability Score [1] |
Overall Score [1] |
|||
|---|---|---|---|---|---|---|---|---|---|---|---|---|---|---|---|---|---|
| Benchmark | [-] | 64.2 | |||||||||||||||
| CLM5PHSOFF | [-] | 62.5 | 62.3 | 63.5 | 77.8 | -1.21 | 11.3 | 1.10 | 0.596 | 0.441 | 0.849 | 0.970 | 0.757 | 0.675 | |||
| CLM5PHSON | [-] | 61.1 | 61.1 | 63.5 | 77.8 | -1.12 | 11.5 | 1.17 | 0.595 | 0.435 | 0.837 | 0.971 | 0.749 | 0.670 |
Download Data |
Period Mean (original grids) [%] |
Model Period Mean (intersection) [%] |
Model Period Mean (complement) [%] |
Benchmark Period Mean (intersection) [%] |
Benchmark Period Mean (complement) [%] |
Bias [%] |
RMSE [%] |
Phase Shift [months] |
Bias Score [1] |
RMSE Score [1] |
Seasonal Cycle Score [1] |
Spatial Distribution Score [1] |
Interannual Variability Score [1] |
Overall Score [1] |
|||
|---|---|---|---|---|---|---|---|---|---|---|---|---|---|---|---|---|---|
| Benchmark | [-] | 77.6 | |||||||||||||||
| CLM5PHSOFF | [-] | 89.0 | 88.9 | 77.1 | 83.4 | 11.8 | 17.9 | 2.90 | 0.111 | 0.0764 | 0.528 | 0.705 | 0.574 | 0.345 | |||
| CLM5PHSON | [-] | 88.5 | 88.5 | 77.1 | 83.4 | 11.6 | 17.7 | 2.76 | 0.114 | 0.0792 | 0.549 | 0.727 | 0.555 | 0.350 |
Download Data |
Period Mean (original grids) [%] |
Model Period Mean (intersection) [%] |
Model Period Mean (complement) [%] |
Benchmark Period Mean (intersection) [%] |
Benchmark Period Mean (complement) [%] |
Bias [%] |
RMSE [%] |
Phase Shift [months] |
Bias Score [1] |
RMSE Score [1] |
Seasonal Cycle Score [1] |
Spatial Distribution Score [1] |
Interannual Variability Score [1] |
Overall Score [1] |
|||
|---|---|---|---|---|---|---|---|---|---|---|---|---|---|---|---|---|---|
| Benchmark | [-] | 84.2 | |||||||||||||||
| CLM5PHSOFF | [-] | 84.8 | 84.8 | 85.0 | 81.2 | -0.214 | 5.07 | 1.44 | 0.598 | 0.246 | 0.793 | 0.995 | 0.538 | 0.569 | |||
| CLM5PHSON | [-] | 85.2 | 85.2 | 85.0 | 81.2 | -0.688 | 5.23 | 1.42 | 0.587 | 0.237 | 0.797 | 0.998 | 0.516 | 0.562 |
Download Data |
Period Mean (original grids) [%] |
Model Period Mean (intersection) [%] |
Model Period Mean (complement) [%] |
Benchmark Period Mean (intersection) [%] |
Benchmark Period Mean (complement) [%] |
Bias [%] |
RMSE [%] |
Phase Shift [months] |
Bias Score [1] |
RMSE Score [1] |
Seasonal Cycle Score [1] |
Spatial Distribution Score [1] |
Interannual Variability Score [1] |
Overall Score [1] |
|||
|---|---|---|---|---|---|---|---|---|---|---|---|---|---|---|---|---|---|
| Benchmark | [-] | 72.3 | |||||||||||||||
| CLM5PHSOFF | [-] | 82.8 | 82.8 | 72.2 | 78.9 | 10.6 | 18.6 | 2.07 | 0.319 | 0.187 | 0.694 | 0.975 | 0.582 | 0.491 | |||
| CLM5PHSON | [-] | 82.6 | 82.6 | 72.2 | 78.9 | 10.4 | 17.9 | 2.16 | 0.321 | 0.199 | 0.684 | 0.974 | 0.573 | 0.492 |
Download Data |
Period Mean (original grids) [%] |
Model Period Mean (intersection) [%] |
Model Period Mean (complement) [%] |
Benchmark Period Mean (intersection) [%] |
Benchmark Period Mean (complement) [%] |
Bias [%] |
RMSE [%] |
Phase Shift [months] |
Bias Score [1] |
RMSE Score [1] |
Seasonal Cycle Score [1] |
Spatial Distribution Score [1] |
Interannual Variability Score [1] |
Overall Score [1] |
|||
|---|---|---|---|---|---|---|---|---|---|---|---|---|---|---|---|---|---|
| Benchmark | [-] | 61.3 | |||||||||||||||
| CLM5PHSOFF | [-] | 65.7 | 65.9 | 61.0 | 71.3 | 4.95 | 16.2 | 2.01 | 0.545 | 0.320 | 0.696 | 0.995 | 0.761 | 0.606 | |||
| CLM5PHSON | [-] | 65.2 | 65.4 | 61.0 | 71.3 | 5.02 | 16.2 | 1.97 | 0.540 | 0.322 | 0.705 | 0.994 | 0.756 | 0.606 |
Download Data |
Period Mean (original grids) [%] |
Model Period Mean (intersection) [%] |
Model Period Mean (complement) [%] |
Benchmark Period Mean (intersection) [%] |
Benchmark Period Mean (complement) [%] |
Bias [%] |
RMSE [%] |
Phase Shift [months] |
Bias Score [1] |
RMSE Score [1] |
Seasonal Cycle Score [1] |
Spatial Distribution Score [1] |
Interannual Variability Score [1] |
Overall Score [1] |
|||
|---|---|---|---|---|---|---|---|---|---|---|---|---|---|---|---|---|---|
| Benchmark | [-] | 69.0 | |||||||||||||||
| CLM5PHSOFF | [-] | 64.4 | 64.0 | 68.3 | 79.0 | -4.35 | 11.7 | 0.928 | 0.597 | 0.391 | 0.873 | 0.941 | 0.659 | 0.642 | |||
| CLM5PHSON | [-] | 62.1 | 61.8 | 68.3 | 79.0 | -4.10 | 11.5 | 0.920 | 0.608 | 0.395 | 0.875 | 0.943 | 0.655 | 0.645 |
Download Data |
Period Mean (original grids) [%] |
Model Period Mean (intersection) [%] |
Model Period Mean (complement) [%] |
Benchmark Period Mean (intersection) [%] |
Benchmark Period Mean (complement) [%] |
Bias [%] |
RMSE [%] |
Phase Shift [months] |
Bias Score [1] |
RMSE Score [1] |
Seasonal Cycle Score [1] |
Spatial Distribution Score [1] |
Interannual Variability Score [1] |
Overall Score [1] |
|||
|---|---|---|---|---|---|---|---|---|---|---|---|---|---|---|---|---|---|
| Benchmark | [-] | 78.8 | |||||||||||||||
| CLM5PHSOFF | [-] | 89.0 | 89.0 | 78.5 | 84.9 | 10.4 | 16.4 | 2.77 | 0.152 | 0.0976 | 0.564 | 0.824 | 0.522 | 0.376 | |||
| CLM5PHSON | [-] | 88.9 | 88.9 | 78.5 | 84.9 | 10.5 | 16.2 | 3.05 | 0.149 | 0.102 | 0.497 | 0.827 | 0.518 | 0.366 |
Download Data |
Period Mean (original grids) [%] |
Model Period Mean (intersection) [%] |
Model Period Mean (complement) [%] |
Benchmark Period Mean (intersection) [%] |
Benchmark Period Mean (complement) [%] |
Bias [%] |
RMSE [%] |
Phase Shift [months] |
Bias Score [1] |
RMSE Score [1] |
Seasonal Cycle Score [1] |
Spatial Distribution Score [1] |
Interannual Variability Score [1] |
Overall Score [1] |
|||
|---|---|---|---|---|---|---|---|---|---|---|---|---|---|---|---|---|---|
| Benchmark | [-] | 53.1 | |||||||||||||||
| CLM5PHSOFF | [-] | 52.7 | 52.6 | 51.3 | 74.6 | 1.26 | 6.89 | 0.482 | 0.739 | 0.521 | 0.917 | 0.996 | 0.806 | 0.750 | |||
| CLM5PHSON | [-] | 50.0 | 50.0 | 51.3 | 74.6 | 1.27 | 6.95 | 0.506 | 0.738 | 0.518 | 0.913 | 0.997 | 0.801 | 0.748 |
Download Data |
Period Mean (original grids) [%] |
Model Period Mean (intersection) [%] |
Model Period Mean (complement) [%] |
Benchmark Period Mean (intersection) [%] |
Benchmark Period Mean (complement) [%] |
Bias [%] |
RMSE [%] |
Phase Shift [months] |
Bias Score [1] |
RMSE Score [1] |
Seasonal Cycle Score [1] |
Spatial Distribution Score [1] |
Interannual Variability Score [1] |
Overall Score [1] |
|||
|---|---|---|---|---|---|---|---|---|---|---|---|---|---|---|---|---|---|
| Benchmark | [-] | 76.7 | |||||||||||||||
| CLM5PHSOFF | [-] | 77.1 | 77.1 | 76.6 | 78.3 | 0.511 | 9.37 | 0.884 | 0.599 | 0.308 | 0.880 | 0.759 | 0.626 | 0.580 | |||
| CLM5PHSON | [-] | 77.5 | 77.5 | 76.6 | 78.3 | 0.920 | 9.32 | 0.889 | 0.609 | 0.308 | 0.878 | 0.777 | 0.624 | 0.584 |
Download Data |
Period Mean (original grids) [%] |
Model Period Mean (intersection) [%] |
Model Period Mean (complement) [%] |
Benchmark Period Mean (intersection) [%] |
Benchmark Period Mean (complement) [%] |
Bias [%] |
RMSE [%] |
Phase Shift [months] |
Bias Score [1] |
RMSE Score [1] |
Seasonal Cycle Score [1] |
Spatial Distribution Score [1] |
Interannual Variability Score [1] |
Overall Score [1] |
|||
|---|---|---|---|---|---|---|---|---|---|---|---|---|---|---|---|---|---|
| Benchmark | [-] | 74.9 | |||||||||||||||
| CLM5PHSOFF | [-] | 70.7 | 70.7 | 65.3 | 79.6 | 5.44 | 14.1 | 1.54 | 0.411 | 0.299 | 0.758 | 0.945 | 0.651 | 0.561 | |||
| CLM5PHSON | [-] | 69.5 | 69.5 | 65.3 | 79.6 | 5.43 | 14.1 | 1.53 | 0.410 | 0.299 | 0.759 | 0.945 | 0.644 | 0.559 |
Download Data |
Period Mean (original grids) [%] |
Model Period Mean (intersection) [%] |
Model Period Mean (complement) [%] |
Benchmark Period Mean (intersection) [%] |
Benchmark Period Mean (complement) [%] |
Bias [%] |
RMSE [%] |
Phase Shift [months] |
Bias Score [1] |
RMSE Score [1] |
Seasonal Cycle Score [1] |
Spatial Distribution Score [1] |
Interannual Variability Score [1] |
Overall Score [1] |
|||
|---|---|---|---|---|---|---|---|---|---|---|---|---|---|---|---|---|---|
| Benchmark | [-] | 37.9 | |||||||||||||||
| CLM5PHSOFF | [-] | 43.1 | 43.0 | 36.6 | 70.8 | 6.32 | 12.3 | 0.589 | 0.492 | 0.431 | 0.895 | 0.916 | 0.743 | 0.651 | |||
| CLM5PHSON | [-] | 41.2 | 41.3 | 36.6 | 70.8 | 6.28 | 12.3 | 0.578 | 0.494 | 0.429 | 0.897 | 0.920 | 0.745 | 0.652 |
Download Data |
Period Mean (original grids) [%] |
Model Period Mean (intersection) [%] |
Model Period Mean (complement) [%] |
Benchmark Period Mean (intersection) [%] |
Benchmark Period Mean (complement) [%] |
Bias [%] |
RMSE [%] |
Phase Shift [months] |
Bias Score [1] |
RMSE Score [1] |
Seasonal Cycle Score [1] |
Spatial Distribution Score [1] |
Interannual Variability Score [1] |
Overall Score [1] |
|||
|---|---|---|---|---|---|---|---|---|---|---|---|---|---|---|---|---|---|
| Benchmark | [-] | 77.9 | |||||||||||||||
| CLM5PHSOFF | [-] | 89.1 | 89.1 | 77.6 | 82.9 | 11.5 | 17.2 | 2.68 | 0.147 | 0.118 | 0.582 | 1.00 | 0.626 | 0.432 | |||
| CLM5PHSON | [-] | 88.6 | 88.6 | 77.6 | 82.9 | 11.4 | 17.0 | 2.57 | 0.149 | 0.120 | 0.604 | 0.999 | 0.614 | 0.434 |
Download Data |
Period Mean (original grids) [%] |
Model Period Mean (intersection) [%] |
Model Period Mean (complement) [%] |
Benchmark Period Mean (intersection) [%] |
Benchmark Period Mean (complement) [%] |
Bias [%] |
RMSE [%] |
Phase Shift [months] |
Bias Score [1] |
RMSE Score [1] |
Seasonal Cycle Score [1] |
Spatial Distribution Score [1] |
Interannual Variability Score [1] |
Overall Score [1] |
|||
|---|---|---|---|---|---|---|---|---|---|---|---|---|---|---|---|---|---|
| Benchmark | [-] | 69.8 | |||||||||||||||
| CLM5PHSOFF | [-] | 68.8 | 68.8 | 68.1 | 78.3 | 0.803 | 9.55 | 1.64 | 0.481 | 0.333 | 0.745 | 0.988 | 0.644 | 0.587 | |||
| CLM5PHSON | [-] | 66.7 | 66.8 | 68.1 | 78.3 | 0.789 | 9.54 | 1.62 | 0.485 | 0.334 | 0.749 | 0.988 | 0.640 | 0.588 |
Download Data |
Period Mean (original grids) [%] |
Model Period Mean (intersection) [%] |
Model Period Mean (complement) [%] |
Benchmark Period Mean (intersection) [%] |
Benchmark Period Mean (complement) [%] |
Bias [%] |
RMSE [%] |
Phase Shift [months] |
Bias Score [1] |
RMSE Score [1] |
Seasonal Cycle Score [1] |
Spatial Distribution Score [1] |
Interannual Variability Score [1] |
Overall Score [1] |
|||
|---|---|---|---|---|---|---|---|---|---|---|---|---|---|---|---|---|---|
| Benchmark | [-] | 69.7 | |||||||||||||||
| CLM5PHSOFF | [-] | 76.0 | 76.0 | 69.4 | 76.3 | 6.64 | 11.7 | 2.75 | 0.366 | 0.245 | 0.569 | 0.998 | 0.697 | 0.520 | |||
| CLM5PHSON | [-] | 76.3 | 76.3 | 69.4 | 76.3 | 6.86 | 11.7 | 2.73 | 0.356 | 0.249 | 0.570 | 0.999 | 0.685 | 0.518 |
Download Data |
Period Mean (original grids) [%] |
Model Period Mean (intersection) [%] |
Model Period Mean (complement) [%] |
Benchmark Period Mean (intersection) [%] |
Benchmark Period Mean (complement) [%] |
Bias [%] |
RMSE [%] |
Phase Shift [months] |
Bias Score [1] |
RMSE Score [1] |
Seasonal Cycle Score [1] |
Spatial Distribution Score [1] |
Interannual Variability Score [1] |
Overall Score [1] |
|||
|---|---|---|---|---|---|---|---|---|---|---|---|---|---|---|---|---|---|
| Benchmark | [-] | 72.4 | |||||||||||||||
| CLM5PHSOFF | [-] | 82.0 | 82.0 | 72.0 | 81.9 | 9.98 | 15.3 | 1.67 | 0.292 | 0.234 | 0.776 | 0.973 | 0.711 | 0.537 | |||
| CLM5PHSON | [-] | 81.9 | 81.9 | 72.0 | 81.9 | 9.94 | 15.0 | 1.50 | 0.294 | 0.243 | 0.809 | 0.971 | 0.693 | 0.542 |
Download Data |
Period Mean (original grids) [%] |
Model Period Mean (intersection) [%] |
Model Period Mean (complement) [%] |
Benchmark Period Mean (intersection) [%] |
Benchmark Period Mean (complement) [%] |
Bias [%] |
RMSE [%] |
Phase Shift [months] |
Bias Score [1] |
RMSE Score [1] |
Seasonal Cycle Score [1] |
Spatial Distribution Score [1] |
Interannual Variability Score [1] |
Overall Score [1] |
|||
|---|---|---|---|---|---|---|---|---|---|---|---|---|---|---|---|---|---|
| Benchmark | [-] | 53.7 | |||||||||||||||
| CLM5PHSOFF | [-] | 64.1 | 64.2 | 53.2 | 81.4 | 11.1 | 15.6 | 1.12 | 0.414 | 0.427 | 0.869 | 0.986 | 0.801 | 0.654 | |||
| CLM5PHSON | [-] | 64.0 | 64.0 | 53.2 | 81.4 | 11.1 | 15.6 | 1.07 | 0.413 | 0.427 | 0.871 | 0.987 | 0.793 | 0.653 |
Download Data |
Period Mean (original grids) [%] |
Model Period Mean (intersection) [%] |
Model Period Mean (complement) [%] |
Benchmark Period Mean (intersection) [%] |
Benchmark Period Mean (complement) [%] |
Bias [%] |
RMSE [%] |
Phase Shift [months] |
Bias Score [1] |
RMSE Score [1] |
Seasonal Cycle Score [1] |
Spatial Distribution Score [1] |
Interannual Variability Score [1] |
Overall Score [1] |
|||
|---|---|---|---|---|---|---|---|---|---|---|---|---|---|---|---|---|---|
| Benchmark | [-] | 84.9 | |||||||||||||||
| CLM5PHSOFF | [-] | 80.6 | 80.6 | 85.0 | 81.5 | -4.39 | 10.5 | 1.29 | 0.445 | 0.261 | 0.833 | 0.888 | 0.542 | 0.538 | |||
| CLM5PHSON | [-] | 80.2 | 80.2 | 85.0 | 81.5 | -4.70 | 10.9 | 1.30 | 0.431 | 0.252 | 0.831 | 0.894 | 0.520 | 0.530 |
Download Data |
Period Mean (original grids) [%] |
Model Period Mean (intersection) [%] |
Model Period Mean (complement) [%] |
Benchmark Period Mean (intersection) [%] |
Benchmark Period Mean (complement) [%] |
Bias [%] |
RMSE [%] |
Phase Shift [months] |
Bias Score [1] |
RMSE Score [1] |
Seasonal Cycle Score [1] |
Spatial Distribution Score [1] |
Interannual Variability Score [1] |
Overall Score [1] |
|||
|---|---|---|---|---|---|---|---|---|---|---|---|---|---|---|---|---|---|
| Benchmark | [-] | 70.7 | |||||||||||||||
| CLM5PHSOFF | [-] | 72.1 | 71.9 | 70.4 | 79.2 | 1.49 | 13.0 | 1.32 | 0.462 | 0.322 | 0.826 | 0.728 | 0.718 | 0.563 | |||
| CLM5PHSON | [-] | 71.7 | 71.5 | 70.4 | 79.2 | 1.59 | 13.1 | 1.36 | 0.462 | 0.318 | 0.819 | 0.724 | 0.716 | 0.560 |
Download Data |
Period Mean (original grids) [%] |
Model Period Mean (intersection) [%] |
Model Period Mean (complement) [%] |
Benchmark Period Mean (intersection) [%] |
Benchmark Period Mean (complement) [%] |
Bias [%] |
RMSE [%] |
Phase Shift [months] |
Bias Score [1] |
RMSE Score [1] |
Seasonal Cycle Score [1] |
Spatial Distribution Score [1] |
Interannual Variability Score [1] |
Overall Score [1] |
|||
|---|---|---|---|---|---|---|---|---|---|---|---|---|---|---|---|---|---|
| Benchmark | [-] | 65.5 | |||||||||||||||
| CLM5PHSOFF | [-] | 64.6 | 64.8 | 63.7 | 81.7 | 1.00 | 12.3 | 0.912 | 0.478 | 0.375 | 0.869 | 0.969 | 0.635 | 0.617 | |||
| CLM5PHSON | [-] | 62.9 | 63.1 | 63.7 | 81.7 | 0.944 | 12.3 | 0.915 | 0.480 | 0.372 | 0.868 | 0.972 | 0.633 | 0.616 |
Temporally integrated period mean